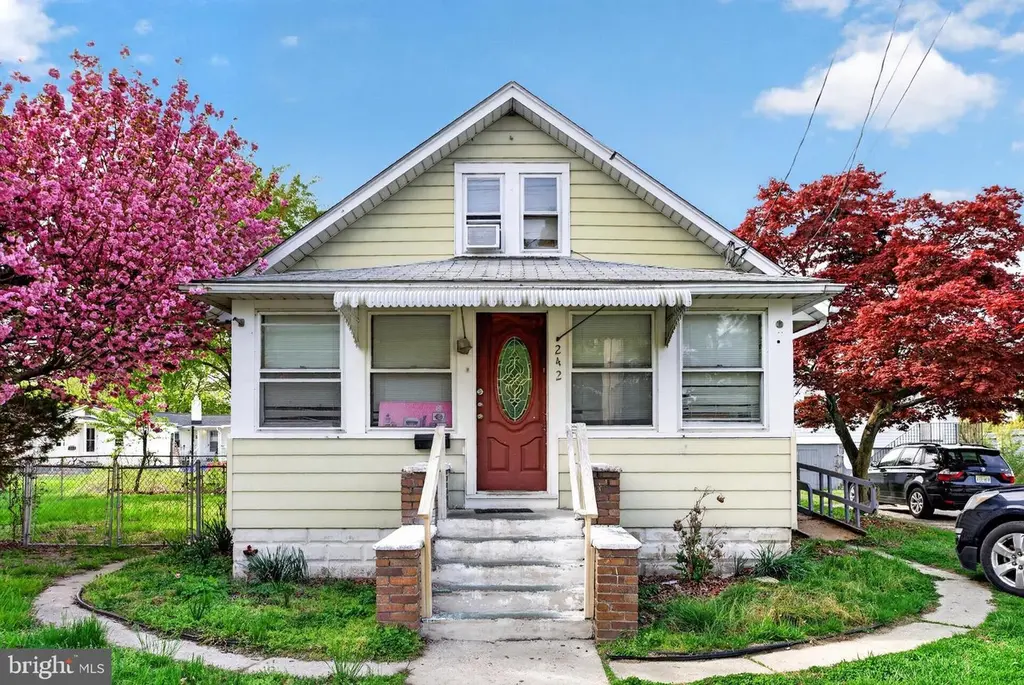
242 N Broad St · Carneys Point, NJ
Flood risk No data
- FEMA flood zone
- —
- Chance of flooding over 30 yrs
- —
- Est. flood insurance / yr
- —
Fire risk No data
- Est. fire insurance / yr
- —
Heat risk No data
- Hot days now (above threshold)
- —
- Hot days in 30 yrs
- —
Wind risk No data
- Chance of severe wind over 30 yrs
- —
Air-quality risk No data
- Unhealthy air days now
- —
- Unhealthy air days in 30 yrs
- —
Risk factors via First Street. Map © Google.
Why this score? — see what drove the C grade
The composite is a weighted blend of 9 inputs, each scored 0–100. Each bar is that input's sub-score; the figure is the points it added to the 100-point composite (weight × sub-score).
- Cash flow +22.8/30.0
- ARV discount +10.0/15.0
- DSCR +7.3/10.0
- 1% rule +6.8/10.0
- Livability +2.9/5.0
- Rent growth +2.5/5.0
- Condition / age +2.5/5.0
- Schools +1.2/10.0
- Appreciation +0.0/10.0
$230,000
🖨 Deal sheet 📄 Offer letter ✓ Due diligence
Listing remarks MLS
Income-producing investment! Tenant-occupied 4BR/1.5BA currently generating $2,000/month in rent, great for investors seeking immediate cash flow. Seller prefers to sell with the adjacent property (244 N Broad) for added upside. Sold as-is. Do not enter without confirmed appointment-tenant occupied.
Key facts
- 7,902 sq ft lot
- Built 1948
- Listed 163 days
Neighborhood map
What this means for you Summary
Snapshot
- This is a 4-bed/1.5-bath single-family listed at $230k.
Deal economics
- At list price, monthly cash flow is $398 ($5k/yr) — positive.
- The deal already cash-flows at list — no discount required.
- Meets the 1% rule at list price ($3k rent vs $230k).
- Recommended offer: $202k (12.0% below list) — sets the bar for market timing.
- Cap rate 8.4% vs local median 5.1% in Carneys Point — top-decile yield for the area; either an underpriced asset or a hidden risk that comps aren't pricing in. Stress-test before assuming the spread holds.
Location & tenants
- Location reads 57/100 on livability (#515 in NJ) — a working-class tenant base; expect higher turnover. Strengths: cost of living A, housing B+; Watch: employment C-, schools D-, amenities F.
- Penns Grove-Carneys Point Regional School District (suburban): math 6% / reading 21% proficiency, ranked #462 of 472 in NJ (top 98%) — low school quality limits family demand, transient renter base, plan for 1-2y turnover; 65% free/reduced lunch — lower-income household profile, screen leases tightly.
- Market conditions: 101 active listings in the ZIP; 2 comparable units currently listed for rent nearby; 95 units permitted in Salem County in 2024 (0 in 5+ unit buildings).
- At $2,717/mo this rent would consume 45% of the median local household income ($72k/yr) (locally 696% of renters already pay >50% of income on rent) — very limited rent-growth headroom before tenants either downsize or default.
Forward outlook
- Local home prices are declining (-3.0%/yr); year-one equity from $2k of loan paydown is wiped out by about $7k of value loss. Plan a longer hold.
- Salem County population projected at -23% by 2050 — secular population decline; favor cash flow + early exit over multi-decade hold.
Negotiation context
- It's been on market 164 days — a 12% lower offer ($202k) is reasonable based on typical stale-listing flexibility.
- 3 sale attempts since 7y ago with the ask held roughly flat each time — persistent listings suggest the price (not the market) is what's stuck; bring a comps-based counter.
- Current owner paid $26k; list at $230k implies a 785% gain — meaningful room to come down on a strong offer.
Risks & watch-outs
- Watch-outs: built in 1948 — expect roof / HVAC / electrical / plumbing capex.
Questions for the listing agent
- It's been on market 164 days. Have you received any prior offers? Is the seller open to a 12% concession, seller financing, or rate buy-down credit?
- Built in 1948 — when were the roof, HVAC, electrical panel, plumbing, and water heater last replaced?
- Why hasn't it sold? Are there any deal-killer items the seller is aware of (foundation, flood, title, zoning, code violations)?
- Is there a deadline driving the sale (1031 exchange, divorce, estate, relocation)? That informs how much negotiation room exists.
- Schools are D-rated, which usually means shorter tenancies and higher turnover. Who's the typical renter profile here, and what's been the actual vacancy rate?
- What's the average days-on-market for RENTAL listings here right now (not sales)? A rising rental-DOM trend means longer vacancies and softer asking-rent achievability than the comps imply.
- What's the recent tenant-quality profile in this submarket — average credit score on applications, eviction rate, late-payment / NSF rate, and stable-employment percentage? A property-management company in the area should have these aggregated.
- How much new for-sale + rental construction is in the pipeline within 1–3 miles? Heavy new supply typically softens prices + rents 12–24 months out; constrained supply supports both.
Investment metrics
- 1% rule
- 1.18% ✓
- Cap rate
- 8.37%
- Cash-on-cash
- 7.41%
- DSCR
- 1.33
- GRM
- 7.1
CMA / ARV
- ARV (median comp)
- $243,747
- List price
- $230,000
- Delta
- -5.64%
- Verdict
- FAIR
- Comps
- 20 within 1.0 mi
Show comp detail 12 sales within ~0.75 mi
| Address | Dist | Beds/Ba | Sqft | Sold | Price | $/sf | Match |
|---|---|---|---|---|---|---|---|
| 51 Washington Ave | 0.17mi | 3/1.0 (-1) | 1,525 (-3%) | 1mo | $350,000 | $230 | 80 |
| 311 Pine St | 0.29mi | 3/2.0 (-1) | 1,680 (+7%) | 5mo | $290,000 | $173 | 64 |
| 14 E Union St | 0.44mi | 3/2.0 (-1) | 1,599 (+2%) | 8mo | $331,000 | $207 | 63 |
| 31 Elvin Ave | 0.49mi | 3/1.0 (-1) | 1,555 (-1%) | 7mo | $260,000 | $167 | 63 |
| 111 Grove St | 0.43mi | 4/2.0 | 1,409 (-10%) | 3mo | $279,900 | $199 | 59 |
| 89 Delaware Ave | 0.54mi | 4/2.0 | 1,440 (-8%) | 8mo | $280,000 | $194 | 53 |
| 114 Guest St | 0.44mi | 4/1.0 | 1,440 (-8%) | 15mo | $190,000 | $132 | 51 |
| 111 E Del A Vue Ave | 0.39mi | 3/2.0 (-1) | 1,350 (-14%) | 11mo | $340,000 | $252 | 42 |
| 106 W Harmony St | 0.69mi | 4/2.0 | 1,413 (-10%) | 10mo | $87,500 | $62 | 40 |
| 65 Penn St | 0.64mi | 3/2.0 (-1) | 1,640 (+4%) | 18mo | $250,000 | $152 | 40 |
| 35 Franklin St | 0.65mi | 3/2.5 (-1) | 1,792 (+14%) | 6mo | $335,000 | $187 | 32 |
| 92 N Virginia Ave | 0.61mi | 3/1.0 (-1) | 1,788 (+14%) | 14mo | $175,000 | $98 | 30 |
Match score weights: distance 35% · size 25% · config 20% · recency 20%. Top-matched comps best support the ARV.
Projected returns pro-forma
-3.0% appreciation · 3.0% rent growth · sell at horizon
- IRR
- -4.9%
- Equity multiple
- 0.82×
- Total profit
- $-11,790
- Equity at exit
- $34,294
- IRR
- 4.8%
- Equity multiple
- 1.36×
- Total profit
- $22,929
- Equity at exit
- $19,886
Cash invested: $64,400 (down + closing). Projections, not guarantees.
Landlord ↔ Tenant lean methodology
- Overall (STATE)
- 21 Tenant-Leaning
- State New Jersey
- 21 Tenant-Leaning · D+6
- County
- — inherits STATE
- City
- — inherits STATE
ZIP-level market 08069
- Home prices YoY
- -18.8%
- Active inventory
- 101
- Price-to-rent
- 7.1×
Monthly cashflow live
- Estimated rent
- $2,717 medium interval (Pro) →
- Mortgage (P&I)
- −$1,206
- Tax from tax record
- −$447 /mo · $5,360/yr
- Insurance
- −$96
- HOA
- −$0
- Vacancy / Maint / Mgmt
- −$571
- Net cashflow
- $398
Break-even live
UW: 25.0% down · 7.5% · 30yr · 1.5% tax · 5.0% vac · 8.0% maint · 8.0% mgmt
Financing live
Cash to close
- Down payment
- $57,500
- Closing costs
- $6,900
- Reserves months
- —
- Total cash needed
- —
Loan-product check · same deal, 3 products live
Conventional
25% down · 7.5% · 30yr
- Down + closing
- —
- Monthly P&I
- —
- Monthly cashflow
- —
- DSCR
- —
- Eligible?
- —
Personal DTI + credit; lowest rate.
DSCR
20% down · 8.5% · 30yr
- Down + closing
- —
- Monthly P&I
- —
- Monthly cashflow
- —
- DSCR
- —
- Eligible?
- —
No personal income docs; deal must DSCR.
Hard money
10% down · 12.0% · 12mo
- Down + closing
- —
- Monthly P&I
- —
- Monthly cashflow
- —
- DSCR
- —
- Eligible?
- —
Short-term bridge; refi at stabilization.
Rent comps 2 comps
| Address | Beds | Baths | Sqft | Rent | $/sqft | DOM | Units | Dist |
|---|---|---|---|---|---|---|---|---|
| 79 Delaware Ave Penns Grove, NJ | 3.0 | 1.0 | 1300 | $1,900 | $1.46 | 1d | 1 | 0.56mi |
| 74 Delaware Ave Penns Grove, NJ | 4.0 | 3.0 | 2000 | $2,900 | $1.45 | 43d | 1 | 0.59mi |
Listing history 27 events
-
2026-06-18days on market $230,000 Active 164 DOM
-
2026-06-17days on market $230,000 Active 163 DOM
-
2026-06-16days on market $230,000 Active 162 DOM
-
2026-06-15days on market $230,000 Active 161 DOM
-
2026-06-13days on market $230,000 Active 159 DOM
-
2026-06-09days on market $230,000 Active 155 DOM
-
2026-06-08days on market $230,000 Active 154 DOM
-
2026-06-07days on market $230,000 Active 153 DOM
-
2026-06-04days on market $230,000 Active 150 DOM
-
2026-06-03days on market $230,000 Active 149 DOM
-
2026-06-02days on market $230,000 Active 148 DOM
-
2026-06-01days on market $230,000 Active 147 DOM
-
2026-05-31days on market $230,000 Active 146 DOM
-
2026-04-15price $230,000 300-char remark
Show marketing remark (300 chars)
Income-producing investment! Tenant-occupied 4BR/1.5BA currently generating $2,000/month in rent, great for investors seeking immediate cash flow. Seller prefers to sell with the adjacent property (244 N Broad) for added upside. Sold as-is. Do not enter without confirmed appointment-tenant occupied.
-
2026-01-06$235,000 Active 300-char remark
Show marketing remark (300 chars)
Income-producing investment! Tenant-occupied 4BR/1.5BA currently generating $2,000/month in rent, great for investors seeking immediate cash flow. Seller prefers to sell with the adjacent property (244 N Broad) for added upside. Sold as-is. Do not enter without confirmed appointment-tenant occupied.
-
2025-12-24historical $235,000 300-char remark
Show marketing remark (300 chars)
Income-producing investment! Tenant-occupied 4BR/1.5BA currently generating $2,000/month in rent, great for investors seeking immediate cash flow. Seller prefers to sell with the adjacent property (244 N Broad) for added upside. Sold as-is. Do not enter without confirmed appointment-tenant occupied.
-
2020-07-07soldstatus $26,000 Closed 242-char remark
Show marketing remark (242 chars)
A lot of potential for this cozy 4 bedroom bungalow. Living, front room, kitchen and basement and sits on a nice size lot. Property is being sold as is where is. All inspections are done at buyer's expense, seller will not activate utilities.
-
2020-05-26status Pending 242-char remark
Show marketing remark (242 chars)
A lot of potential for this cozy 4 bedroom bungalow. Living, front room, kitchen and basement and sits on a nice size lot. Property is being sold as is where is. All inspections are done at buyer's expense, seller will not activate utilities.
-
2020-05-23historical Active Under Contract 242-char remark
Show marketing remark (242 chars)
A lot of potential for this cozy 4 bedroom bungalow. Living, front room, kitchen and basement and sits on a nice size lot. Property is being sold as is where is. All inspections are done at buyer's expense, seller will not activate utilities.
-
2020-05-12price $26,000 242-char remark
Show marketing remark (242 chars)
A lot of potential for this cozy 4 bedroom bungalow. Living, front room, kitchen and basement and sits on a nice size lot. Property is being sold as is where is. All inspections are done at buyer's expense, seller will not activate utilities.
-
2020-03-13price $37,000 242-char remark
Show marketing remark (242 chars)
A lot of potential for this cozy 4 bedroom bungalow. Living, front room, kitchen and basement and sits on a nice size lot. Property is being sold as is where is. All inspections are done at buyer's expense, seller will not activate utilities.
-
2020-03-05price $39,000 242-char remark
Show marketing remark (242 chars)
A lot of potential for this cozy 4 bedroom bungalow. Living, front room, kitchen and basement and sits on a nice size lot. Property is being sold as is where is. All inspections are done at buyer's expense, seller will not activate utilities.
-
2020-03-05status Active 242-char remark
Show marketing remark (242 chars)
A lot of potential for this cozy 4 bedroom bungalow. Living, front room, kitchen and basement and sits on a nice size lot. Property is being sold as is where is. All inspections are done at buyer's expense, seller will not activate utilities.
-
2020-02-25historical 242-char remark
Show marketing remark (242 chars)
A lot of potential for this cozy 4 bedroom bungalow. Living, front room, kitchen and basement and sits on a nice size lot. Property is being sold as is where is. All inspections are done at buyer's expense, seller will not activate utilities.
-
2020-02-06price $49,000 242-char remark
Show marketing remark (242 chars)
A lot of potential for this cozy 4 bedroom bungalow. Living, front room, kitchen and basement and sits on a nice size lot. Property is being sold as is where is. All inspections are done at buyer's expense, seller will not activate utilities.
-
2019-11-26$79,000 Active 242-char remark
Show marketing remark (242 chars)
A lot of potential for this cozy 4 bedroom bungalow. Living, front room, kitchen and basement and sits on a nice size lot. Property is being sold as is where is. All inspections are done at buyer's expense, seller will not activate utilities.
-
1985-03-22soldstatus $35,000
ⓘ Source: listings_history table (triggers on properties + properties_extension) + one-shot
backfill from property_details.listing_events for pre-trigger history.
Tax reassessment forecast NJ · Partial reset (capped growth)
- Current annual tax
- $5,360 · $447/mo
- Projected year-2 tax
- $5,543 · $462/mo
- Expected delta
- +$184/yr (+$15/mo · 3.4%)
ⓘ Screening estimate from a state-policy table — verify with the county assessor before closing.
Nearby sold comps map
Loading sold comps map…
Walkable amenities ~0.75 mi
Loading nearby amenities…
Taxation est. · year 1
- Rental income
- $32,605
- − Mortgage interest
- −$12,884
- − Property taxes
- −$5,360
- − Insurance
- −$1,150
- − Repairs & maintenance
- −$2,608
- − Management
- −$2,608
- − Depreciation
- −$6,691
- Taxable income
- $1,304
- Est. tax owed @ 24.0%
- −$313
- After-tax cash flow
- $4,462/yr
For passive investors: Depreciation is non-cash, so a rental often shows a tax loss while cash-flowing — sheltering income. Rental losses are passive: they offset passive income freely, and up to $25,000/yr can offset ordinary (W-2) income if you actively participate and your MAGI is under $100k (phasing out to $0 by $150k); unused losses carry forward. On sale, claimed depreciation is recaptured at up to 25%, and gains may owe capital-gains tax (a 1031 exchange can defer both). Figures are a year-1 estimate at your 24.0% rate — not tax advice; consult a CPA.
Schools (NCES district)
- District
- Penns Grove-Carneys Point Regional School District
- NCES district ID
- 3412840
- Math proficiency
- 6% ▼ -16.00%
- Reading proficiency
- 21% ▼ -7.00%
- Median HH income
- $44,930
- Composite
- 11.98/100
- National rank
- #9665
- State rank
- #462 of 472 in NJ
Livability — Carneys Point
- Score
- 57/100
- State rank
- #515
- US rank
- #21958
Category grades
Schools grade is shown separately in the Schools card above.
Census & demographics
- Census place
- Carneys Point, NJ
- County
- Salem County · 24,175 people
- City population
- 13,413
- Metro
- Philadelphia-Camden-Wilmington, PA-NJ-DE-MD
- Population (ZIP)
- 13,413
- Household income
- $71,942
- Rent vs Own
- Severe rent burden
- 696.0
Population outlook (Salem County) Hauer SSP2
- Today (2025)
- 59,905 people
- By 2030
- 57,351 · -4.3%
- By 2040
- 51,837 · -13.5%
- By 2050
- 46,356 · -22.6%
- By 2075
- 36,452 · -39.2%
- By 2100
- 28,907 · -51.7%
Race, ethnicity, and origin ACS 2023
- Neighborhood character
- Diverse neighborhood (Simpson 0.65)
- Race & ethnicity
- White 50% Hispanic / Latino 22% Black 22% Two or more races 8% Asian 2%
- Hispanic origin (detail)
- Mexican 5% Puerto Rican 14%
- Common ancestry
- Romanian 3% Slovak 2% Lithuanian 1%
- Foreign-born
- 5% · Canada
- Languages at home
- 85% English-only · Spanish 13% Tagalog/Filipino 1%
Political lean MEDSL · Salem
- 2024 margin
- R (+19.2) · D 39.6% · R 58.8% · Other 1.6%
- 2008→2024 swing
- -23.1pp toward R · 2008: 3.9pp · 2024: -19.2pp
- All cycles
- 2024: R+19.2 2020: R+12.8 2016: R+15.4 2012: D+0.8 2008: D+3.9
Not yet ingested
- Civics
- —
Market trends
- HPI YoY
- ▼ -67.07%
- Current HPI
- 290.3853
- Rent YoY
- —
- Metro
- Philadelphia-Camden-Wilmington, PA-NJ-DE-MD
- State GDP YoY
- ▲ 2.05%
- F500 in state
- 34
Industry mix (Fortune 500 HQ in NJ)
| Industry | F500 HQs | Revenue |
|---|---|---|
| Consumer Goods | 3 | $31B |
|
||
| Pharmaceuticals | 2 | $153B |
|
||
| Technology | 2 | $21B |
|
||
| Insurance | 2 | $20B |
|
||
| Healthcare | 2 | $19B |
|
||
| Financial Services | 1 | $70B |
|
||
Price history
+557.1% since first listed14 events — show timeline
- 2026-04-15 Price Changed $230,000 BRIGHT MLS
- 2026-01-06 Listed $235,000 BRIGHT MLS
- 2025-12-24 Coming Soon $235,000 BRIGHT MLS
- 2020-07-07 Sold (MLS) $26,000 BRIGHT MLS
- 2020-05-26 Pending — BRIGHT MLS
- 2020-05-23 Contingent — BRIGHT MLS
- 2020-05-12 Price Changed $26,000 BRIGHT MLS
- 2020-03-13 Price Changed $37,000 BRIGHT MLS
- 2020-03-05 Price Changed $39,000 BRIGHT MLS
- 2020-03-05 Relisted — BRIGHT MLS
- 2020-02-25 Listing Removed — BRIGHT MLS
- 2020-02-06 Price Changed $49,000 BRIGHT MLS
- 2019-11-26 Listed $79,000 BRIGHT MLS
- 1985-03-22 Sold (Public Records) $35,000 Public Records
Property tax history
+3.7%/yrLatest (2025): $5,360 · +12.3% YoY. Source: county tax records.
Cash-flow waterfall
monthlySold comps — $/sqft
last 12 mo · ≤1 miLoading sold comps…