 Multi-family
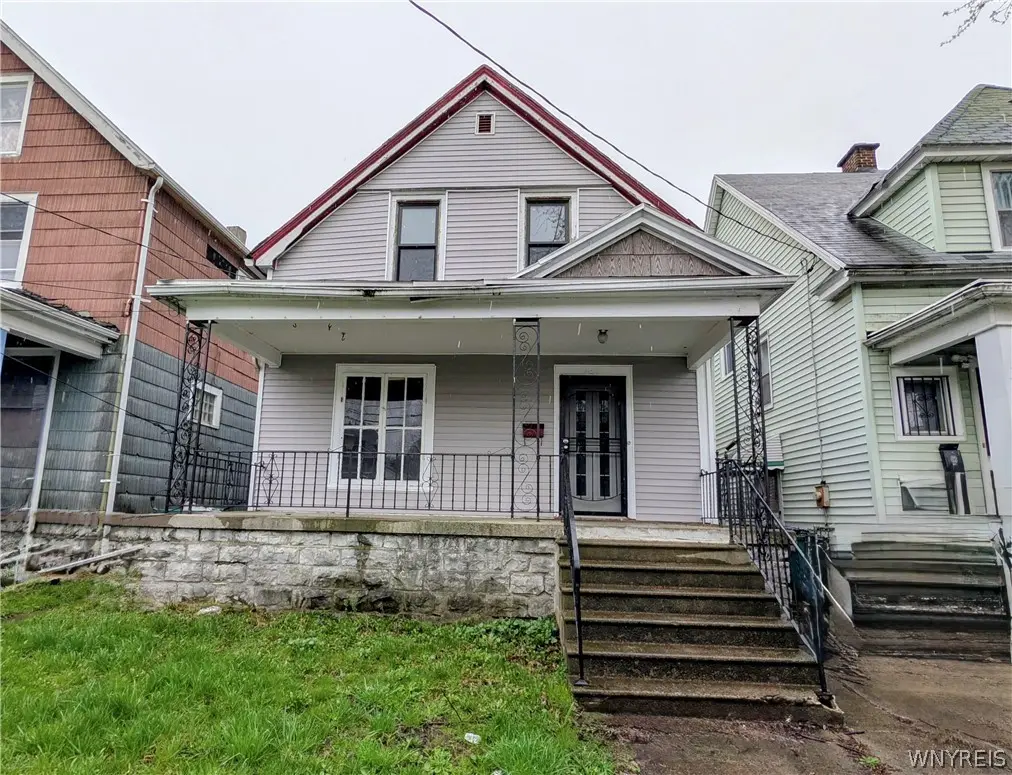
249 Dewey Ave S · Buffalo, NY
Flood risk 1/10 · Minimal
- FEMA flood zone
- X (unshaded)
- Chance of flooding over 30 yrs
- 0.0%
- Est. flood insurance / yr
- $507 – $1,088
Fire risk 1/10 · Minimal
- Est. fire insurance / yr
- $691 – $1,283
Heat risk 3/10 · Minor
- Hot days now (above 93°F)
- 7 days/yr
- Hot days in 30 yrs
- 15 days/yr
Wind risk 1/10 · Minimal
- Chance of severe wind over 30 yrs
- —
Air-quality risk 3/10 · Minor
- Unhealthy air days now
- 2 days/yr
- Unhealthy air days in 30 yrs
- 3 days/yr
Risk factors via First Street. Map © Google.
Why this score? — see what drove the B+ grade
The composite is a weighted blend of 9 inputs, each scored 0–100. Each bar is that input's sub-score; the figure is the points it added to the 100-point composite (weight × sub-score).
- Cash flow +30.0/30.0
- ARV discount +15.0/15.0
- 1% rule +10.0/10.0
- DSCR +10.0/10.0
- Rent growth +4.0/5.0
- Livability +3.9/5.0
- Schools +3.3/10.0
- Condition / age +2.5/5.0
- Appreciation +0.0/10.0
$189,999
🖨 Deal sheet (PDF) 📄 Offer letter ✓ Due diligence
Multi-family units
County records classify this as Multi-Family (2-4 Unit). Listing-text estimate: 1 unit. estimate disagrees with records
Listing remarks MLS
Welcome to 249 Dewey Ave, Buffalo, NY 14214, Don’t miss this incredible opportunity to own a home in a convenient and desirable location. Whether you're a first-time buyer, investor, or looking to downsize, this property offers great potential and value. in the future, if you wish, you can arrange to one park in the driveway. With the "SELLER MAKING REPAIRS BASED ON HOME INSPECTION OR APPRAISAL" \ The property is currently vacant, making for a smooth and quick transition. The furnace for the second floor is located in the right-hand corner as you ascend to the second level, while the furnace for the first floor is situated in the basement. Ideally located near grocery bus routes, you’ll enjoy easy access to everything you need. The lockbox is located in front of the door, please enter through the front door, to access the second floor, open the door situated to the left of the kitchen on the first floor. Once your viewing is complete, please turn off the lights and ensure the door is closed behind you. Offers will be reviewed as they are received, so don’t wait! Please allow 24–48 hours for a response to any submitted offers.
Key facts
- 3,600 sq ft lot
- Built 1920
- Listed 61 days
Neighborhood map
What this means for you Summary
Snapshot
- This is a 6-bed/2.0-bath multifamily listed at $190k.
Deal economics
- At list price, monthly cash flow is $1k ($14k/yr) — positive.
- The deal already cash-flows at list — no discount required.
- Meets the 1% rule at list price ($3k rent vs $190k).
- Recommended offer: $179k (6.0% below list) — sets the bar for market timing.
- Cap rate 13.5% vs local median 8.0% in Buffalo — top-decile yield for the area; either an underpriced asset or a hidden risk that comps aren't pricing in. Stress-test before assuming the spread holds.
Location & tenants
- Location reads 77/100 on livability (#195 in NY, #3,011 nationally) — a middle-class / working-renter tenant base. Strengths: commute A+, housing A+, health & safety A+; Watch: crime F, employment D-.
- Buffalo City School District (urban): math 41% / reading 40% proficiency, ranked #535 of 590 in NY (top 91%) — families likely to look elsewhere, expect single-tenant / working-renter base with shorter leases; 75% free/reduced lunch — lower-income household profile, screen leases tightly.
- Market conditions: Rents rising fast (+5.8%/yr); 92 active listings in the ZIP; 6 comparable units currently listed for rent nearby; rentals at typical pace (median 16d on market — plan ~3-4 weeks tenant-placement turnaround); 1,244 units permitted in Erie County in 2024 (563 in 5+ unit buildings).
- At $3,113/mo this rent would consume 64% of the median local household income ($58k/yr) (locally 1820% of renters already pay >50% of income on rent) — very limited rent-growth headroom before tenants either downsize or default.
Forward outlook
- Local home prices are declining (-3.0%/yr); year-one equity from $1k of loan paydown is wiped out by about $6k of value loss. Plan a longer hold.
- At projected returns (-3.0% appreciation + 5.8% rent growth), your $53k cash investment doubles in ~5 years — after that, you're playing with house money.
Negotiation context
- It's been on market 62 days — a 6% lower offer ($179k) is reasonable based on typical stale-listing flexibility.
- 5 sale attempts since 8y ago with the ask held roughly flat each time — persistent listings suggest the price (not the market) is what's stuck; bring a comps-based counter.
Risks & watch-outs
- Watch-outs: built in 1920 — expect roof / HVAC / electrical / plumbing capex.
Questions for the listing agent
- It's been on market 62 days. Have you received any prior offers? Is the seller open to a 6% concession, seller financing, or rate buy-down credit?
- Built in 1920 — when were the roof, HVAC, electrical panel, plumbing, and water heater last replaced?
- Why hasn't it sold? Are there any deal-killer items the seller is aware of (foundation, flood, title, zoning, code violations)?
- Is there a deadline driving the sale (1031 exchange, divorce, estate, relocation)? That informs how much negotiation room exists.
- Crime grade is F in this area — have there been break-ins, vandalism, or insurance claims at this property in the last 3 years? What carrier currently insures it and at what premium?
- What's the average days-on-market for RENTAL listings here right now (not sales)? A rising rental-DOM trend means longer vacancies and softer asking-rent achievability than the comps imply.
- What's the recent tenant-quality profile in this submarket — average credit score on applications, eviction rate, late-payment / NSF rate, and stable-employment percentage? A property-management company in the area should have these aggregated.
- How much new apartment / multifamily construction is in the pipeline within 1–3 miles? Heavy new supply (>2% of stock underway) typically softens rents 12–24 months out; light construction supports rent growth.
Investment metrics
- 1% rule
- 1.64% ✓
- Cap rate
- 13.53%
- Cash-on-cash
- 25.85%
- DSCR
- 2.15
- GRM
- 5.1
CMA / ARV
- ARV (median comp)
- $269,158
- List price
- $189,999
- Delta
- -29.41%
- Verdict
- UNDERPRICED
- Comps
- 20 within 1.0 mi
Show comp detail 11 sales within ~0.75 mi
| Address | Dist | Beds/Ba | Sqft | Sold | Price | $/sf | Match |
|---|---|---|---|---|---|---|---|
| 92 Wakefield Ave | 0.27mi | 6/2.0 | 2,046 (-1%) | 8mo | $190,000 | $93 | 80 |
| 258 Leroy Ave | 0.17mi | 6/2.0 | 2,200 (+7%) | 6mo | $220,000 | $100 | 76 |
| 2032 Fillmore Ave | 0.16mi | 6/2.0 | 2,226 (+8%) | 10mo | $150,000 | $67 | 71 |
| 2042 Fillmore Ave | 0.14mi | 6/2.0 | 1,826 (-11%) | 8mo | $220,000 | $120 | 67 |
| 168 Rodney Ave | 0.37mi | 6/2.0 | 2,199 (+7%) | 7mo | $175,000 | $80 | 66 |
| 114 Manhattan Ave | 0.59mi | 5/2.0 (-1) | 2,052 (-0%) | 16mo | $158,000 | $77 | 54 |
| 96 Sussex St | 0.69mi | 5/2.0 (-1) | 2,152 (+4%) | 4mo | $255,000 | $118 | 52 |
| 48 Oakgrove Ave | 0.70mi | 6/2.0 | 2,200 (+7%) | 7mo | $318,000 | $145 | 50 |
| 198 Jewett Ave | 0.20mi | 6/2.0 | 2,362 (+15%) | 20mo | $270,000 | $114 | 50 |
| 482 Leroy Ave | 0.54mi | 6/2.0 | 2,244 (+9%) | 20mo | $141,000 | $63 | 44 |
| 41 Vernon Pl Pl | 0.59mi | 5/2.0 (-1) | 2,330 (+13%) | 21mo | $344,000 | $148 | 28 |
Match score weights: distance 35% · size 25% · config 20% · recency 20%. Top-matched comps best support the ARV.
Projected returns pro-forma
-3.0% appreciation · 5.81% rent growth · sell at horizon
- IRR
- 22.7%
- Equity multiple
- 1.96×
- Total profit
- $51,296
- Equity at exit
- $28,329
- IRR
- 32.4%
- Equity multiple
- 4.35×
- Total profit
- $178,176
- Equity at exit
- $16,428
Cash invested: $53,200 (down + closing). Projections, not guarantees.
Landlord ↔ Tenant lean methodology
- Overall (STATE)
- 15 Strongly Tenant-Friendly
- State New York
- 15 Strongly Tenant-Friendly · D+10
- County
- — inherits STATE
- City
- — inherits STATE
ZIP-level market 14214
- Rents YoY
- 5.8%
- Active inventory
- 92
- Price-to-rent
- 5.1×
Monthly cashflow live
- Estimated rent
- $3,113 high interval (Pro) →
- Mortgage (P&I)
- −$996
- Tax est. 1.5%
- −$237 /mo · $2,850/yr
- Insurance
- −$79
- HOA
- −$0
- Vacancy / Maint / Mgmt
- −$654
- Net cashflow
- $1,146
Break-even live
Sensitivity live
| Price | -10% $1,277 | -5% $1,212 | +0% $1,146 | +5% $1,080 | +10% $1,015 |
|---|---|---|---|---|---|
| Rent | -10% $900 | -5% $1,023 | +0% $1,146 | +5% $1,269 | +10% $1,392 |
| Rate | -1.0pp $1,242 | -0.5pp $1,194 | base $1,146 | +0.5pp $1,097 | +1.0pp $1,047 |
UW: 25.0% down · 7.5% · 30yr · 1.5% tax · 5.0% vac · 8.0% maint · 8.0% mgmt
Financing live
Cash to close
- Down payment
- $47,500
- Closing costs
- $5,700
- Reserves months
- —
- Total cash needed
- —
Loan-product check · same deal, 3 products live
Conventional
25% down · 7.5% · 30yr
- Down + closing
- —
- Monthly P&I
- —
- Monthly cashflow
- —
- DSCR
- —
- Eligible?
- —
Personal DTI + credit; lowest rate.
DSCR
20% down · 8.5% · 30yr
- Down + closing
- —
- Monthly P&I
- —
- Monthly cashflow
- —
- DSCR
- —
- Eligible?
- —
No personal income docs; deal must DSCR.
Hard money
10% down · 12.0% · 12mo
- Down + closing
- —
- Monthly P&I
- —
- Monthly cashflow
- —
- DSCR
- —
- Eligible?
- —
Short-term bridge; refi at stabilization.
Rent comps 6 comps
| Address | Beds | Baths | Sqft | Rent | $/sqft | DOM | Units | Dist |
|---|---|---|---|---|---|---|---|---|
| 15 Hughes Ave Buffalo, NY | 7.0 | 2.0 | 1650 | $3,000 | $1.82 | 44d | 1 | 0.90mi |
| 145 Minnesota Ave Buffalo, NY | 7.0 | 2.0 | 2551 | $4,900 | $1.92 | 15d | 1 | 1.29mi |
| 175 Lisbon Ave Buffalo, NY | 5.0 | 2.0 | 2000 | $2,500 | $1.25 | 15d | 1 | 1.39mi |
| 85 Highgate Ave Buffalo, NY | 5.0 | 2.0 | 2193 | $3,750 | $1.71 | 15d | 1 | 1.40mi |
| 24 Custer St Buffalo, NY | 5.0 | 2.0 | 2500 | $3,000 | $1.20 | 15d | 1 | 1.40mi |
| 65 Northrup Pl Buffalo, NY | 5.0 | 2.0 | 1467 | $2,500 | $1.70 | 15d | 1 | 1.47mi |
Listing history 25 events
-
2026-06-21days on market $189,999 Active 62 DOM
-
2026-06-18days on market $189,999 Active 59 DOM
-
2026-06-17days on market $189,999 Active 58 DOM
-
2026-06-16days on market $189,999 Active 57 DOM
-
2026-06-15days on market $189,999 Active 56 DOM
-
2026-06-13days on market $189,999 Active 54 DOM
-
2026-06-13days on market $189,999 Active 53 DOM
-
2026-06-10days on market $189,999 Active 51 DOM
-
2026-06-09days on market $189,999 Active 50 DOM
-
2026-06-08days on market $189,999 Active 49 DOM
-
2026-06-07days on market $189,999 Active 48 DOM
-
2026-06-03days on market $189,999 Active 44 DOM
-
2026-06-02days on market $189,999 Active 43 DOM
-
2026-06-01days on market $189,999 Active 42 DOM
-
2026-05-31days on market $189,999 Active 41 DOM
-
2026-04-20$189,999 Active 1179-char remark
Show marketing remark (1179 chars)
Welcome to 249 Dewey Ave, Buffalo, NY 14214, Don’t miss this incredible opportunity to own a home in a convenient and desirable location. Whether you're a first-time buyer, investor, or looking to downsize, this property offers great potential and value. in the future, if you wish, you can arrange to one park in the driveway. With the "SELLER MAKING REPAIRS BASED ON HOME INSPECTION OR APPRAISAL" \ The property is currently vacant, making for a smooth and quick transition. The furnace for the second floor is located in the right-hand corner as you ascend to the second level, while the furnace for the first floor is situated in the basement. Ideally located near grocery bus routes, you’ll enjoy easy access to everything you need. The lockbox is located in front of the door, please enter through the front door, to access the second floor, open the door situated to the left of the kitchen on the first floor. Once your viewing is complete, please turn off the lights and ensure the door is closed behind you. Offers will be reviewed as they are received, so don’t wait! Please allow 24–48 hours for a response to any submitted offers.
-
2025-10-26historical
-
2025-08-26$174,999 Active
-
2023-12-06historical
-
2023-10-03price $169,900
-
2023-09-06$179,900 Active
-
2019-06-21historical
-
2019-04-03$50,000 Active
-
2018-03-02historical
-
2018-02-20$54,900 Active
ⓘ Source: listings_history table (triggers on properties + properties_extension) + one-shot
backfill from property_details.listing_events for pre-trigger history.
Climate risk First Street
- Flood 1/10 Low FEMA zone X (unshaded) · 0% chance over 30 yrs
- Wildfire 1/10 Low
- Heat 3/10 Moderate 7 d/yr ≥93°F today · 15 d/yr by 30 yrs out
- Wind 1/10 Low
- Air quality 3/10 Moderate 2 unhealthy d/yr today · 3 by 30 yrs out
Nearby sold comps map
Loading sold comps map…
Walkable amenities ~0.75 mi
Loading nearby amenities…
Taxation est. · year 1
- Rental income
- $37,353
- − Mortgage interest
- −$10,643
- − Property taxes
- −$2,850
- − Insurance
- −$950
- − Repairs & maintenance
- −$2,988
- − Management
- −$2,988
- − Depreciation
- −$5,527
- Taxable income
- $11,406
- Est. tax owed @ 24.0%
- −$2,737
- After-tax cash flow
- $11,015/yr
For passive investors: Depreciation is non-cash, so a rental often shows a tax loss while cash-flowing — sheltering income. Rental losses are passive: they offset passive income freely, and up to $25,000/yr can offset ordinary (W-2) income if you actively participate and your MAGI is under $100k (phasing out to $0 by $150k); unused losses carry forward. On sale, claimed depreciation is recaptured at up to 25%, and gains may owe capital-gains tax (a 1031 exchange can defer both). Figures are a year-1 estimate at your 24.0% rate — not tax advice; consult a CPA.
Schools (NCES district)
- District
- Buffalo City School District
- NCES district ID
- 3605850
- Math proficiency
- 41% ▲ 11.00%
- Reading proficiency
- 40% ▲ 7.00%
- Median HH income
- $31,665
- Composite
- 33.17/100
- National rank
- #5544
- State rank
- #535 of 590 in NY
Livability — Buffalo
- Score
- 77/100
- State rank
- #195
- US rank
- #3011
Category grades
Schools grade is shown separately in the Schools card above.
Census & demographics
- Census place
- Buffalo, NY
- County
- Erie County · 714,559 people
- City population
- 440,021
- Metro
- Buffalo-Cheektowaga, NY
- Population (ZIP)
- 21,314
- Household income
- $58,228
- Rent vs Own
- Severe rent burden
- 1820.0
Population outlook (Erie County) Hauer SSP2
- Today (2025)
- 933,037 people
- By 2030
- 935,181 · +0.2%
- By 2040
- 928,531 · -0.5%
- By 2050
- 905,725 · -2.9%
- By 2075
- 834,037 · -10.6%
- By 2100
- 708,033 · -24.1%
Race, ethnicity, and origin ACS 2023
- Neighborhood character
- Diverse neighborhood (Simpson 0.67)
- Race & ethnicity
- White 47% Black 31% Asian 11% Hispanic / Latino 7% Two or more races 6%
- Hispanic origin (detail)
- Puerto Rican 3%
- Common ancestry
- Romanian 5% Lithuanian 2% Scotch-Irish 1%
- Foreign-born
- 14% · Canada, China
- Languages at home
- 81% English-only · Other Indo-European 7% Spanish 4% Other Asian/Pacific 1%
Political lean MEDSL · Erie
- 2024 margin
- Lean D (+9.7) · D 54.8% · R 45.2%
- 2008→2024 swing
- -7.9pp toward R · 2008: 17.5pp · 2024: 9.7pp
- All cycles
- 2024: D+9.7 2020: D+14.7 2016: D+4.8 2012: D+15.6 2008: D+17.5
Not yet ingested
- Civics
- —
Market trends
- HPI YoY
- ▼ -282.52%
- Current HPI
- 373.377
- Rent YoY
- ▲ 5.81%
- Metro
- Buffalo-Cheektowaga, NY
- State GDP YoY
- ▲ 2.60%
- F500 in state
- 92
Industry mix (Fortune 500 HQ in NY)
| Industry | F500 HQs | Revenue |
|---|---|---|
| Financial Services | 10 | $950B |
|
||
| Consumer Goods | 9 | $162B |
|
||
| Insurance | 4 | $225B |
|
||
| Telecommunications | 2 | $144B |
|
||
| Pharmaceuticals | 2 | $112B |
|
||
| Media / Entertainment | 2 | $69B |
|
||
Price history
+246.1% since first listed10 events — show timeline
- 2026-04-20 Listed $189,999 WNYREIS
- 2025-10-26 Listing Removed — WNYREIS
- 2025-08-26 Listed $174,999 WNYREIS
- 2023-12-06 Listing Removed — WNYREIS
- 2023-10-03 Price Changed $169,900 WNYREIS
- 2023-09-06 Listed $179,900 WNYREIS
- 2019-06-21 Listing Removed — WNYREIS
- 2019-04-03 Listed $50,000 WNYREIS
- 2018-03-02 Listing Removed — WNYREIS
- 2018-02-20 Listed $54,900 WNYREIS
Property tax history
+6.5%/yrLatest (2025): $297 · +0.0% YoY. Source: county tax records.
Cash-flow waterfall
monthlySold comps — $/sqft
last 12 mo · ≤1 miLoading sold comps…