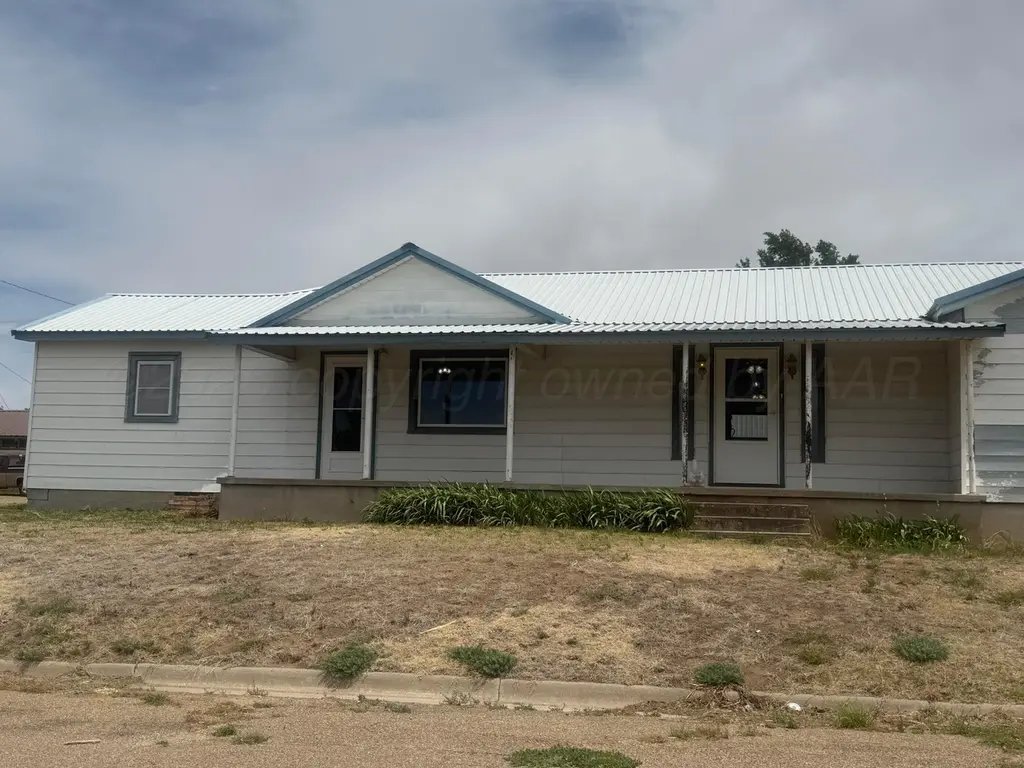
901 Lindberg St · Skellytown, TX
Flood risk 1/10 · Minimal
- FEMA flood zone
- —
- Chance of flooding over 30 yrs
- 0.0%
- Est. flood insurance / yr
- —
Fire risk 10/10 · Severe
- Est. fire insurance / yr
- $1,222 – $2,270
Heat risk 5/10 · Moderate
- Hot days now (above 99°F)
- 6 days/yr
- Hot days in 30 yrs
- 17 days/yr
Wind risk 2/10 · Minimal
- Chance of severe wind over 30 yrs
- 0.0%
Air-quality risk 2/10 · Minimal
- Unhealthy air days now
- 1 days/yr
- Unhealthy air days in 30 yrs
- 1 days/yr
Risk factors via First Street. Map © Google.
Why this score? — see what drove the D grade
The composite is a weighted blend of 9 inputs, each scored 0–100. Each bar is that input's sub-score; the figure is the points it added to the 100-point composite (weight × sub-score).
- Cash flow +13.2/30.0
- ARV discount +7.5/15.0
- Schools +4.3/10.0
- 1% rule +4.1/10.0
- DSCR +4.0/10.0
- Appreciation +3.3/10.0
- Livability +3.0/5.0
- Rent growth +2.5/5.0
- Condition / age +2.5/5.0
$154,900
🖨 Deal sheet (PDF) 📄 Offer letter ✓ Due diligence
Listing remarks
Incredible Opportunity in Skellytown! Approx 15 minutes from White Deer & Pampa, Close proximity to the Data Centers! Incredible Price for this Huge Home on large Corner Lot! This 4/3/4 Home is Huge! Huge dining room and kitchen, with updated cabinets, including a fold out pantry! Huge living room! Couple of Flex Rooms- Craft Room, Office, etc! Great home for a family to give it some TLC & make it their own, great Generational Home, especially with 2 bathrooms with walk in showers, or Perfect Investment for a rental opportunity with the 4 bedrooms & 3 bathrooms! Huge RV Garage for 2 RV's! 2 detached single car garages! Double paned windows, newer sewer line! Central heat
Key facts
- Office
- Craft room
- Updated cabinets
Tags
Property features AI
Exterior
- Parking: Detached garage; 4-car garage; Carport; Garage faces side and front; Additional parking; RV access/parking
- Utilities: Public water; Public sewer
- Home design: Single family residence; One level
- Construction: Frame construction; Pillar/Post/Pier foundation; Metal roof; Built for residential use
- Exterior features: Corner lot; Workshop
Interior
- Kitchen: Disposal; Double oven; Range; Refrigerator
- Bathrooms: 1 full bathroom; 2 three-quarter bathrooms
- Heating & cooling: Central heating (natural gas); Central air conditioning (electric); Ceiling fans
- Interior features: In-law floorplan; Pantry
- Laundry & utility: Gas water heater; Electric water heater
Neighborhood map
What this means for you Summary
Snapshot
- This is a 4-bed/1.0-bath single-family listed at $155k.
Deal economics
- At list price, monthly cash flow is $-4 ($-49/yr) — negative.
- To cash-flow at today's rent, offer at most $154k (0.5% below list).
- To meet the 1% rule (rent ≥ 1% of price), the offer needs to be $142k (8.6% below list).
- Recommended offer: $142k (8.6% below list) — sets the bar for 1% rule.
Location & tenants
- Location reads 60/100 on livability (#1,074 in TX) — a middle-class / working-renter tenant base. Strengths: cost of living A+, housing B; Watch: employment C-, crime F, amenities F.
- White Deer ISD (rural): math 45% / reading 48% proficiency, ranked #439 of 1,141 in TX (top 38%) — families likely to look elsewhere, expect single-tenant / working-renter base with shorter leases.
- Zoned schools: White Deer El (math 32% / reading 42%, grade F, #1,769 of 4,322 statewide, top 44%, 183 students, 55% FRL); White Deer H S (math 52% / reading 57%, grade C-, #379 of 1,632 statewide, top 26%, 151 students, 51% FRL).
- Market conditions: 4 active listings in the ZIP; 39 units permitted in Carson County in 2024 (0 in 5+ unit buildings).
Forward outlook
- Local home prices are declining (-3.0%/yr); year-one equity from $1k of loan paydown is wiped out by about $5k of value loss. Plan a longer hold.
- Carson County population projected at -11% by 2050 — secular population decline; favor cash flow + early exit over multi-decade hold.
Negotiation context
- It's been on market 38 days — a 3% lower offer ($150k) is reasonable based on typical stale-listing flexibility.
Risks & watch-outs
- Watch-outs: built in 1925 — expect roof / HVAC / electrical / plumbing capex.
- Climate carrying-cost: severe wildfire risk; extreme-heat days projected 6→17/yr by 2055 (HVAC capex compounding) — expect insurance premiums to compound above CPI over the hold.
Questions for the listing agent
- What do current leases actually rent for vs. the listed asking? Can we see a recent rent roll and the last 12 months of T-12 income?
- It's been on market 38 days. Have you received any prior offers? Is the seller open to a 9% concession, seller financing, or rate buy-down credit?
- Built in 1925 — when were the roof, HVAC, electrical panel, plumbing, and water heater last replaced?
- Is there a deadline driving the sale (1031 exchange, divorce, estate, relocation)? That informs how much negotiation room exists.
- Crime grade is F in this area — have there been break-ins, vandalism, or insurance claims at this property in the last 3 years? What carrier currently insures it and at what premium?
- The area grade is low — what's the realistic commute time and amenity access for the typical tenant pool here? Any planned neighborhood developments (good or bad) we should know about?
- What's the average days-on-market for RENTAL listings here right now (not sales)? A rising rental-DOM trend means longer vacancies and softer asking-rent achievability than the comps imply.
- What's the recent tenant-quality profile in this submarket — average credit score on applications, eviction rate, late-payment / NSF rate, and stable-employment percentage? A property-management company in the area should have these aggregated.
- How much new for-sale + rental construction is in the pipeline within 1–3 miles? Heavy new supply typically softens prices + rents 12–24 months out; constrained supply supports both.
Investment metrics
- 1% rule
- 0.91% ✗
- Cap rate
- 6.26%
- Cash-on-cash
- -0.11%
- DSCR
- 1.00
- GRM
- 9.1
CMA / ARV
No comps found within radius.
Projected returns pro-forma
-3.0% appreciation · 3.0% rent growth · sell at horizon
- IRR
- -16.4%
- Equity multiple
- 0.42×
- Total profit
- $-25,305
- Equity at exit
- $23,096
- IRR
- -8.1%
- Equity multiple
- 0.49×
- Total profit
- $-22,150
- Equity at exit
- $13,393
Cash invested: $43,372 (down + closing). Projections, not guarantees.
Landlord ↔ Tenant lean methodology
- Overall (STATE)
- 87 Strongly Landlord-Friendly
- State Texas
- 87 Strongly Landlord-Friendly · R+5
- County
- — inherits STATE
- City
- — inherits STATE
ZIP-level market 79080
- Home prices YoY
- -3.5%
- Active inventory
- 4
- Price-to-rent
- 9.1×
Monthly cashflow live
- Estimated rent
- $1,416 medium interval (Pro) →
- Mortgage (P&I)
- −$812
- Tax from tax record
- −$246 /mo · $2,951/yr
- Insurance
- −$65
- HOA
- −$0
- Vacancy / Maint / Mgmt
- −$297
- Net cashflow
- $-4
Break-even live
Sensitivity live
| Price | -10% $84 | -5% $40 | +0% $-4 | +5% $-48 | +10% $-92 |
|---|---|---|---|---|---|
| Rent | -10% $-116 | -5% $-60 | +0% $-4 | +5% $52 | +10% $108 |
| Rate | -1.0pp $74 | -0.5pp $35 | base $-4 | +0.5pp $-44 | +1.0pp $-85 |
UW: 25.0% down · 7.5% · 30yr · 1.5% tax · 5.0% vac · 8.0% maint · 8.0% mgmt
Financing live
Cash to close
- Down payment
- $38,725
- Closing costs
- $4,647
- Reserves months
- —
- Total cash needed
- —
Loan-product check · same deal, 3 products live
Conventional
25% down · 7.5% · 30yr
- Down + closing
- —
- Monthly P&I
- —
- Monthly cashflow
- —
- DSCR
- —
- Eligible?
- —
Personal DTI + credit; lowest rate.
DSCR
20% down · 8.5% · 30yr
- Down + closing
- —
- Monthly P&I
- —
- Monthly cashflow
- —
- DSCR
- —
- Eligible?
- —
No personal income docs; deal must DSCR.
Hard money
10% down · 12.0% · 12mo
- Down + closing
- —
- Monthly P&I
- —
- Monthly cashflow
- —
- DSCR
- —
- Eligible?
- —
Short-term bridge; refi at stabilization.
Listing history 21 events
-
2026-06-21days on market $154,900 Active 38 DOM
-
2026-06-21days on market $154,900 Active 37 DOM
-
2026-06-18price $154,900 Active 35 DOM
-
2026-06-18days on market $159,900 Active 35 DOM
-
2026-06-17days on market $159,900 Active 34 DOM
-
2026-06-16days on market $159,900 Active 33 DOM
-
2026-06-15days on market $159,900 Active 32 DOM
-
2026-06-15days on market $159,900 Active 31 DOM
-
2026-06-13days on market $159,900 Active 30 DOM
-
2026-06-12days on market $159,900 Active 29 DOM
-
2026-06-09days on market $159,900 Active 26 DOM
-
2026-06-08days on market $159,900 Active 25 DOM
-
2026-06-08days on market $159,900 Active 24 DOM
-
2026-06-06days on market $159,900 Active 23 DOM
-
2026-06-03days on market $159,900 Active 20 DOM
-
2026-06-02pricedays on market $159,900 Active 19 DOM
-
2026-06-01days on market $165,000 Active 18 DOM
-
2026-05-31days on market $165,000 Active 17 DOM
-
2026-05-14$165,000 Active 824-char remark
-
1995-08-02soldstatus
-
1992-04-24soldstatus
ⓘ Source: listings_history table (triggers on properties + properties_extension) + one-shot
backfill from property_details.listing_events for pre-trigger history.
Tax reassessment forecast TX · Resets to sale price
- Current annual tax
- $2,951 · $246/mo
- Projected year-2 tax
- $2,951 · $246/mo
- Expected delta
- $0/yr ($0/mo · 0.0%)
ⓘ Screening estimate from a state-policy table — verify with the county assessor before closing.
Climate risk First Street
- Flood 1/10 Low 0% chance over 30 yrs
- Wildfire 10/10 Extreme
- Heat 5/10 Major 6 d/yr ≥99°F today · 17 d/yr by 30 yrs out
- Wind 2/10 Low 0% chance of damaging wind over 30 yrs
- Air quality 2/10 Low 1 unhealthy d/yr today · 1 by 30 yrs out
Nearby sold comps map
Loading sold comps map…
Walkable amenities ~0.75 mi
Loading nearby amenities…
Taxation est. · year 1
- Rental income
- $16,993
- − Mortgage interest
- −$8,677
- − Property taxes
- −$2,951
- − Insurance
- −$774
- − Repairs & maintenance
- −$1,359
- − Management
- −$1,359
- − Depreciation
- −$4,506
- Taxable loss
- −$2,634
- Est. tax savings @ 24.0%
- +$632
- After-tax cash flow
- $584/yr
For passive investors: Depreciation is non-cash, so a rental often shows a tax loss while cash-flowing — sheltering income. Rental losses are passive: they offset passive income freely, and up to $25,000/yr can offset ordinary (W-2) income if you actively participate and your MAGI is under $100k (phasing out to $0 by $150k); unused losses carry forward. On sale, claimed depreciation is recaptured at up to 25%, and gains may owe capital-gains tax (a 1031 exchange can defer both). Figures are a year-1 estimate at your 24.0% rate — not tax advice; consult a CPA.
Schools (NCES district)
- District
- White Deer ISD
- NCES district ID
- 4845450
- Math proficiency
- 45% ▼ -5.00%
- Reading proficiency
- 48% ▼ -1.00%
- Median HH income
- $59,137
- Composite
- 42.91/100
- National rank
- #6705
- State rank
- #439 of 1141 in TX
Livability — Skellytown
- Score
- 60/100
- State rank
- #1074
- US rank
- #19056
Category grades
Schools grade is shown separately in the Schools card above.
Census & demographics
- Census place
- Skellytown, TX
- Population (ZIP)
- 498
Population outlook (Carson County) Hauer SSP2
- Today (2025)
- 5,631 people
- By 2030
- 5,516 · -2.0%
- By 2040
- 5,190 · -7.8%
- By 2050
- 5,007 · -11.1%
- By 2075
- 4,509 · -19.9%
- By 2100
- 3,458 · -38.6%
Race, ethnicity, and origin ACS 2023
- Neighborhood character
- Predominantly White (86%)
- Race & ethnicity
- White 86% Hispanic / Latino 5% Two or more races 5% Asian 2% Black 1%
- Hispanic origin (detail)
- Mexican 5%
- Common ancestry
- Serbian 1%
- Foreign-born
- 2% · Canada, China
- Languages at home
- 92% English-only · Spanish 7% Chinese 2%
Political lean MEDSL · Carson
- 2024 margin
- Solid R (+81.2) · D 9.1% · R 90.3%
- 2008→2024 swing
- -9.3pp toward R · 2008: -71.9pp · 2024: -81.2pp
- All cycles
- 2024: R+81.2 2020: R+79.5 2016: R+80.4 2012: R+77.8 2008: R+71.9
Not yet ingested
- Civics
- —
Market trends
- HPI YoY
- ▼ -3.44%
- Current HPI
- 95.2703
- Rent YoY
- —
- Metro
- —
- State GDP YoY
- ▲ 3.95%
- F500 in state
- 110
Industry mix (Fortune 500 HQ in TX)
| Industry | F500 HQs | Revenue |
|---|---|---|
| Energy | 16 | $1,198B |
|
||
| Technology | 5 | $198B |
|
||
| Engineering / Construction | 4 | $72B |
|
||
| Energy Services | 3 | $60B |
|
||
| Utilities | 3 | $41B |
|
||
| Healthcare | 2 | $330B |
|
||
Price history
-3.1% since first listed4 events — show timeline
- 2026-06-02 Price Changed $159,900 AARMLS
- 2026-05-14 Listed $165,000 AARMLS
- 1995-08-02 Sold (Public Records) — Public Records
- 1992-04-24 Sold (Public Records) — Public Records
Property tax history
+8.9%/yrLatest (2025): $2,951 · +47.0% YoY. Source: county tax records.
Cash-flow waterfall
monthlySold comps — $/sqft
last 12 mo · ≤1 miLoading sold comps…