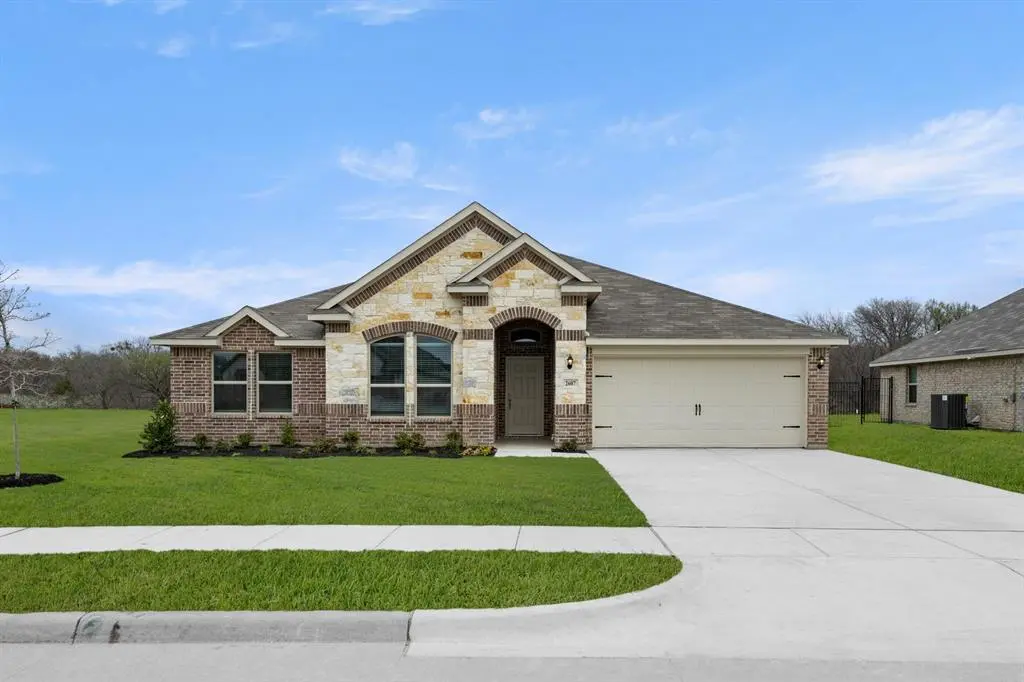
2607 Streamside Dr · Burleson, TX
Flood risk No data
- FEMA flood zone
- —
- Chance of flooding over 30 yrs
- —
- Est. flood insurance / yr
- —
Fire risk No data
- Est. fire insurance / yr
- —
Heat risk No data
- Hot days now (above threshold)
- —
- Hot days in 30 yrs
- —
Wind risk No data
- Chance of severe wind over 30 yrs
- —
Air-quality risk No data
- Unhealthy air days now
- —
- Unhealthy air days in 30 yrs
- —
Risk factors via First Street. Map © Google.
Why this score? — see what drove the F grade
The composite is a weighted blend of 9 inputs, each scored 0–100. Each bar is that input's sub-score; the figure is the points it added to the 100-point composite (weight × sub-score).
- Cash flow +11.2/30.0
- Schools +4.5/10.0
- ARV discount +4.3/15.0
- Livability +4.0/5.0
- DSCR +3.3/10.0
- Rent growth +2.9/5.0
- Condition / age +2.5/5.0
- 1% rule +2.2/10.0
- Appreciation +0.0/10.0
$409,999
🖨 Deal sheet 📄 Offer letter ✓ Due diligence
Listing remarks MLS
MLS# 21186432 - Built by Impression Homes - Ready Now! ~ Discover this stunning single-family residence in the desirable Mountain Valley subdivision, featuring 4 spacious bedrooms and 2 full bathrooms within 2,222 square feet of thoughtfully designed living space. Completed in 2025, this traditional home showcases an open floorplan that seamlessly connects the living and dining areas, ideal for both everyday living and entertaining. Retreat to the luxurious primary bedrooms, each providing ample walk-in closet space. Enjoy comfort year-round with central heating and air conditioning. Outdoor living is made enjoyable with a covered patio, perfect for relaxation. The property includes a two-car garage and features durable tile and carpet flooring throughout. Located within Joshua ISD, this home is situated near top-rated schools. Experience modern living in a prime location.
Key facts
- Joshua isd
- Open floorplan
- Covered patio
Tags
Neighborhood map
What this means for you Summary
Snapshot
- This is a 4-bed/2.0-bath land listed at $410k.
Deal economics
- At list price, monthly cash flow is $-155 ($-2k/yr) — negative.
- To cash-flow at today's rent, offer at most $383k (6.7% below list).
- To meet the 1% rule (rent ≥ 1% of price), the offer needs to be $297k (27.6% below list).
- Recommended offer: $297k (27.6% below list) — sets the bar for 1% rule.
- Cap rate 5.8% vs local median 3.5% in Burleson — top-decile yield for the area; either an underpriced asset or a hidden risk that comps aren't pricing in. Stress-test before assuming the spread holds.
Location & tenants
- Location reads 79/100 on livability (#53 in TX, #2,133 nationally) — a middle-class / working-renter tenant base. Strengths: employment A+, cost of living A+, housing A+; Watch: amenities F, commute F.
- Joshua ISD (rural): math 52% / reading 50% proficiency, ranked #139 of 826 in TX (top 17%) — acceptable for families but not a draw, mixed tenant base, ~2y average lease.
- Market conditions: Rents rising (+1.8%/yr); 679 active listings in the ZIP; 4 comparable units currently listed for rent nearby; rentals lingering (median 44d on market — plan ~5-8 weeks vacancy on turnover, expect pricing pressure); 50% of comp listings sitting > 30 days — soft ceiling on asking rent; solid renter incomes; 2,152 units permitted in Johnson County in 2024 (76 in 5+ unit buildings).
- This rent runs 35% of the median local income ($101k/yr) — at the standard rent-burdened threshold; future hikes will face affordability resistance.
Forward outlook
- Local home prices are declining (-3.0%/yr); year-one equity from $3k of loan paydown is wiped out by about $12k of value loss. Plan a longer hold.
- Johnson County population projected at +24% by 2050 — long-run rental-demand tailwind backs the buy-and-hold thesis.
Negotiation context
- It's been on market 110 days — a 9% lower offer ($373k) is reasonable based on typical stale-listing flexibility.
- 2 sale attempts with the ask held roughly flat each time — persistent listings suggest the price (not the market) is what's stuck; bring a comps-based counter.
Questions for the listing agent
- What do current leases actually rent for vs. the listed asking? Can we see a recent rent roll and the last 12 months of T-12 income?
- It's been on market 110 days. Have you received any prior offers? Is the seller open to a 28% concession, seller financing, or rate buy-down credit?
- What does the HOA fee cover, when was the last increase, and are there any pending special assessments or reserve-fund shortfalls?
- Why hasn't it sold? Are there any deal-killer items the seller is aware of (foundation, flood, title, zoning, code violations)?
- Is there a deadline driving the sale (1031 exchange, divorce, estate, relocation)? That informs how much negotiation room exists.
- The area grade is low — what's the realistic commute time and amenity access for the typical tenant pool here? Any planned neighborhood developments (good or bad) we should know about?
- What's the average days-on-market for RENTAL listings here right now (not sales)? A rising rental-DOM trend means longer vacancies and softer asking-rent achievability than the comps imply.
- What's the recent tenant-quality profile in this submarket — average credit score on applications, eviction rate, late-payment / NSF rate, and stable-employment percentage? A property-management company in the area should have these aggregated.
- How much new for-sale + rental construction is in the pipeline within 1–3 miles? Heavy new supply typically softens prices + rents 12–24 months out; constrained supply supports both.
Investment metrics
- 1% rule
- 0.72% ✗
- Cap rate
- 5.84%
- Cash-on-cash
- -1.62%
- DSCR
- 0.93
- GRM
- 11.5
CMA / ARV
- ARV (median comp)
- $382,802
- List price
- $409,999
- Delta
- 7.10%
- Verdict
- FAIR
- Comps
- 20 within 1.0 mi
Projected returns pro-forma
-3.0% appreciation · 1.78% rent growth · sell at horizon
- IRR
- -20.2%
- Equity multiple
- 0.30×
- Total profit
- $-80,088
- Equity at exit
- $61,132
- IRR
- -15.9%
- Equity multiple
- 0.15×
- Total profit
- $-97,541
- Equity at exit
- $35,449
Cash invested: $114,800 (down + closing). Projections, not guarantees.
Landlord ↔ Tenant lean methodology
- Overall (STATE)
- 87 Strongly Landlord-Friendly
- State Texas
- 87 Strongly Landlord-Friendly · R+5
- County
- — inherits STATE
- City
- — inherits STATE
ZIP-level market 76028
- Home prices YoY
- -33.4%
- Rents YoY
- 1.8%
- Active inventory
- 679
- Price-to-rent
- 11.5×
Monthly cashflow live
- Estimated rent
- $2,970 medium interval (Pro) →
- Mortgage (P&I)
- −$2,150
- Tax from tax record
- −$91 /mo · $1,088/yr
- Insurance
- −$171
- HOA
- −$90
- Vacancy / Maint / Mgmt
- −$624
- Net cashflow
- $-155
Break-even live
UW: 25.0% down · 7.5% · 30yr · 1.5% tax · 5.0% vac · 8.0% maint · 8.0% mgmt
Financing live
Cash to close
- Down payment
- $102,500
- Closing costs
- $12,300
- Reserves months
- —
- Total cash needed
- —
Loan-product check · same deal, 3 products live
Conventional
25% down · 7.5% · 30yr
- Down + closing
- —
- Monthly P&I
- —
- Monthly cashflow
- —
- DSCR
- —
- Eligible?
- —
Personal DTI + credit; lowest rate.
DSCR
20% down · 8.5% · 30yr
- Down + closing
- —
- Monthly P&I
- —
- Monthly cashflow
- —
- DSCR
- —
- Eligible?
- —
No personal income docs; deal must DSCR.
Hard money
10% down · 12.0% · 12mo
- Down + closing
- —
- Monthly P&I
- —
- Monthly cashflow
- —
- DSCR
- —
- Eligible?
- —
Short-term bridge; refi at stabilization.
Rent comps 4 comps
| Address | Beds | Baths | Sqft | Rent | $/sqft | DOM | Units | Dist |
|---|---|---|---|---|---|---|---|---|
| 2752 Elmwood Dr Burleson, TX | 4.0 | 2.0 | 2032 | $2,800 | $1.38 | 43d | 1 | 1.33mi |
| 2513 Buffalo Run Burleson, TX | 3.0 | 2.0 | 1429 | $1,920 | $1.34 | 43d | 1 | 1.35mi |
| 2516 Castle Pines Dr Unit 1287532P Burleson, TX | 5.0 | 3.0 | 2507 | $16,227 | $6.47 | 21d | 1 | 1.43mi |
| 2516 Castle Pines Dr Burleson, TX | 5.0 | 3.0 | 2518 | $8,950 | $3.55 | 24d | 1 | 1.43mi |
HOA detail
- Monthly dues
- $90 · $1,080/yr
Listing history 13 events
-
2026-06-13statusdays on market $409,999 Pending 110 DOM
-
2026-06-09days on market $409,999 Active 109 DOM
-
2026-06-08days on market $409,999 Active 108 DOM
-
2026-06-07days on market $409,999 Active 107 DOM
-
2026-06-04days on market $409,999 Active 104 DOM
-
2026-06-03days on market $409,999 Active 103 DOM
-
2026-06-02days on market $409,999 Active 102 DOM
-
2026-06-01days on market $409,999 Active 101 DOM
-
2026-05-31days on market $409,999 Active 100 DOM
-
2026-04-02price $409,999 886-char remark
Show marketing remark (224 chars)
Open concept design with gorgeous kitchen featuring a rectangular island, tons of cabinets and ample counter space. Big walk-in pantry with tons of storage room. Large FLEX with storage closet, perfect for working from home.
-
2026-04-02price $409,999 224-char remark
Show marketing remark (224 chars)
Open concept design with gorgeous kitchen featuring a rectangular island, tons of cabinets and ample counter space. Big walk-in pantry with tons of storage room. Large FLEX with storage closet, perfect for working from home.
-
2026-02-20$424,738 Active 886-char remark
Show marketing remark (886 chars)
MLS# 21186432 - Built by Impression Homes - Ready Now! ~ Discover this stunning single-family residence in the desirable Mountain Valley subdivision, featuring 4 spacious bedrooms and 2 full bathrooms within 2,222 square feet of thoughtfully designed living space. Completed in 2025, this traditional home showcases an open floorplan that seamlessly connects the living and dining areas, ideal for both everyday living and entertaining. Retreat to the luxurious primary bedrooms, each providing ample walk-in closet space. Enjoy comfort year-round with central heating and air conditioning. Outdoor living is made enjoyable with a covered patio, perfect for relaxation. The property includes a two-car garage and features durable tile and carpet flooring throughout. Located within Joshua ISD, this home is situated near top-rated schools. Experience modern living in a prime location.
-
2025-09-17$424,738 Active 224-char remark
Show marketing remark (224 chars)
Open concept design with gorgeous kitchen featuring a rectangular island, tons of cabinets and ample counter space. Big walk-in pantry with tons of storage room. Large FLEX with storage closet, perfect for working from home.
ⓘ Source: listings_history table (triggers on properties + properties_extension) + one-shot
backfill from property_details.listing_events for pre-trigger history.
Tax reassessment forecast TX · Resets to sale price
- Current annual tax
- $1,088 · $91/mo
- Projected year-2 tax
- $7,503 · $625/mo
- Expected delta
- +$6,415/yr (+$535/mo · 589.4%)
ⓘ Screening estimate from a state-policy table — verify with the county assessor before closing.
Nearby sold comps map
Loading sold comps map…
Walkable amenities ~0.75 mi
Loading nearby amenities…
Taxation est. · year 1
- Rental income
- $35,641
- − Mortgage interest
- −$22,966
- − Property taxes
- −$1,088
- − Insurance
- −$2,050
- − Repairs & maintenance
- −$2,851
- − Management
- −$2,851
- − HOA
- −$1,080
- − Depreciation
- −$11,927
- Taxable loss
- −$9,174
- Est. tax savings @ 24.0%
- +$2,202
- After-tax cash flow
- $339/yr
For passive investors: Depreciation is non-cash, so a rental often shows a tax loss while cash-flowing — sheltering income. Rental losses are passive: they offset passive income freely, and up to $25,000/yr can offset ordinary (W-2) income if you actively participate and your MAGI is under $100k (phasing out to $0 by $150k); unused losses carry forward. On sale, claimed depreciation is recaptured at up to 25%, and gains may owe capital-gains tax (a 1031 exchange can defer both). Figures are a year-1 estimate at your 24.0% rate — not tax advice; consult a CPA.
Schools (NCES district)
- District
- Joshua ISD
- NCES district ID
- 4824930
- Math proficiency
- 52% ▼ -7.00%
- Reading proficiency
- 50% ▼ -1.00%
- Median HH income
- $60,696
- Composite
- 44.65/100
- National rank
- #2769
- State rank
- #139 of 826 in TX
Livability — Burleson
- Score
- 79/100
- State rank
- #53
- US rank
- #2133
Category grades
Schools grade is shown separately in the Schools card above.
Census & demographics
- Census place
- Burleson, TX
- County
- Johnson County · 147,987 people
- City population
- 81,549
- Metro
- Dallas-Fort Worth-Arlington, TX
- Population (ZIP)
- 81,549
- Household income
- $101,138
- Rent vs Own
- Severe rent burden
- 1117.0
Population outlook (Johnson County) Hauer SSP2
- Today (2025)
- 179,678 people
- By 2030
- 189,208 · +5.3%
- By 2040
- 207,261 · +15.4%
- By 2050
- 223,064 · +24.1%
- By 2075
- 259,979 · +44.7%
- By 2100
- 275,395 · +53.3%
Race, ethnicity, and origin ACS 2023
- Neighborhood character
- Predominantly White (69%)
- Race & ethnicity
- White 69% Hispanic / Latino 19% Two or more races 11% Black 6% Asian 1%
- Hispanic origin (detail)
- Mexican 17%
- Common ancestry
- Lithuanian 2% Italian 2% Slovak 2%
- Foreign-born
- 5% · Canada
- Languages at home
- 88% English-only · Spanish 10% Other Indo-European 1%
Political lean MEDSL · Johnson
- 2024 margin
- Solid R (+51.4) · D 23.9% · R 75.3%
- 2008→2024 swing
- -3.9pp toward R · 2008: -47.5pp · 2024: -51.4pp
- All cycles
- 2024: R+51.4 2020: R+53.0 2016: R+58.3 2012: R+55.6 2008: R+47.5
Not yet ingested
- Civics
- —
Market trends
- HPI YoY
- ▼ -141.44%
- Current HPI
- 282.466
- Rent YoY
- ▲ 1.78%
- Metro
- Dallas-Fort Worth-Arlington, TX
- State GDP YoY
- ▲ 3.95%
- F500 in state
- 110
Industry mix (Fortune 500 HQ in TX)
| Industry | F500 HQs | Revenue |
|---|---|---|
| Energy | 16 | $1,198B |
|
||
| Technology | 5 | $198B |
|
||
| Engineering / Construction | 4 | $72B |
|
||
| Energy Services | 3 | $60B |
|
||
| Utilities | 3 | $41B |
|
||
| Healthcare | 2 | $330B |
|
||
Price history
-3.5% since first listed4 events — show timeline
- 2026-04-02 Price Changed $409,999 NTREIS
- 2026-04-02 Price Changed $409,999 Zillow
- 2026-02-20 Listed $424,738 NTREIS
- 2025-09-17 Listed $424,738 Zillow
Property tax history
+6.0%/yrLatest (2025): $1,088 · +2.9% YoY. Source: county tax records.
Cash-flow waterfall
monthlySold comps — $/sqft
last 12 mo · ≤1 miLoading sold comps…