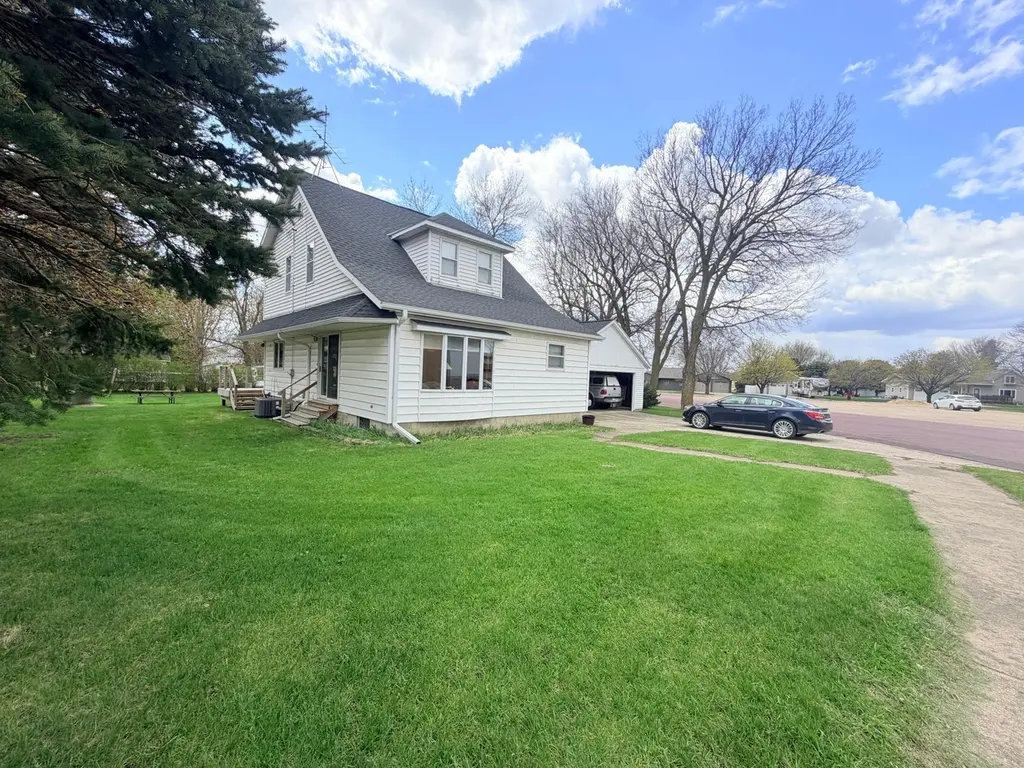
451 Paul Ave · Lake Wilson, MN
Flood risk 1/10 · Minimal
- FEMA flood zone
- —
- Chance of flooding over 30 yrs
- 0.0%
- Est. flood insurance / yr
- —
Fire risk 1/10 · Minimal
- Est. fire insurance / yr
- $888 – $1,650
Heat risk 2/10 · Minimal
- Hot days now (above 98°F)
- 7 days/yr
- Hot days in 30 yrs
- 15 days/yr
Wind risk 2/10 · Minimal
- Chance of severe wind over 30 yrs
- —
Air-quality risk 2/10 · Minimal
- Unhealthy air days now
- 1 days/yr
- Unhealthy air days in 30 yrs
- 1 days/yr
Risk factors via First Street. Map © Google.
Why this score? — see what drove the D grade
The composite is a weighted blend of 9 inputs, each scored 0–100. Each bar is that input's sub-score; the figure is the points it added to the 100-point composite (weight × sub-score).
- Cash flow +12.3/30.0
- ARV discount +7.5/15.0
- Schools +5.5/10.0
- Appreciation +5.0/10.0
- DSCR +3.6/10.0
- Livability +3.2/5.0
- Rent growth +2.5/5.0
- Condition / age +2.5/5.0
- 1% rule +2.4/10.0
$198,000
🖨 Deal sheet (PDF) 📄 Offer letter ✓ Due diligence
Listing remarks
Discover this one-of-a-kind gem featuring breathtaking original woodwork and all the "big" updates already done. This home perfectly balances historic soul with modern peace of mind. The Highlights: Main Floor Living: A convenient main-floor bedroom sits alongside an expansive living room and formal dining area—perfect for hosting. Spacious Upstairs: Four additional bedrooms feature raised ceilings and a second full bath, offering plenty of room for family or a home office. The Crown Jewel: Step outside to the largest yard in town! This massive outdoor oasis is a rare find and provides endless possibilities for gardening, play, or entertaining. Don't miss out on this unique
Key facts
- 0.76 acre lot
- 2 garage spots
- Built 1915
Property features AI
Finance
- Other: Not a fractional ownership
Exterior
- Parking: Attached garage; 2-car garage (dimensions approx. 26 x 30)
- Utilities: City water connected and well; City sewer connected; Propane fuel
- Home design: Residential property; Two levels; Main floor primary bedroom; Above-grade finished area reported (2,440 sq ft); Below-grade area noted
- Construction: Combination block and frame construction; Block and poured concrete foundation; Roof age 8 years or less; Foundation area and dimensions noted
- Exterior features: Deck; Rear porch; Vinyl siding; Barn(s) on the property; Lot approximately 0.765 acres (245 x 155 irregular); City street frontage with public road maintenance
Interior
- Kitchen: Dishwasher; Microwave; Kitchen window
- Bedrooms: 5 bedrooms total; Main level: one bedroom (primary) and one additional bedroom; Upper level: four bedrooms (listed as Bedrooms 2–5)
- Flooring: Hardwood floors
- Bathrooms: 2 full bathrooms (one on main floor, one on upper level)
- Heating & cooling: Forced air heating; Central air conditioning
- Interior features: Vaulted ceilings; Hardwood floors; Kitchen window; Living/dining room configuration; Main floor primary bedroom; Walk-in closet; 4 bedrooms on one level; Main floor laundry
- Laundry & utility: Dryer; Main floor laundry
Neighborhood map
What this means for you Summary
Snapshot
- This is a 5-bed/2.0-bath single-family listed at $198k.
Deal economics
- At list price, monthly cash flow is $-37 ($-443/yr) — negative.
- To cash-flow at today's rent, offer at most $191k (3.3% below list).
- To meet the 1% rule (rent ≥ 1% of price), the offer needs to be $147k (25.6% below list).
- Recommended offer: $147k (25.6% below list) — sets the bar for 1% rule.
Location & tenants
- Location reads 64/100 on livability (#618 in MN) — a middle-class / working-renter tenant base. Strengths: cost of living A+, housing A+; Watch: crime D+, health & safety D+, amenities F.
- Murray County Central School District (rural): math 68% / reading 60% proficiency, ranked #28 of 301 in MN (top 9%) — acceptable for families but not a draw, mixed tenant base, ~2y average lease.
- Zoned schools: Murray Co. Central Elementary (math 76% / reading 57%, grade B+, #113 of 857 statewide, top 14%, 386 students, 43% FRL); Murray County Central Secondary (math 57% / reading 62%, grade C+, #46 of 471 statewide, top 11%, 335 students, 35% FRL) — zoned schools average 39% FRL vs 22% district-wide (17 pts higher); higher-poverty schools than district average — tighter screening recommended.
- Market conditions: 9 active listings in the ZIP; 21 units permitted in Murray County in 2024 (0 in 5+ unit buildings).
Forward outlook
- In year one you build about $7k of equity ($1k loan paydown + $6k appreciation (3.0% local appreciation)).
- Murray County population projected at -14% by 2050 — secular population decline; favor cash flow + early exit over multi-decade hold.
- At projected returns (3.0% appreciation + 3.0% rent growth), your $55k cash investment doubles in ~7 years — after that, you're playing with house money.
- By year 5, paydown + projected appreciation supports a ~$32k cash-out refi (75% LTV) — recoverable capital for the next deal without selling this one.
Negotiation context
- It's been on market 46 days — a 3% lower offer ($192k) is reasonable based on typical stale-listing flexibility.
Risks & watch-outs
- Watch-outs: built in 1915 — expect roof / HVAC / electrical / plumbing capex.
Questions for the listing agent
- What do current leases actually rent for vs. the listed asking? Can we see a recent rent roll and the last 12 months of T-12 income?
- It's been on market 46 days. Have you received any prior offers? Is the seller open to a 26% concession, seller financing, or rate buy-down credit?
- Built in 1915 — when were the roof, HVAC, electrical panel, plumbing, and water heater last replaced?
- Is there a deadline driving the sale (1031 exchange, divorce, estate, relocation)? That informs how much negotiation room exists.
- Schools are D-rated, which usually means shorter tenancies and higher turnover. Who's the typical renter profile here, and what's been the actual vacancy rate?
- Crime grade is D in this area — have there been break-ins, vandalism, or insurance claims at this property in the last 3 years? What carrier currently insures it and at what premium?
- The area grade is low — what's the realistic commute time and amenity access for the typical tenant pool here? Any planned neighborhood developments (good or bad) we should know about?
- What's the average days-on-market for RENTAL listings here right now (not sales)? A rising rental-DOM trend means longer vacancies and softer asking-rent achievability than the comps imply.
- What's the recent tenant-quality profile in this submarket — average credit score on applications, eviction rate, late-payment / NSF rate, and stable-employment percentage? A property-management company in the area should have these aggregated.
- How much new for-sale + rental construction is in the pipeline within 1–3 miles? Heavy new supply typically softens prices + rents 12–24 months out; constrained supply supports both.
Investment metrics
- 1% rule
- 0.74% ✗
- Cap rate
- 6.07%
- Cash-on-cash
- -0.80%
- DSCR
- 0.96
- GRM
- 11.2
CMA / ARV
No comps found within radius.
Projected returns pro-forma
3.0% appreciation · 3.0% rent growth · sell at horizon
- IRR
- 6.7%
- Equity multiple
- 1.39×
- Total profit
- $21,421
- Equity at exit
- $89,029
- IRR
- 9.5%
- Equity multiple
- 2.43×
- Total profit
- $79,469
- Equity at exit
- $137,205
Cash invested: $55,440 (down + closing). Projections, not guarantees.
Landlord ↔ Tenant lean methodology
- Overall (STATE)
- 46 Balanced
- State Minnesota
- 46 Balanced · D+2
- County
- — inherits STATE
- City
- — inherits STATE
ZIP-level market 56151
- Active inventory
- 9
- Price-to-rent
- 11.2×
Monthly cashflow live
- Estimated rent
- $1,472 medium interval (Pro) →
- Mortgage (P&I)
- −$1,038
- Tax from tax record
- −$79 /mo · $950/yr
- Insurance
- −$82
- HOA
- −$0
- Vacancy / Maint / Mgmt
- −$309
- Net cashflow
- $-37
Break-even live
Sensitivity live
| Price | -10% $75 | -5% $19 | +0% $-37 | +5% $-93 | +10% $-149 |
|---|---|---|---|---|---|
| Rent | -10% $-153 | -5% $-95 | +0% $-37 | +5% $21 | +10% $79 |
| Rate | -1.0pp $63 | -0.5pp $13 | base $-37 | +0.5pp $-88 | +1.0pp $-140 |
UW: 25.0% down · 7.5% · 30yr · 1.5% tax · 5.0% vac · 8.0% maint · 8.0% mgmt
Financing live
Cash to close
- Down payment
- $49,500
- Closing costs
- $5,940
- Reserves months
- —
- Total cash needed
- —
Loan-product check · same deal, 3 products live
Conventional
25% down · 7.5% · 30yr
- Down + closing
- —
- Monthly P&I
- —
- Monthly cashflow
- —
- DSCR
- —
- Eligible?
- —
Personal DTI + credit; lowest rate.
DSCR
20% down · 8.5% · 30yr
- Down + closing
- —
- Monthly P&I
- —
- Monthly cashflow
- —
- DSCR
- —
- Eligible?
- —
No personal income docs; deal must DSCR.
Hard money
10% down · 12.0% · 12mo
- Down + closing
- —
- Monthly P&I
- —
- Monthly cashflow
- —
- DSCR
- —
- Eligible?
- —
Short-term bridge; refi at stabilization.
Listing history 20 events
-
2026-06-22days on market $198,000 Active 46 DOM
-
2026-06-21days on market $198,000 Active 45 DOM
-
2026-06-21days on market $198,000 Active 44 DOM
-
2026-06-18days on market $198,000 Active 42 DOM
-
2026-06-17days on market $198,000 Active 41 DOM
-
2026-06-16days on market $198,000 Active 40 DOM
-
2026-06-15days on market $198,000 Active 39 DOM
-
2026-06-13days on market $198,000 Active 37 DOM
-
2026-06-12days on market $198,000 Active 36 DOM
-
2026-06-09days on market $198,000 Active 33 DOM
-
2026-06-08days on market $198,000 Active 32 DOM
-
2026-06-07days on market $198,000 Active 31 DOM
-
2026-06-07days on market $198,000 Active 30 DOM
-
2026-06-04days on market $198,000 Active 27 DOM
-
2026-06-02days on market $198,000 Active 26 DOM
-
2026-06-01days on market $198,000 Active 25 DOM
-
2026-05-31days on market $198,000 Active 24 DOM
-
2026-05-31days on market $198,000 Active 23 DOM
-
2026-05-08$198,000 Active 759-char remark
-
2026-05-06historical $198,000 759-char remark
ⓘ Source: listings_history table (triggers on properties + properties_extension) + one-shot
backfill from property_details.listing_events for pre-trigger history.
Tax reassessment forecast MN · Partial reset (capped growth)
- Current annual tax
- $950 · $79/mo
- Projected year-2 tax
- $1,584 · $132/mo
- Expected delta
- +$634/yr (+$53/mo · 66.7%)
ⓘ Screening estimate from a state-policy table — verify with the county assessor before closing.
Climate risk First Street
- Flood 1/10 Low 0% chance over 30 yrs
- Wildfire 1/10 Low
- Heat 2/10 Low 7 d/yr ≥98°F today · 15 d/yr by 30 yrs out
- Wind 2/10 Low
- Air quality 2/10 Low 1 unhealthy d/yr today · 1 by 30 yrs out
Nearby sold comps map
Loading sold comps map…
Walkable amenities ~0.75 mi
Loading nearby amenities…
Taxation est. · year 1
- Rental income
- $17,667
- − Mortgage interest
- −$11,091
- − Property taxes
- −$950
- − Insurance
- −$990
- − Repairs & maintenance
- −$1,413
- − Management
- −$1,413
- − Depreciation
- −$5,760
- Taxable loss
- −$3,950
- Est. tax savings @ 24.0%
- +$948
- After-tax cash flow
- $505/yr
For passive investors: Depreciation is non-cash, so a rental often shows a tax loss while cash-flowing — sheltering income. Rental losses are passive: they offset passive income freely, and up to $25,000/yr can offset ordinary (W-2) income if you actively participate and your MAGI is under $100k (phasing out to $0 by $150k); unused losses carry forward. On sale, claimed depreciation is recaptured at up to 25%, and gains may owe capital-gains tax (a 1031 exchange can defer both). Figures are a year-1 estimate at your 24.0% rate — not tax advice; consult a CPA.
Schools (NCES district)
- District
- Murray County Central School District
- NCES district ID
- 2700090
- Math proficiency
- 68% ▲ 8.00%
- Reading proficiency
- 60% ▼ -6.00%
- Median HH income
- $50,848
- Composite
- 54.52/100
- National rank
- #1344
- State rank
- #28 of 301 in MN
Livability — Lake Wilson
- Score
- 64/100
- State rank
- #618
- US rank
- #14689
Category grades
Schools grade is shown separately in the Schools card above.
Census & demographics
- Census place
- Lake Wilson, MN
- Population (ZIP)
- 681
Population outlook (Murray County) Hauer SSP2
- Today (2025)
- 7,978 people
- By 2030
- 7,715 · -3.3%
- By 2040
- 7,213 · -9.6%
- By 2050
- 6,820 · -14.5%
- By 2075
- 6,371 · -20.1%
- By 2100
- 5,729 · -28.2%
Race, ethnicity, and origin ACS 2023
- Neighborhood character
- Predominantly White (94%)
- Race & ethnicity
- White 94% Two or more races 5% Hispanic / Latino 2%
- Common ancestry
- Iranian 25% Portuguese 14% Scotch-Irish 1%
- Foreign-born
- 2% · Canada
- Languages at home
- 97% English-only · Spanish 2% German/W. Germanic 1%
Political lean MEDSL · Murray
- 2024 margin
- Solid R (+42.4) · D 27.9% · R 70.4% · Other 1.7%
- 2008→2024 swing
- -42.9pp toward R · 2008: 0.5pp · 2024: -42.4pp
- All cycles
- 2024: R+42.4 2020: R+39.1 2016: R+36.2 2012: R+7.2 2008: D+0.5
Not yet ingested
- Civics
- —
Market trends
- HPI YoY
- —
- Current HPI
- —
- Rent YoY
- —
- Metro
- —
- State GDP YoY
- ▲ 2.41%
- F500 in state
- 34
Industry mix (Fortune 500 HQ in MN)
| Industry | F500 HQs | Revenue |
|---|---|---|
| Healthcare | 2 | $407B |
|
||
| Retail | 2 | $150B |
|
||
| Consumer Goods | 2 | $32B |
|
||
| Industrial Machinery | 2 | $6B |
|
||
| Agriculture | 1 | $40B |
|
||
| Healthcare / Medical Devices | 1 | $32B |
|
||
Price history
+0.0% since first listed2 events — show timeline
- 2026-05-08 Listed $198,000 NORTHSTARMLS as Distributed by MLS Grid
- 2026-05-06 Coming Soon $198,000 NORTHSTARMLS as Distributed by MLS Grid
Property tax history
+11.1%/yrLatest (2026): $950 · +14.2% YoY. Source: county tax records.
Cash-flow waterfall
monthlySold comps — $/sqft
last 12 mo · ≤1 miLoading sold comps…