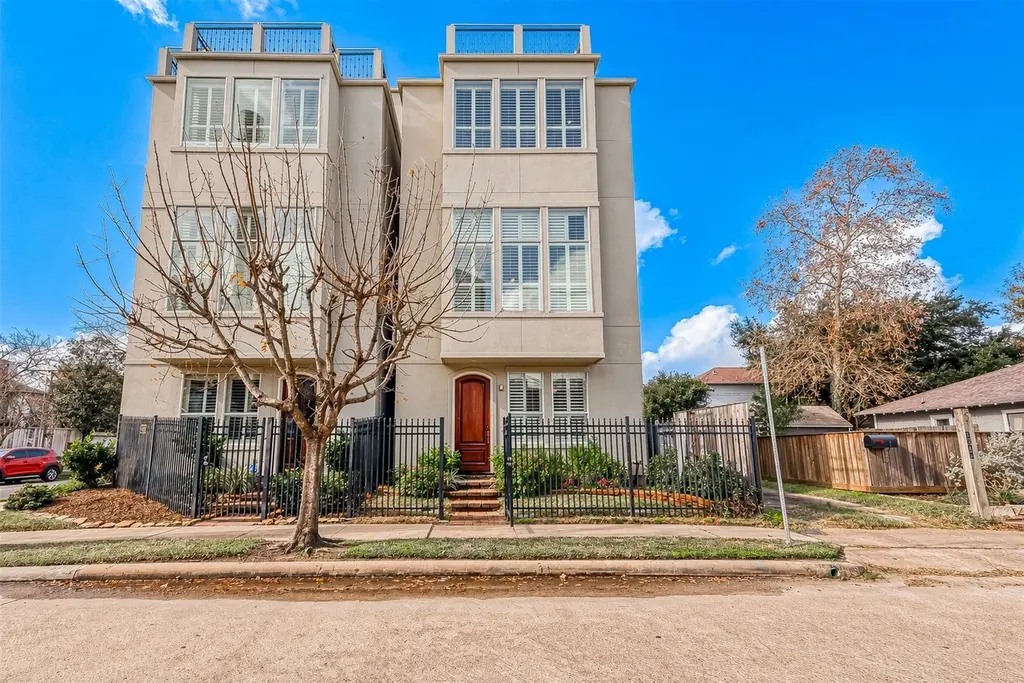
1804 Haddon St · Houston, TX
Flood risk 4/10 · Minor
- FEMA flood zone
- X (unshaded)
- Chance of flooding over 30 yrs
- 0.22%
- Est. flood insurance / yr
- $507 – $1,088
Fire risk 1/10 · Minimal
- Est. fire insurance / yr
- $1,222 – $2,270
Heat risk 9/10 · Severe
- Hot days now (above 109°F)
- 7 days/yr
- Hot days in 30 yrs
- 24 days/yr
Wind risk 9/10 · Severe
- Chance of severe wind over 30 yrs
- 99.0%
Air-quality risk 3/10 · Minor
- Unhealthy air days now
- 2 days/yr
- Unhealthy air days in 30 yrs
- 3 days/yr
Risk factors via First Street. Map © Google.
Why this score? — see what drove the C grade
The composite is a weighted blend of 9 inputs, each scored 0–100. Each bar is that input's sub-score; the figure is the points it added to the 100-point composite (weight × sub-score).
- Cash flow +19.3/30.0
- ARV discount +13.6/15.0
- DSCR +6.1/10.0
- 1% rule +5.5/10.0
- Livability +3.7/5.0
- Schools +2.7/10.0
- Condition / age +2.5/5.0
- Rent growth +2.3/5.0
- Appreciation +0.0/10.0
$599,900
🖨 Deal sheet 📄 Offer letter ✓ Due diligence
Listing remarks
Located in the sought-after River Oaks Shopping Area, this stunning 3-bedroom, 3.5-bath home combines style, function, and convenience. With a first-floor bedroom/study, an open-concept second level perfect for entertaining, and a private third-floor primary suite, the layout is both practical and inviting. Take in incredible downtown views from the rooftop terrace, and enjoy the flexibility of an additional bonus room. High ceilings, plantation shutters, crown molding, and a charming private front yard add to the appeal. A two-car garage with new epoxy flooring, and semi-private driveway complete the package—plus, no HOA. A rare opportunity for effortless, lock-and-leave living. All
Key facts
- 1,542 sq ft lot
- 2 garage spots
- Built 2006
Neighborhood map
What this means for you Summary
Snapshot
- This is a 3-bed/3.5-bath single-family listed at $600k.
Deal economics
- At list price, monthly cash flow is $662 ($8k/yr) — positive.
- The deal already cash-flows at list — no discount required.
- Meets the 1% rule at list price ($6k rent vs $600k).
- Cap rate 7.6% vs local median 3.2% in Houston — top-decile yield for the area; either an underpriced asset or a hidden risk that comps aren't pricing in. Stress-test before assuming the spread holds.
Location & tenants
- Location reads 74/100 on livability (#184 in TX, #4,771 nationally) — a middle-class / working-renter tenant base. Strengths: amenities A+, cost of living A+, housing A+; Watch: crime F.
- Houston ISD (urban): math 27% / reading 35% proficiency, ranked #593 of 826 in TX (top 72%) — families likely to look elsewhere, expect single-tenant / working-renter base with shorter leases; 71% free/reduced lunch — lower-income household profile, screen leases tightly.
- Zoned schools: Ella J Baker Montessori School (math 32% / reading 47%, grade F, #1,545 of 4,322 statewide, top 38%, 607 students, 37% FRL); Lanier Middle (math 73% / reading 82%, grade A+, #27 of 1,662 statewide, top 2%, 1,434 students, 29% FRL); Lamar H S (math 38% / reading 65%, grade D+, #478 of 1,632 statewide, top 29%, 3,125 students, 49% FRL) — zoned schools average 38% FRL vs 71% district-wide (33 pts lower); this property's tenant base skews higher-income than the district average.
- Zoned-school proficiency averages 56% at this address vs 31% district-wide (+25 pts) — the actual schools serving this property are materially stronger than the Houston ISD average implies; a family-tenant draw the district grade alone would hide.
- Market conditions: Rents soft (-0.9%/yr); 256 active listings in the ZIP; 40 comparable units currently listed for rent nearby; rentals at typical pace (median 24d on market — plan ~3-4 weeks tenant-placement turnaround); 40% of comp listings sitting > 30 days — soft ceiling on asking rent; high-income renter base; 29,883 units permitted in Harris County in 2024 (8,621 in 5+ unit buildings).
- At $6,314/mo this rent would consume 65% of the median local household income ($116k/yr) (locally 1844% of renters already pay >50% of income on rent) — very limited rent-growth headroom before tenants either downsize or default.
Forward outlook
- Local home prices are declining (-3.0%/yr); year-one equity from $4k of loan paydown is wiped out by about $18k of value loss. Plan a longer hold.
- Harris County population projected at +47% by 2050 — long-run rental-demand tailwind backs the buy-and-hold thesis.
Negotiation context
- Only 1 days on market — expect competitive offers; lowballing is unlikely to land.
- 9 sale attempts since 4y ago; this cycle's ask is 14898% above the opening price — seller raised mid-cycle; expect resistance to lowballs.
Risks & watch-outs
- Climate carrying-cost: severe wind risk, 99% chance of damaging wind over 30y; extreme-heat days projected 7→24/yr by 2055 (HVAC capex compounding) — expect insurance premiums to compound above CPI over the hold.
Questions for the listing agent
- Is there a deadline driving the sale (1031 exchange, divorce, estate, relocation)? That informs how much negotiation room exists.
- Schools are D-rated, which usually means shorter tenancies and higher turnover. Who's the typical renter profile here, and what's been the actual vacancy rate?
- Crime grade is F in this area — have there been break-ins, vandalism, or insurance claims at this property in the last 3 years? What carrier currently insures it and at what premium?
- What's the average days-on-market for RENTAL listings here right now (not sales)? A rising rental-DOM trend means longer vacancies and softer asking-rent achievability than the comps imply.
- What's the recent tenant-quality profile in this submarket — average credit score on applications, eviction rate, late-payment / NSF rate, and stable-employment percentage? A property-management company in the area should have these aggregated.
- How much new for-sale + rental construction is in the pipeline within 1–3 miles? Heavy new supply typically softens prices + rents 12–24 months out; constrained supply supports both.
Investment metrics
- 1% rule
- 1.05% ✓
- Cap rate
- 7.62%
- Cash-on-cash
- 4.73%
- DSCR
- 1.21
- GRM
- 7.9
CMA / ARV
- ARV (on-the-fly)
- $693,312
- Comps found
- 12
Show comp detail 12 sales within ~0.75 mi
| Address | Dist | Beds/Ba | Sqft | Sold | Price | $/sf | Match |
|---|---|---|---|---|---|---|---|
| 1545 Haddon St | 0.10mi | 3/3.5 | 2,506 (-0%) | 2mo | $729,000 | $291 | 93 |
| 1724 Woodhead St | 0.16mi | 3/3.5 | 2,502 (-0%) | 1mo | $640,000 | $256 | 91 |
| 1953 Haddon St | 0.21mi | 3/3.5 | 2,534 (+1%) | 2mo | $699,000 | $276 | 87 |
| 1311 Peden St | 0.37mi | 3/3.0 | 2,604 (+4%) | 1mo | $895,000 | $344 | 74 |
| 1701 Welch St | 0.21mi | 3/3.5 | 2,239 (-11%) | 2mo | $529,900 | $237 | 71 |
| 1405 Indiana St Unit A | 0.38mi | 3/3.5 | 2,694 (+7%) | 2mo | $759,000 | $282 | 68 |
| 1108 Peveto St Unit C | 0.49mi | 3/3.5 | 2,346 (-7%) | 2mo | $595,000 | $254 | 64 |
| 1209 Bomar St | 0.48mi | 4/2.0 (+1) | 2,564 (+2%) | 1mo | $649,000 | $253 | 62 |
| 1515 Hyde Park Blvd Blvd #6 | 0.46mi | 3/3.5 | 2,813 (+12%) | 1mo | $567,200 | $202 | 58 |
| 1110 Peden St Unit C | 0.58mi | 3/3.5 | 2,862 (+14%) | 1mo | $859,900 | $300 | 49 |
| 911 W Drew St | 0.72mi | 3/3.5 | 2,173 (-14%) | 0mo | $558,000 | $257 | 44 |
| 2407 Waugh Dr | 0.51mi | 4/3.0 (+1) | 2,880 (+15%) | 2mo | $1,095,000 | $380 | 43 |
Match score weights: distance 35% · size 25% · config 20% · recency 20%. Top-matched comps best support the ARV.
Projected returns pro-forma
-3.0% appreciation · 0.0% rent growth · sell at horizon
- IRR
- -12.5%
- Equity multiple
- 0.56×
- Total profit
- $-73,343
- Equity at exit
- $89,447
- IRR
- -9.0%
- Equity multiple
- 0.52×
- Total profit
- $-80,243
- Equity at exit
- $51,868
Cash invested: $167,972 (down + closing). Projections, not guarantees.
Landlord ↔ Tenant lean methodology
- Overall (STATE)
- 87 Strongly Landlord-Friendly
- State Texas
- 87 Strongly Landlord-Friendly · R+5
- County
- — inherits STATE
- City
- — inherits STATE
ZIP-level market 77019
- Rents YoY
- -0.9%
- Active inventory
- 256
- Price-to-rent
- 7.9×
Monthly cashflow live
- Estimated rent
- $6,314 high interval (Pro) →
- Mortgage (P&I)
- −$3,146
- Tax from tax record
- −$930 /mo · $11,157/yr
- Insurance
- −$250
- HOA
- −$0
- Vacancy / Maint / Mgmt
- −$1,326
- Net cashflow
- $662
Break-even live
UW: 25.0% down · 7.5% · 30yr · 1.5% tax · 5.0% vac · 8.0% maint · 8.0% mgmt
Financing live
Cash to close
- Down payment
- $149,975
- Closing costs
- $17,997
- Reserves months
- —
- Total cash needed
- —
Loan-product check · same deal, 3 products live
Conventional
25% down · 7.5% · 30yr
- Down + closing
- —
- Monthly P&I
- —
- Monthly cashflow
- —
- DSCR
- —
- Eligible?
- —
Personal DTI + credit; lowest rate.
DSCR
20% down · 8.5% · 30yr
- Down + closing
- —
- Monthly P&I
- —
- Monthly cashflow
- —
- DSCR
- —
- Eligible?
- —
No personal income docs; deal must DSCR.
Hard money
10% down · 12.0% · 12mo
- Down + closing
- —
- Monthly P&I
- —
- Monthly cashflow
- —
- DSCR
- —
- Eligible?
- —
Short-term bridge; refi at stabilization.
Rent comps 40 comps
| Address | Beds | Baths | Sqft | Rent | $/sqft | DOM | Units | Dist |
|---|---|---|---|---|---|---|---|---|
| 1951 W Bell St Houston, TX | 3.0 | 2.0 | 1800 | $2,400 | $1.33 | 14d | 1 | 0.24mi |
| 1951 W Bell St Houston, TX | 3.0 | 2.0 | 1800 | $2,400 | $1.33 | 43d | 1 | 0.24mi |
| 1958 W Gray St Unit 3165 Houston, TX | 3.0 | 2.0 | 3206 | $15,018 | $4.68 | 2d | 1 | 0.34mi |
| 1958 W Gray St Unit 1991 Houston, TX | 3.0 | 2.0 | 3206 | $15,050 | $4.69 | 10d | 1 | 0.34mi |
| 2205 Commonwealth St Houston, TX | 4.0 | 4.0 | 2513 | $3,300 | $1.31 | 43d | 1 | 0.36mi |
| 2323 Woodhead St Unit 1019542P Houston, TX | 3.0 | 3.5 | 2820 | $15,722 | $5.58 | 24d | 1 | 0.44mi |
| 1924 Fairview Ave Houston, TX | 3.0 | 3.5 | 2830 | $9,750 | $3.45 | 43d | 1 | 0.44mi |
| 1027 Gross St Houston, TX | 4.0 | 3.5 | 3035 | $5,800 | $1.91 | 43d | 1 | 0.46mi |
| 1326 Fairview Ave Houston, TX | 3.0 | 3.0 | 2176 | $3,250 | $1.49 | 43d | 1 | 0.47mi |
| 2024 Welch St Houston, TX | 3.0 | 4.0 | 2294 | $2,800 | $1.22 | 43d | 1 | 0.48mi |
| 811 Buffalo Park Dr Unit 3187 Houston, TX | 3.0 | 2.0 | 3632 | $15,392 | $4.24 | 2d | 1 | 0.53mi |
| 811 Buffalo Park Dr Unit 844 Houston, TX | 3.0 | 2.0 | 3632 | $14,913 | $4.11 | 13d | 1 | 0.53mi |
| 811 Buffalo Park Dr Unit 510 Houston, TX | 3.0 | 2.0 | 3632 | $15,424 | $4.25 | 11d | 1 | 0.53mi |
| 707 Marston St Unit 510 Houston, TX | 3.0 | 2.0 | 2310 | $12,482 | $5.40 | 3d | 1 | 0.63mi |
| 3333 Allen Pkwy Unit 1000 Houston, TX | 2.0 | 2.5 | 1860 | $4,500 | $2.42 | 43d | 1 | 0.65mi |
| 1211 Marconi St Houston, TX | 4.0 | 3.5 | 3020 | $4,500 | $1.49 | 43d | 1 | 0.65mi |
| 1501 Hawthorne St Houston, TX | 2.0 | 1.0 | 3341 | $1,525 | $0.46 | 43d | 1 | 0.68mi |
| 1118 Columbus St Unit A Houston, TX | 3.0 | 3.5 | 2338 | $3,000 | $1.28 | 43d | 1 | 0.72mi |
| 3411 Yoakum Blvd Unit 510 Houston, TX | 3.0 | 2.0 | 3110 | $12,304 | $3.96 | 11d | 1 | 0.88mi |
| 3411 Yoakum Blvd Unit 3165 Houston, TX | 3.0 | 2.0 | 3110 | $12,272 | $3.95 | 2d | 1 | 0.88mi |
| 414 Hyde Park Blvd Houston, TX | 3.0 | 3.5 | 2300 | $5,400 | $2.35 | 5d | 1 | 0.93mi |
| 710 Stanford St Houston, TX | 3.0 | 4.0 | 2438 | $3,490 | $1.43 | 43d | 1 | 0.93mi |
| 328 Bomar St Houston, TX | 3.0 | 3.5 | 2688 | $5,300 | $1.97 | 22d | 1 | 0.94mi |
| 2311 Westheimer Rd Houston, TX | 1.0–3.0 | 1.0–3.0 | 1489 | $13,862 | $9.31 | 1d | 14 | 1.03mi |
| 5201 Memorial Dr Houston, TX | 1.0–2.0 | 1.0–2.5 | 1071 | $3,361 | $3.14 | 1d | 21 | 1.04mi |
| 3131 Memorial Ct Houston, TX | 2.0 | 1.0–2.5 | 1336 | $3,418 | $2.56 | 1d | 32 | 1.08mi |
| 2243 W Alabama St Houston, TX | 3.0 | 3.0 | 1998 | $2,440 | $1.22 | 43d | 1 | 1.17mi |
| 4004 Montrose Blvd Unit 43C Houston, TX | 2.0 | 2.5 | 1908 | $3,150 | $1.65 | 24d | 1 | 1.17mi |
| 2025 Colquitt St Unit 1257741P Houston, TX | 3.0 | 3.5 | 2594 | $7,405 | $2.85 | 43d | 1 | 1.19mi |
| 420 Hawthorne St Houston, TX | 4.0 | 2.0 | 2230 | $3,373 | $1.51 | 43d | 1 | 1.19mi |
| 10 Oak Ct Unit 33 Houston, TX | 2.0 | 2.0 | 1882 | $2,802 | $1.49 | 16d | 1 | 1.25mi |
| 10 Oak Ct Unit 2174 Houston, TX | 2.0 | 2.0 | 1882 | $2,827 | $1.50 | 13d | 1 | 1.25mi |
| 911 Thompson St #911 Houston, TX | 4.0 | 3.5 | 3200 | $8,500 | $2.66 | 24d | 1 | 1.31mi |
| 913 Thompson St #913 Houston, TX | 4.0 | 3.5 | 3200 | $8,500 | $2.66 | 24d | 1 | 1.31mi |
| 2651 Kipling St Unit 510 Houston, TX | 3.0 | 2.0 | 2739 | $11,492 | $4.20 | 11d | 1 | 1.32mi |
| 2651 Kipling St Unit 3165 Houston, TX | 3.0 | 2.0 | 2739 | $11,460 | $4.18 | 2d | 1 | 1.32mi |
| 917 Thompson St Unit 917 Houston, TX | 4.0 | 3.5 | 3200 | $8,000 | $2.50 | 24d | 1 | 1.32mi |
| 915 Thompson St Unit 915 Houston, TX | 4.0 | 3.5 | 3200 | $8,500 | $2.66 | 24d | 1 | 1.32mi |
| 2719 Kipling St Unit B Houston, TX | 3.0 | 3.5 | 2184 | $4,400 | $2.01 | 43d | 1 | 1.35mi |
| 4444 Center St Houston, TX | 3.0 | 3.0 | 2121 | $3,200 | $1.51 | 43d | 1 | 1.44mi |
Listing history 12 events
-
2026-06-18statusdays on market $599,900 Active 1 DOM
-
2026-06-18days on market $599,900 Coming Soon 16 DOM
-
2026-06-17days on market $599,900 Coming Soon 15 DOM
-
2026-06-16days on market $599,900 Coming Soon 14 DOM
-
2026-06-15days on market $599,900 Coming Soon 13 DOM
-
2026-06-13days on market $599,900 Coming Soon 11 DOM
-
2026-06-09days on market $599,900 Coming Soon 7 DOM
-
2026-06-08days on market $599,900 Coming Soon 6 DOM
-
2026-06-07days on market $599,900 Coming Soon 5 DOM
-
2026-06-04days on market $599,900 Coming Soon 2 DOM
-
2026-06-02remarks 693-char remark
-
2026-06-02$599,900 Coming Soon 1 DOM
ⓘ Source: listings_history table (triggers on properties + properties_extension) + one-shot
backfill from property_details.listing_events for pre-trigger history.
Tax reassessment forecast TX · Resets to sale price
- Current annual tax
- $11,157 · $930/mo
- Projected year-2 tax
- $11,157 · $930/mo
- Expected delta
- $0/yr ($0/mo · 0.0%)
ⓘ Screening estimate from a state-policy table — verify with the county assessor before closing.
Climate risk First Street
- Flood 4/10 Moderate FEMA zone X (unshaded) · 22% chance over 30 yrs
- Wildfire 1/10 Low
- Heat 9/10 Extreme 7 d/yr ≥109°F today · 24 d/yr by 30 yrs out
- Wind 9/10 Extreme 99% chance of damaging wind over 30 yrs
- Air quality 3/10 Moderate 2 unhealthy d/yr today · 3 by 30 yrs out
Nearby sold comps map
Loading sold comps map…
Walkable amenities ~0.75 mi
Loading nearby amenities…
Taxation est. · year 1
- Rental income
- $75,762
- − Mortgage interest
- −$33,604
- − Property taxes
- −$11,157
- − Insurance
- −$3,000
- − Repairs & maintenance
- −$6,061
- − Management
- −$6,061
- − Depreciation
- −$17,452
- Taxable loss
- −$1,572
- Est. tax savings @ 24.0%
- +$377
- After-tax cash flow
- $8,321/yr
For passive investors: Depreciation is non-cash, so a rental often shows a tax loss while cash-flowing — sheltering income. Rental losses are passive: they offset passive income freely, and up to $25,000/yr can offset ordinary (W-2) income if you actively participate and your MAGI is under $100k (phasing out to $0 by $150k); unused losses carry forward. On sale, claimed depreciation is recaptured at up to 25%, and gains may owe capital-gains tax (a 1031 exchange can defer both). Figures are a year-1 estimate at your 24.0% rate — not tax advice; consult a CPA.
Schools (NCES district)
- District
- Houston ISD
- NCES district ID
- 4823640
- Math proficiency
- 27% ▼ -18.00%
- Reading proficiency
- 35% ▼ -6.00%
- Median HH income
- $46,054
- Composite
- 26.63/100
- National rank
- #7173
- State rank
- #593 of 826 in TX
Livability — Houston
- Score
- 74/100
- State rank
- #184
- US rank
- #4771
Category grades
Schools grade is shown separately in the Schools card above.
Census & demographics
- Census place
- Houston, TX
- County
- Harris County · 4,702,590 people
- City population
- 3,226,434
- Metro
- Houston-The Woodlands-Sugar Land, TX
- Population (ZIP)
- 23,708
- Household income
- $116,423
- Rent vs Own
- Severe rent burden
- 1844.0
Population outlook (Harris County) Hauer SSP2
- Today (2025)
- 5,571,493 people
- By 2030
- 6,089,821 · +9.3%
- By 2040
- 7,142,806 · +28.2%
- By 2050
- 8,185,864 · +46.9%
- By 2075
- 10,574,329 · +89.8%
- By 2100
- 12,109,958 · +117.4%
Race, ethnicity, and origin ACS 2023
- Neighborhood character
- Diverse neighborhood (Simpson 0.62)
- Race & ethnicity
- White 57% Hispanic / Latino 18% Two or more races 13% Asian 10% Black 9%
- Hispanic origin (detail)
- Mexican 12% Salvadoran 1%
- Common ancestry
- Lithuanian 4% Romanian 2% Slovak 2%
- Foreign-born
- 17% · Canada, China, Vietnam
- Languages at home
- 77% English-only · Spanish 11% Other Indo-European 4% Chinese 1%
Political lean MEDSL · Harris
- 2024 margin
- Lean D (+5.5) · D 52.0% · R 46.4% · Other 1.6%
- 2008→2024 swing
- +3.9pp toward D · 2008: 1.6pp · 2024: 5.5pp
- All cycles
- 2024: D+5.5 2020: D+13.3 2016: D+12.4 2012: D+0.1 2008: D+1.6
Not yet ingested
- Civics
- —
Market trends
- HPI YoY
- ▼ -131.69%
- Current HPI
- 179.271
- Rent YoY
- ▼ -0.95%
- Metro
- Houston-The Woodlands-Sugar Land, TX
- State GDP YoY
- ▲ 3.95%
- F500 in state
- 110
Industry mix (Fortune 500 HQ in TX)
| Industry | F500 HQs | Revenue |
|---|---|---|
| Energy | 16 | $1,198B |
|
||
| Technology | 5 | $198B |
|
||
| Engineering / Construction | 4 | $72B |
|
||
| Energy Services | 3 | $60B |
|
||
| Utilities | 3 | $41B |
|
||
| Healthcare | 2 | $330B |
|
||
Price history
+0.5% since first listed32 events — show timeline
- 2026-06-02 Coming Soon $599,900 HARMLS
- 2025-11-14 Rental Removed $4,000 HARMLS
- 2025-11-14 Listing Removed — HARMLS
- 2025-11-01 Listed for Rent $4,000 HARMLS
- 2025-10-04 Listed $540,000 HARMLS
- 2025-08-31 Rental Removed $3,800 HARMLS
- 2025-08-30 Listing Removed — HARMLS
- 2025-07-22 Price Changed $3,800 HARMLS
- 2025-07-21 Price Changed $540,000 HARMLS
- 2025-07-10 Price Changed $550,000 HARMLS
- 2025-07-08 Listed for Rent $3,900 HARMLS
- 2025-06-30 Rental Removed $4,000 HARMLS
- 2025-06-19 Listed for Rent $4,000 HARMLS
- 2025-06-12 Price Changed $555,000 HARMLS
- 2025-05-22 Price Changed $565,000 HARMLS
- 2025-05-09 Price Changed $575,000 HARMLS
- 2025-04-17 Listed $585,000 HARMLS
- 2025-03-31 Coming Soon — HARMLS
- 2024-03-08 Rental Removed $3,500 HARMLS
- 2024-03-02 Price Changed $3,500 HARMLS
- 2024-02-23 Price Changed $3,600 HARMLS
- 2024-02-01 Price Changed $3,700 HARMLS
- 2024-01-25 Listed for Rent $3,900 HARMLS
- 2024-01-21 Rental Removed $3,900 HARMLS
- 2024-01-13 Listed for Rent $3,900 HARMLS
- 2024-01-05 Sold (Public Records) — Public Records
- 2024-01-05 Sold (MLS) — HARMLS
- 2023-12-14 Pending — HARMLS
- 2023-12-07 Pending — HARMLS
- 2023-10-30 Listed $550,000 HARMLS
- 2022-09-26 Listing Removed — HARMLS
- 2022-07-06 Listed $597,000 HARMLS
Property tax history
+4.0%/yrLatest (2025): $11,157 · +1.6% YoY. Source: county tax records.
Cash-flow waterfall
monthlySold comps — $/sqft
last 12 mo · ≤1 miLoading sold comps…