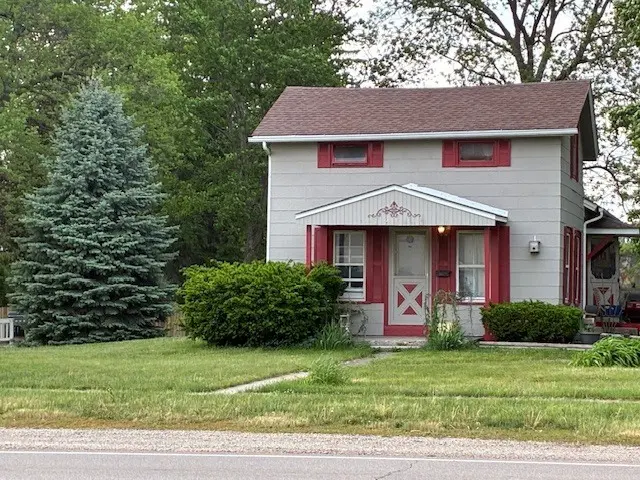
704 W Grant Hwy · Marengo, IL
Flood risk 1/10 · Minimal
- FEMA flood zone
- X (unshaded)
- Chance of flooding over 30 yrs
- 0.0%
- Est. flood insurance / yr
- $473 – $860
Fire risk 1/10 · Minimal
- Est. fire insurance / yr
- $804 – $1,492
Heat risk 2/10 · Minimal
- Hot days now (above 102°F)
- 7 days/yr
- Hot days in 30 yrs
- 14 days/yr
Wind risk 2/10 · Minimal
- Chance of severe wind over 30 yrs
- —
Air-quality risk 3/10 · Minor
- Unhealthy air days now
- 2 days/yr
- Unhealthy air days in 30 yrs
- 3 days/yr
Risk factors via First Street. Map © Google.
Why this score? — see what drove the D+ grade
The composite is a weighted blend of 9 inputs, each scored 0–100. Each bar is that input's sub-score; the figure is the points it added to the 100-point composite (weight × sub-score).
- Cash flow +15.6/30.0
- ARV discount +8.9/15.0
- DSCR +4.8/10.0
- 1% rule +4.6/10.0
- Schools +4.0/10.0
- Livability +3.2/5.0
- Rent growth +2.5/5.0
- Condition / age +2.5/5.0
- Appreciation +0.0/10.0
$195,999
🖨 Deal sheet (PDF) 📄 Offer letter ✓ Due diligence
Listing remarks
LOCATION, LOCATION, LOCATION!!! Rare . 55 acre corner lot fronting Rt 20 and West Street (Rt 20 frontage of 198') on west end of Marengo. Excellent opportunity for future development with B2 zoning in immediate neighborhood ( NAPA and Prairie Community Bank) Presently an aged home with long term renters paying $1,000 rent. Property being sold AS IS, no exceptions. Adjacent . 6 acre property also for sale. 1.1 acre parcel if combined. ..
Key facts
- 0.55 acre lot
- Garage
- Listed 25 days
Neighborhood map
What this means for you Summary
Snapshot
- This is a 2-bed/1.0-bath single-family listed at $196k.
Deal economics
- At list price, monthly cash flow is $83 ($998/yr) — positive.
- The deal already cash-flows at list — no discount required.
- To meet the 1% rule (rent ≥ 1% of price), the offer needs to be $189k (3.5% below list).
- Recommended offer: $189k (3.5% below list) — sets the bar for 1% rule.
- Cap rate 6.8% vs local median 4.2% in Marengo — top-decile yield for the area; either an underpriced asset or a hidden risk that comps aren't pricing in. Stress-test before assuming the spread holds.
Location & tenants
- Location reads 64/100 on livability (#708 in IL) — a middle-class / working-renter tenant base. Strengths: crime A+, cost of living A+, housing A+; Watch: amenities F, commute F, health & safety F.
- Marengo Chsd 154 (town): math 40% / reading 45% proficiency, ranked #240 of 919 in IL (top 26%) — families likely to look elsewhere, expect single-tenant / working-renter base with shorter leases.
- Zoned schools: Locust Elem School (math 47% / reading 32%, grade F, #392 of 2,056 statewide, top 21%, 535 students, 0% FRL); Marengo Comm Middle School (math 25% / reading 31%, grade F, #284 of 665 statewide, top 44%, 307 students, 0% FRL); Marengo High School (math 37% / reading 37%, grade F, #107 of 693 statewide, top 17%, 685 students, 0% FRL).
- Market conditions: 64 active listings in the ZIP; 3 comparable units currently listed for rent nearby; rentals leasing fast (median 0d on market — plan ~1-2 weeks tenant-placement turnaround); 1,595 units permitted in McHenry County in 2024 (485 in 5+ unit buildings).
Forward outlook
- Local home prices are declining (-3.0%/yr); year-one equity from $1k of loan paydown is wiped out by about $6k of value loss. Plan a longer hold.
- McHenry County population projected at -12% by 2050 — secular population decline; favor cash flow + early exit over multi-decade hold.
Negotiation context
- It's been on market 26 days — a 2% lower offer ($193k) is reasonable based on typical stale-listing flexibility.
- Current owner paid $128k; list at $196k implies a 54% gain — meaningful room to come down on a strong offer.
Questions for the listing agent
- Is there a deadline driving the sale (1031 exchange, divorce, estate, relocation)? That informs how much negotiation room exists.
- The area grade is low — what's the realistic commute time and amenity access for the typical tenant pool here? Any planned neighborhood developments (good or bad) we should know about?
- What's the average days-on-market for RENTAL listings here right now (not sales)? A rising rental-DOM trend means longer vacancies and softer asking-rent achievability than the comps imply.
- What's the recent tenant-quality profile in this submarket — average credit score on applications, eviction rate, late-payment / NSF rate, and stable-employment percentage? A property-management company in the area should have these aggregated.
- How much new for-sale + rental construction is in the pipeline within 1–3 miles? Heavy new supply typically softens prices + rents 12–24 months out; constrained supply supports both.
Investment metrics
- 1% rule
- 0.96% ✗
- Cap rate
- 6.80%
- Cash-on-cash
- 1.82%
- DSCR
- 1.08
- GRM
- 8.6
CMA / ARV
- ARV (on-the-fly)
- $202,400
- Comps found
- 12
Show comp detail 12 sales within ~0.75 mi
| Address | Dist | Beds/Ba | Sqft | Sold | Price | $/sf | Match |
|---|---|---|---|---|---|---|---|
| 439 W Grant Hwy | 0.20mi | 2/2.0 | 1,200 (+9%) | 0mo | $271,000 | $226 | 71 |
| 740 Cherokee Trl | 0.50mi | 2/2.0 | 1,080 (-2%) | 17mo | $58,000 | $54 | 56 |
| 540 Navajo Trl | 0.44mi | 2/2.0 | 1,152 (+5%) | 14mo | $87,000 | $76 | 56 |
| 118 E Forest St | 0.57mi | 2/1.0 | 1,100 (0%) | 22mo | $220,000 | $200 | 55 |
| 847 Cayuga Trl | 0.51mi | 2/2.0 | 1,080 (-2%) | 21mo | $93,000 | $86 | 52 |
| 644 Mohawk Trl | 0.47mi | 2/2.0 | 1,152 (+5%) | 19mo | $75,000 | $65 | 50 |
| 212 E Vanburen St | 0.64mi | 3/1.0 (+1) | 1,185 (+8%) | 6mo | $217,500 | $184 | 47 |
| 624 S State St | 0.52mi | 2/1.5 | 1,176 (+7%) | 21mo | $218,500 | $186 | 45 |
| 624 S State St | 0.52mi | 2/1.5 | 1,176 (+7%) | 21mo | $218,500 | $186 | 45 |
| 630 Mohawk Trl | 0.50mi | 2/2.0 | 1,236 (+12%) | 12mo | $68,000 | $55 | 42 |
| 208 N Taylor St | 0.60mi | 2/1.0 | 1,000 (-9%) | 18mo | $197,000 | $197 | 42 |
| 333 Elm St | 0.73mi | 2/1.0 | 1,016 (-8%) | 15mo | $140,000 | $138 | 41 |
Match score weights: distance 35% · size 25% · config 20% · recency 20%. Top-matched comps best support the ARV.
Projected returns pro-forma
-3.0% appreciation · 3.0% rent growth · sell at horizon
- IRR
- -13.4%
- Equity multiple
- 0.52×
- Total profit
- $-26,399
- Equity at exit
- $29,224
- IRR
- -4.4%
- Equity multiple
- 0.71×
- Total profit
- $-15,911
- Equity at exit
- $16,946
Cash invested: $54,880 (down + closing). Projections, not guarantees.
Landlord ↔ Tenant lean methodology
- Overall (STATE)
- 43 Moderately Tenant-Leaning
- State Illinois
- 43 Moderately Tenant-Leaning · D+7
- County
- — inherits STATE
- City
- — inherits STATE
ZIP-level market 60152
- Home prices YoY
- -22.7%
- Active inventory
- 64
- Price-to-rent
- 8.6×
Monthly cashflow live
- Estimated rent
- $1,890 medium interval (Pro) →
- Mortgage (P&I)
- −$1,028
- Tax from tax record
- −$301 /mo · $3,609/yr
- Insurance
- −$82
- HOA
- −$0
- Vacancy / Maint / Mgmt
- −$397
- Net cashflow
- $83
Break-even live
Sensitivity live
| Price | -10% $194 | -5% $139 | +0% $83 | +5% $28 | +10% $-28 |
|---|---|---|---|---|---|
| Rent | -10% $-66 | -5% $9 | +0% $83 | +5% $158 | +10% $233 |
| Rate | -1.0pp $182 | -0.5pp $133 | base $83 | +0.5pp $32 | +1.0pp $-19 |
UW: 25.0% down · 7.5% · 30yr · 1.5% tax · 5.0% vac · 8.0% maint · 8.0% mgmt
Financing live
Cash to close
- Down payment
- $49,000
- Closing costs
- $5,880
- Reserves months
- —
- Total cash needed
- —
Loan-product check · same deal, 3 products live
Conventional
25% down · 7.5% · 30yr
- Down + closing
- —
- Monthly P&I
- —
- Monthly cashflow
- —
- DSCR
- —
- Eligible?
- —
Personal DTI + credit; lowest rate.
DSCR
20% down · 8.5% · 30yr
- Down + closing
- —
- Monthly P&I
- —
- Monthly cashflow
- —
- DSCR
- —
- Eligible?
- —
No personal income docs; deal must DSCR.
Hard money
10% down · 12.0% · 12mo
- Down + closing
- —
- Monthly P&I
- —
- Monthly cashflow
- —
- DSCR
- —
- Eligible?
- —
Short-term bridge; refi at stabilization.
Rent comps 3 comps
| Address | Beds | Baths | Sqft | Rent | $/sqft | DOM | Units | Dist |
|---|---|---|---|---|---|---|---|---|
| 479 Eisenhower St Unit A Marengo, IL | 3.0 | 2.0 | 1300 | $1,795 | $1.38 | 0d | 1 | 0.23mi |
| 958 Partridge Cir Marengo, IL | 2.0 | 2.0 | 1400 | $2,195 | $1.57 | 3d | 1 | 1.33mi |
| 739 Quail Ln Marengo, IL | 2.0 | 2.5 | 1400 | $2,195 | $1.57 | 0d | 1 | 1.39mi |
Listing history 16 events
-
2026-06-21days on market $195,999 Active 26 DOM
-
2026-06-18days on market $195,999 Active 23 DOM
-
2026-06-17pricedays on market $195,999 Active 22 DOM
-
2026-06-16days on market $225,000 Active 21 DOM
-
2026-06-15days on market $225,000 Active 20 DOM
-
2026-06-13days on market $225,000 Active 18 DOM
-
2026-06-13days on market $225,000 Active 17 DOM
-
2026-06-09days on market $225,000 Active 14 DOM
-
2026-06-08days on market $225,000 Active 13 DOM
-
2026-06-07days on market $225,000 Active 12 DOM
-
2026-06-04days on market $225,000 Active 9 DOM
-
2026-06-03days on market $225,000 Active 8 DOM
-
2026-06-02days on market $225,000 Active 7 DOM
-
2026-06-01days on market $225,000 Active 6 DOM
-
2026-05-31days on market $225,000 Active 5 DOM
-
1993-02-19soldstatus $127,500
ⓘ Source: listings_history table (triggers on properties + properties_extension) + one-shot
backfill from property_details.listing_events for pre-trigger history.
Tax reassessment forecast IL · Partial reset (capped growth)
- Current annual tax
- $3,609 · $301/mo
- Projected year-2 tax
- $4,029 · $336/mo
- Expected delta
- +$420/yr (+$35/mo · 11.6%)
ⓘ Screening estimate from a state-policy table — verify with the county assessor before closing.
Climate risk First Street
- Flood 1/10 Low FEMA zone X (unshaded) · 0% chance over 30 yrs
- Wildfire 1/10 Low
- Heat 2/10 Low 7 d/yr ≥102°F today · 14 d/yr by 30 yrs out
- Wind 2/10 Low
- Air quality 3/10 Moderate 2 unhealthy d/yr today · 3 by 30 yrs out
Nearby sold comps map
Loading sold comps map…
Walkable amenities ~0.75 mi
Loading nearby amenities…
Taxation est. · year 1
- Rental income
- $22,686
- − Mortgage interest
- −$10,979
- − Property taxes
- −$3,609
- − Insurance
- −$980
- − Repairs & maintenance
- −$1,815
- − Management
- −$1,815
- − Depreciation
- −$5,702
- Taxable loss
- −$2,214
- Est. tax savings @ 24.0%
- +$531
- After-tax cash flow
- $1,530/yr
For passive investors: Depreciation is non-cash, so a rental often shows a tax loss while cash-flowing — sheltering income. Rental losses are passive: they offset passive income freely, and up to $25,000/yr can offset ordinary (W-2) income if you actively participate and your MAGI is under $100k (phasing out to $0 by $150k); unused losses carry forward. On sale, claimed depreciation is recaptured at up to 25%, and gains may owe capital-gains tax (a 1031 exchange can defer both). Figures are a year-1 estimate at your 24.0% rate — not tax advice; consult a CPA.
Schools (NCES district)
- District
- Marengo Chsd 154
- NCES district ID
- 1724570
- Math proficiency
- 40% ▼ -5.00%
- Reading proficiency
- 45% ▲ 5.00%
- Median HH income
- $65,606
- Composite
- 40.37/100
- National rank
- #7752
- State rank
- #240 of 919 in IL
Livability — Marengo
- Score
- 64/100
- State rank
- #708
- US rank
- #14374
Category grades
Schools grade is shown separately in the Schools card above.
Census & demographics
- Census place
- Marengo, IL
- Population (ZIP)
- 12,006
Population outlook (McHenry County) Hauer SSP2
- Today (2025)
- 305,342 people
- By 2030
- 301,491 · -1.3%
- By 2040
- 288,211 · -5.6%
- By 2050
- 268,430 · -12.1%
- By 2075
- 226,209 · -25.9%
- By 2100
- 181,247 · -40.6%
Race, ethnicity, and origin ACS 2023
- Neighborhood character
- Predominantly White (88%)
- Race & ethnicity
- White 88% Hispanic / Latino 9% Two or more races 5%
- Hispanic origin (detail)
- Mexican 8%
- Common ancestry
- Romanian 10% Portuguese 1% Italian 1%
- Foreign-born
- 5% · Canada
- Languages at home
- 92% English-only · Spanish 6% Russian/Polish/Slavic 1% German/W. Germanic 1%
Political lean MEDSL · McHenry
- 2024 margin
- Lean R (+5.3) · D 46.6% · R 51.9% · Other 1.5%
- 2008→2024 swing
- -10.6pp toward R · 2008: 5.3pp · 2024: -5.3pp
- All cycles
- 2024: R+5.3 2020: R+2.5 2016: R+8.1 2012: R+8.8 2008: D+5.3
Not yet ingested
- Civics
- —
Market trends
- HPI YoY
- ▼ -66.07%
- Current HPI
- 224.4483
- Rent YoY
- —
- Metro
- —
- State GDP YoY
- ▲ 1.59%
- F500 in state
- 60
Industry mix (Fortune 500 HQ in IL)
| Industry | F500 HQs | Revenue |
|---|---|---|
| Insurance | 4 | $201B |
|
||
| Consumer Goods | 4 | $87B |
|
||
| Industrial Machinery | 3 | $64B |
|
||
| Healthcare | 2 | $55B |
|
||
| Retail / Pharmacy | 1 | $148B |
|
||
| Agriculture / Food | 1 | $86B |
|
||
Price history
1 event — show timeline
- 1993-02-19 Sold (Public Records) $127,500 Public Records
Property tax history
-0.9%/yrLatest (2024): $3,609 · +1.8% YoY. Source: county tax records.
Cash-flow waterfall
monthlySold comps — $/sqft
last 12 mo · ≤1 miLoading sold comps…