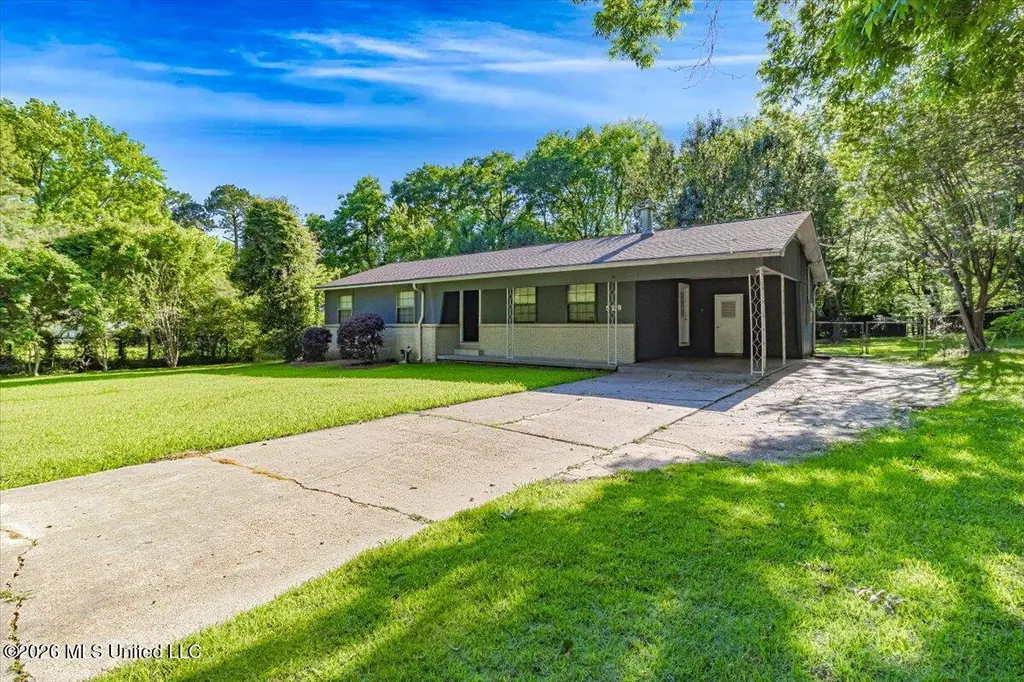
529 Wolcott Cir · Ridgeland, MS
Flood risk 1/10 · Minimal
- FEMA flood zone
- X (unshaded)
- Chance of flooding over 30 yrs
- 0.0%
- Est. flood insurance / yr
- $507 – $1,088
Fire risk 1/10 · Minimal
- Est. fire insurance / yr
- $1,241 – $2,305
Heat risk 7/10 · Major
- Hot days now (above 108°F)
- 7 days/yr
- Hot days in 30 yrs
- 20 days/yr
Wind risk 8/10 · Major
- Chance of severe wind over 30 yrs
- 80.0%
Air-quality risk 2/10 · Minimal
- Unhealthy air days now
- 0 days/yr
- Unhealthy air days in 30 yrs
- 1 days/yr
Risk factors via First Street. Map © Google.
Why this score? — see what drove the C+ grade
The composite is a weighted blend of 9 inputs, each scored 0–100. Each bar is that input's sub-score; the figure is the points it added to the 100-point composite (weight × sub-score).
- Cash flow +21.9/30.0
- ARV discount +14.5/15.0
- DSCR +7.0/10.0
- 1% rule +5.2/10.0
- Schools +4.8/10.0
- Rent growth +3.9/5.0
- Livability +3.4/5.0
- Condition / age +2.5/5.0
- Appreciation +0.0/10.0
$168,000
🖨 Deal sheet (PDF) 📄 Offer letter ✓ Due diligence
Listing remarks
Spacious and inviting 3 Bedroom / 2 Bath home located in a well-established community on a large lot with plenty of room to enjoy! This move-in ready home features a cozy fireplace in the living room, a welcoming front porch, and a spacious layout designed for comfortable living. The huge deck off the primary bedroom creates the perfect private retreat for morning coffee or evening relaxation. Enjoy the fenced backyard with space for entertaining, pets, or play. With charm, space, and so many desirable features, what's not to love?
Key facts
- Cozy fireplace
- Huge deck
- Fenced backyard
Tags
Property features AI
Exterior
- Parking: 1-space carport
- Security: Smoke detectors
- Utilities: Public water; Public sewer; Electricity available; Cable available
- Home design: Single family residence; House; One level; Move-in ready
- Construction: Wood siding; Conventional foundation; Asphalt shingle roof; Built in 1,600 sq ft (per assessor)
- Exterior features: Deck; Back yard fencing
Interior
- Kitchen: Electric cooktop
- Flooring: Ceramic tile; Wood
- Bathrooms: 2 full bathrooms
- Heating & cooling: Central heating (natural gas); Central air; Ceiling fans
- Interior features: Double vanity; Soaking tub; Interior storage; Walk-in closet(s); Metal windows; Has fireplace (living room)
- Laundry & utility: Electric water heater
Neighborhood map
What this means for you Summary
Snapshot
- This is a 3-bed/3.0-bath single-family listed at $168k.
Deal economics
- At list price, monthly cash flow is $264 ($3k/yr) — positive.
- The deal already cash-flows at list — no discount required.
- Meets the 1% rule at list price ($2k rent vs $168k).
- Recommended offer: $165k (1.5% below list) — sets the bar for market timing.
- Cap rate 8.2% vs local median 2.8% in Ridgeland — top-decile yield for the area; either an underpriced asset or a hidden risk that comps aren't pricing in. Stress-test before assuming the spread holds.
Location & tenants
- Location reads 68/100 on livability (#57 in MS) — a middle-class / working-renter tenant base. Strengths: cost of living A+, housing A+; Watch: amenities F, commute F, health & safety F.
- Madison County School District (rural): math 54% / reading 54% proficiency, ranked #3 of 130 in MS (top 2%) — acceptable for families but not a draw, mixed tenant base, ~2y average lease.
- Zoned schools: Ann Smith Elementary (746 students, 100% FRL); Ridgeland High School (math 27% / reading 35%, grade F, #85 of 197 statewide, top 43%, 968 students, 100% FRL) — zoned schools average 100% FRL vs 29% district-wide (70 pts higher); higher-poverty schools than district average — tighter screening recommended.
- Zoned-school proficiency averages 31% at this address vs 54% district-wide (-23 pts) — the specific schools serving this property underperform the Madison County School District average; the district grade overstates school quality for this exact location.
- Market conditions: Rents rising fast (+5.7%/yr); 132 active listings in the ZIP; 10 comparable units currently listed for rent nearby; rentals at typical pace (median 24d on market — plan ~3-4 weeks tenant-placement turnaround); 40% of comp listings sitting > 30 days — soft ceiling on asking rent; 553 units permitted in Madison County in 2024 (0 in 5+ unit buildings).
- This rent runs 31% of the median local income ($66k/yr) — at the standard rent-burdened threshold; future hikes will face affordability resistance.
Forward outlook
- Local home prices are declining (-3.0%/yr); year-one equity from $1k of loan paydown is wiped out by about $5k of value loss. Plan a longer hold.
- Madison County population projected at +34% by 2050 — long-run rental-demand tailwind backs the buy-and-hold thesis.
- At projected returns (-3.0% appreciation + 5.7% rent growth), your $47k cash investment doubles in ~10 years — after that, you're playing with house money.
Negotiation context
- It's been on market 24 days — a 2% lower offer ($165k) is reasonable based on typical stale-listing flexibility.
- 5 sale attempts since 22y ago with the ask held roughly flat each time — persistent listings suggest the price (not the market) is what's stuck; bring a comps-based counter.
Risks & watch-outs
- Climate carrying-cost: severe wind risk, 80% chance of damaging wind over 30y; extreme-heat days projected 7→20/yr by 2055 (HVAC capex compounding) — expect insurance premiums to compound above CPI over the hold.
Questions for the listing agent
- Built in 1962 — when were the roof, HVAC, electrical panel, plumbing, and water heater last replaced?
- Is there a deadline driving the sale (1031 exchange, divorce, estate, relocation)? That informs how much negotiation room exists.
- What's the average days-on-market for RENTAL listings here right now (not sales)? A rising rental-DOM trend means longer vacancies and softer asking-rent achievability than the comps imply.
- What's the recent tenant-quality profile in this submarket — average credit score on applications, eviction rate, late-payment / NSF rate, and stable-employment percentage? A property-management company in the area should have these aggregated.
- How much new for-sale + rental construction is in the pipeline within 1–3 miles? Heavy new supply typically softens prices + rents 12–24 months out; constrained supply supports both.
Investment metrics
- 1% rule
- 1.02% ✓
- Cap rate
- 8.18%
- Cash-on-cash
- 6.73%
- DSCR
- 1.30
- GRM
- 8.2
CMA / ARV
- ARV (median comp)
- $199,137
- List price
- $168,000
- Delta
- -15.64%
- Verdict
- UNDERPRICED
- Comps
- 20 within 1.0 mi
Show comp detail 12 sales within ~0.75 mi
| Address | Dist | Beds/Ba | Sqft | Sold | Price | $/sf | Match |
|---|---|---|---|---|---|---|---|
| 522 Christine Dr | 0.15mi | 4/2.0 (+1) | 1,623 (+2%) | 5mo | $279,900 | $172 | 78 |
| 304 Longmeadow Dr | 0.54mi | 3/2.0 | 1,569 (-2%) | 2mo | $225,000 | $143 | 66 |
| 146 Wheatley Place Pl | 0.30mi | 3/2.0 | 1,516 (-5%) | 12mo | $184,900 | $122 | 63 |
| 311 Longmeadow Dr | 0.50mi | 3/2.0 | 1,675 (+5%) | 14mo | $220,000 | $131 | 53 |
| 427 Millett St | 0.18mi | 3/2.0 | 1,418 (-11%) | 18mo | $225,000 | $159 | 53 |
| 314 Creston Ct | 0.37mi | 3/2.0 | 1,482 (-7%) | 19mo | $244,000 | $165 | 50 |
| 215 Nolan Cir | 0.51mi | 3/2.0 | 1,500 (-6%) | 15mo | $95,000 | $63 | 50 |
| 309 Pear Orchard Pl | 0.69mi | 3/1.5 | 1,608 (+1%) | 18mo | $230,000 | $143 | 46 |
| 211 Boyd St | 0.44mi | 3/2.0 | 1,395 (-13%) | 11mo | $130,000 | $93 | 45 |
| 288 Longwood Cv | 0.61mi | 3/2.0 | 1,810 (+13%) | 4mo | $225,000 | $124 | 42 |
| 528 Boardwalk Blvd | 0.47mi | 2/2.5 (-1) | 1,401 (-12%) | 13mo | $189,900 | $136 | 40 |
| 308 South Ridge Dr | 0.63mi | 4/2.0 (+1) | 1,366 (-15%) | 14mo | $250,000 | $183 | 26 |
Match score weights: distance 35% · size 25% · config 20% · recency 20%. Top-matched comps best support the ARV.
Projected returns pro-forma
-3.0% appreciation · 5.65% rent growth · sell at horizon
- IRR
- -3.2%
- Equity multiple
- 0.88×
- Total profit
- $-5,741
- Equity at exit
- $25,049
- IRR
- 9.2%
- Equity multiple
- 1.79×
- Total profit
- $36,927
- Equity at exit
- $14,526
Cash invested: $47,040 (down + closing). Projections, not guarantees.
Landlord ↔ Tenant lean methodology
- Overall (STATE)
- 90 Strongly Landlord-Friendly
- State Mississippi
- 90 Strongly Landlord-Friendly · R+11
- County
- — inherits STATE
- City
- — inherits STATE
ZIP-level market 39157
- Home prices YoY
- -22.8%
- Rents YoY
- 5.7%
- Active inventory
- 132
- Price-to-rent
- 8.2×
Monthly cashflow live
- Estimated rent
- $1,717 high interval (Pro) →
- Mortgage (P&I)
- −$881
- Tax from tax record
- −$142 /mo · $1,698/yr
- Insurance
- −$70
- HOA
- −$0
- Vacancy / Maint / Mgmt
- −$361
- Net cashflow
- $264
Break-even live
Sensitivity live
| Price | -10% $359 | -5% $311 | +0% $264 | +5% $216 | +10% $169 |
|---|---|---|---|---|---|
| Rent | -10% $128 | -5% $196 | +0% $264 | +5% $332 | +10% $399 |
| Rate | -1.0pp $348 | -0.5pp $307 | base $264 | +0.5pp $220 | +1.0pp $176 |
UW: 25.0% down · 7.5% · 30yr · 1.5% tax · 5.0% vac · 8.0% maint · 8.0% mgmt
Financing live
Cash to close
- Down payment
- $42,000
- Closing costs
- $5,040
- Reserves months
- —
- Total cash needed
- —
Loan-product check · same deal, 3 products live
Conventional
25% down · 7.5% · 30yr
- Down + closing
- —
- Monthly P&I
- —
- Monthly cashflow
- —
- DSCR
- —
- Eligible?
- —
Personal DTI + credit; lowest rate.
DSCR
20% down · 8.5% · 30yr
- Down + closing
- —
- Monthly P&I
- —
- Monthly cashflow
- —
- DSCR
- —
- Eligible?
- —
No personal income docs; deal must DSCR.
Hard money
10% down · 12.0% · 12mo
- Down + closing
- —
- Monthly P&I
- —
- Monthly cashflow
- —
- DSCR
- —
- Eligible?
- —
Short-term bridge; refi at stabilization.
Rent comps 10 comps
| Address | Beds | Baths | Sqft | Rent | $/sqft | DOM | Units | Dist |
|---|---|---|---|---|---|---|---|---|
| 225 Walnut Ridge St Ridgeland, MS | 3.0 | 2.0 | 1500 | $1,850 | $1.23 | 14d | 1 | 0.35mi |
| 340 Arbor Dr Ridgeland, MS | 1.0–2.0 | 1.0–2.0 | 850 | $1,374 | $1.62 | 14d | 26 | 0.46mi |
| 320 Southridge Dr Ridgeland, MS | 3.0 | 2.0 | 1467 | $1,856 | $1.27 | 44d | 1 | 0.56mi |
| 205 Pecan Park Dr Ridgeland, MS | 3.0 | 2.0 | 1066 | $1,850 | $1.74 | 44d | 1 | 0.60mi |
| 331 Peach Orchard Dr Ridgeland, MS | 2.0 | 2.0 | 1300 | $1,700 | $1.31 | 44d | 1 | 0.70mi |
| 580 S Pear Orchard Rd Ridgeland, MS | 1.0–3.0 | 1.0–2.0 | 950 | $1,984 | $2.09 | 14d | 15 | 0.85mi |
| 711 Lake Harbour Dr Ridgeland, MS | 2.0 | 2.0 | 1100 | $1,354 | $1.23 | 14d | 1 | 1.25mi |
| 1620 E County Line Rd Ridgeland, MS | 1.0–3.0 | 1.0–2.5 | 1126 | $1,595 | $1.42 | 14d | 7 | 1.33mi |
| 1702 Jamestown Way Unit 1702 Jackson, MS | 3.0 | 2.0 | 1465 | $1,495 | $1.02 | 44d | 1 | 1.34mi |
| 3001 Jamestown Way Jackson, MS | 2.0 | 1.5 | 1200 | $1,100 | $0.92 | 24d | 1 | 1.35mi |
Listing history 21 events
-
2026-06-07statusdays on market $168,000 Pending 24 DOM
-
2026-06-03days on market $168,000 Active 22 DOM
-
2026-06-02days on market $168,000 Active 21 DOM
-
2026-06-01days on market $168,000 Active 20 DOM
-
2026-05-31days on market $168,000 Active 19 DOM
-
2026-05-30days on market $168,000 Active 18 DOM
-
2026-05-12$168,000 Active 537-char remark
-
2024-03-29historical $1,660
-
2024-03-14price $1,660
-
2024-03-01price $1,695
-
2024-01-31$1,765
-
2021-10-08historical
-
2021-10-08historical
-
2018-10-05$99,900
-
2005-10-25soldstatus
-
2005-10-17soldstatus
-
2005-05-09$116,500
-
2004-01-14$105,000
-
1993-10-06soldstatus
-
1986-02-26soldstatus
-
1986-02-26soldstatus
ⓘ Source: listings_history table (triggers on properties + properties_extension) + one-shot
backfill from property_details.listing_events for pre-trigger history.
Tax reassessment forecast MS · Resets to sale price
- Current annual tax
- $1,698 · $142/mo
- Projected year-2 tax
- $1,698 · $142/mo
- Expected delta
- $0/yr ($0/mo · 0.0%)
ⓘ Screening estimate from a state-policy table — verify with the county assessor before closing.
Climate risk First Street
- Flood 1/10 Low FEMA zone X (unshaded) · 0% chance over 30 yrs
- Wildfire 1/10 Low
- Heat 7/10 Severe 7 d/yr ≥108°F today · 20 d/yr by 30 yrs out
- Wind 8/10 Severe 80% chance of damaging wind over 30 yrs
- Air quality 2/10 Low 0 unhealthy d/yr today · 1 by 30 yrs out
Nearby sold comps map
Loading sold comps map…
Walkable amenities ~0.75 mi
Loading nearby amenities…
Taxation est. · year 1
- Rental income
- $20,602
- − Mortgage interest
- −$9,411
- − Property taxes
- −$1,698
- − Insurance
- −$840
- − Repairs & maintenance
- −$1,648
- − Management
- −$1,648
- − Depreciation
- −$4,887
- Taxable income
- $470
- Est. tax owed @ 24.0%
- −$113
- After-tax cash flow
- $3,053/yr
For passive investors: Depreciation is non-cash, so a rental often shows a tax loss while cash-flowing — sheltering income. Rental losses are passive: they offset passive income freely, and up to $25,000/yr can offset ordinary (W-2) income if you actively participate and your MAGI is under $100k (phasing out to $0 by $150k); unused losses carry forward. On sale, claimed depreciation is recaptured at up to 25%, and gains may owe capital-gains tax (a 1031 exchange can defer both). Figures are a year-1 estimate at your 24.0% rate — not tax advice; consult a CPA.
Schools (NCES district)
- District
- Madison County School District
- NCES district ID
- 2802790
- Math proficiency
- 54% ▼ -7.00%
- Reading proficiency
- 54% ▼ -7.00%
- Median HH income
- $70,579
- Composite
- 48.08/100
- National rank
- #2188
- State rank
- #3 of 130 in MS
Livability — Ridgeland
- Score
- 68/100
- State rank
- #57
- US rank
- #9276
Category grades
Schools grade is shown separately in the Schools card above.
Census & demographics
- Census place
- Ridgeland, MS
- County
- Madison County · 75,005 people
- City population
- 24,562
- Metro
- Jackson, MS
- Population (ZIP)
- 24,562
- Household income
- $66,068
- Rent vs Own
- Severe rent burden
- 1370.0
Population outlook (Madison County) Hauer SSP2
- Today (2025)
- 122,509 people
- By 2030
- 131,737 · +7.5%
- By 2040
- 148,930 · +21.6%
- By 2050
- 164,300 · +34.1%
- By 2075
- 197,495 · +61.2%
- By 2100
- 211,429 · +72.6%
Race, ethnicity, and origin ACS 2023
- Neighborhood character
- Diverse neighborhood (Simpson 0.61)
- Race & ethnicity
- Black 44% White 43% Hispanic / Latino 7% Two or more races 4% Asian 3%
- Hispanic origin (detail)
- Mexican 6%
- Common ancestry
- Italian 3% Lithuanian 3% Serbian 1%
- Foreign-born
- 7% · Canada, China, Vietnam
- Languages at home
- 90% English-only · Spanish 6% Other Indo-European 1% Chinese 1%
Political lean MEDSL · Madison
- 2024 margin
- R (+17.3) · D 40.8% · R 58.0% · Other 1.2%
- 2008→2024 swing
- -1.7pp toward R · 2008: -15.6pp · 2024: -17.3pp
- All cycles
- 2024: R+17.3 2020: R+11.8 2016: R+16.1 2012: R+15.7 2008: R+15.6
Not yet ingested
- Civics
- —
Market trends
- HPI YoY
- ▼ -45.34%
- Current HPI
- 153.1826
- Rent YoY
- ▲ 5.65%
- Metro
- Jackson, MS
- State GDP YoY
- —
- F500 in state
- 0
Price history
+60.0% since first listed16 events — show timeline
- 2026-06-05 Pending — MLSU
- 2026-05-12 Listed $168,000 MLSU
- 2024-03-29 Rental Removed $1,660 RENTLY
- 2024-03-14 Price Changed $1,660 RENTLY
- 2024-03-01 Price Changed $1,695 RENTLY
- 2024-01-31 Listed for Rent $1,765 RENTLY
- 2021-10-08 Listing Removed — MLSU
- 2021-10-08 Listing Removed — MLSU
- 2018-10-05 Listed $99,900 MLSU
- 2005-10-25 Sold (MLS) — MLSU
- 2005-10-17 Sold (Public Records) — Public Records
- 2005-05-09 Listed $116,500 MLSU
- 2004-01-14 Listed $105,000 MLSU
- 1993-10-06 Sold (Public Records) — Public Records
- 1986-02-26 Sold (Public Records) — Public Records
- 1986-02-26 Sold (Public Records) — Public Records
Property tax history
+1.9%/yrLatest (2025): $1,698 · +0.0% YoY. Source: county tax records.
Cash-flow waterfall
monthlySold comps — $/sqft
last 12 mo · ≤1 miLoading sold comps…