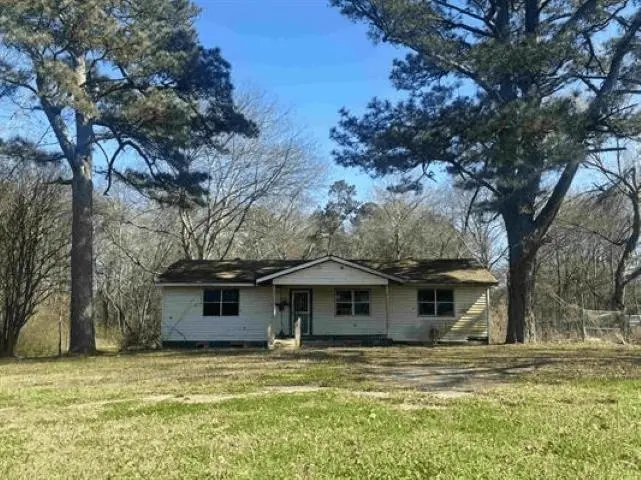
4544 US Hwy 79 · Carthage, TX
Flood risk 1/10 · Minimal
- FEMA flood zone
- —
- Chance of flooding over 30 yrs
- 0.0%
- Est. flood insurance / yr
- —
Fire risk 4/10 · Minor
- Est. fire insurance / yr
- $1,222 – $2,270
Heat risk 7/10 · Major
- Hot days now (above 111°F)
- 7 days/yr
- Hot days in 30 yrs
- 23 days/yr
Wind risk 6/10 · Moderate
- Chance of severe wind over 30 yrs
- 76.0%
Air-quality risk 2/10 · Minimal
- Unhealthy air days now
- 0 days/yr
- Unhealthy air days in 30 yrs
- 1 days/yr
Risk factors via First Street. Map © Google.
Why this score? — see what drove the B grade
The composite is a weighted blend of 9 inputs, each scored 0–100. Each bar is that input's sub-score; the figure is the points it added to the 100-point composite (weight × sub-score).
- Cash flow +30.0/30.0
- 1% rule +10.0/10.0
- DSCR +10.0/10.0
- ARV discount +7.5/15.0
- Appreciation +5.0/10.0
- Livability +3.6/5.0
- Schools +3.5/10.0
- Rent growth +2.5/5.0
- Condition / age +2.2/5.0
$49,900
🖨 Deal sheet (PDF) 📄 Offer letter ✓ Due diligence
Listing remarks
Investor Special or Dream Home Project! This 3-bedroom, 1-bathroom home is ready for someone with a vision! Located just 13 minutes from Carthage and 35 minutes from Shreveport, it offers a fantastic opportunity to create something truly special. With a spacious backyard and endless potential, this property is priced to sell and perfect for anyone who doesn’t mind putting in some work.
Key facts
- Spacious backyard
- 0.75 acre lot
- Built 1979
Tags
Property features AI
Exterior
- Utilities: Septic tank sewer
- Home design: Single-family residence; One story
- Construction: Frame construction; Pillar/post/pier foundation
- Exterior features: Composition roof; No pool; No other structures
Interior
- Bathrooms: 1 full bathroom
- Heating & cooling: No heating system
- Interior features: 3 total rooms
Neighborhood map
What this means for you Summary
Snapshot
- This is a 3-bed/1.0-bath single-family listed at $50k. Condition is rated fair.
Deal economics
- At list price, monthly cash flow is $936 ($11k/yr) — positive.
- The deal already cash-flows at list — no discount required.
- Meets the 1% rule at list price ($2k rent vs $50k).
- Recommended offer: $48k (3.0% below list) — sets the bar for market timing.
Location & tenants
- Location reads 72/100 on livability (#258 in TX) — a middle-class / working-renter tenant base. Strengths: cost of living A+, housing A+, health & safety A+; Watch: schools D+, employment D+, crime F.
- Carthage ISD (town): math 41% / reading 41% proficiency, ranked #364 of 826 in TX (top 44%) — families likely to look elsewhere, expect single-tenant / working-renter base with shorter leases.
- Market conditions: 40 active listings in the ZIP; 6 units permitted in Panola County in 2024 (0 in 5+ unit buildings).
Forward outlook
- In year one you build about $2k of equity ($345 loan paydown + $1k appreciation (3.0% local appreciation)).
- Panola County population projected at -14% by 2050 — secular population decline; favor cash flow + early exit over multi-decade hold.
- At projected returns (3.0% appreciation + 3.0% rent growth), your $14k cash investment doubles in ~2 years — after that, you're playing with house money.
Negotiation context
- It's been on market 54 days — a 3% lower offer ($48k) is reasonable based on typical stale-listing flexibility.
Risks & watch-outs
- Climate carrying-cost: major wind risk, 76% chance of damaging wind over 30y; extreme-heat days projected 7→23/yr by 2055 (HVAC capex compounding) — expect insurance premiums to compound above CPI over the hold.
Questions for the listing agent
- It's been on market 54 days. Have you received any prior offers? Is the seller open to a 3% concession, seller financing, or rate buy-down credit?
- Have any recent inspections been done? Can we get a copy of the seller's disclosures and any deferred-maintenance estimates?
- Built in 1979 — when were the roof, HVAC, electrical panel, plumbing, and water heater last replaced?
- Is there a deadline driving the sale (1031 exchange, divorce, estate, relocation)? That informs how much negotiation room exists.
- Schools are D-rated, which usually means shorter tenancies and higher turnover. Who's the typical renter profile here, and what's been the actual vacancy rate?
- Crime grade is F in this area — have there been break-ins, vandalism, or insurance claims at this property in the last 3 years? What carrier currently insures it and at what premium?
- What's the average days-on-market for RENTAL listings here right now (not sales)? A rising rental-DOM trend means longer vacancies and softer asking-rent achievability than the comps imply.
- What's the recent tenant-quality profile in this submarket — average credit score on applications, eviction rate, late-payment / NSF rate, and stable-employment percentage? A property-management company in the area should have these aggregated.
- How much new for-sale + rental construction is in the pipeline within 1–3 miles? Heavy new supply typically softens prices + rents 12–24 months out; constrained supply supports both.
Investment metrics
- 1% rule
- 3.25% ✓
- Cap rate
- 28.80%
- Cash-on-cash
- 80.37%
- DSCR
- 4.58
- GRM
- 2.6
CMA / ARV
No comps found within radius.
Projected returns pro-forma
3.0% appreciation · 3.0% rent growth · sell at horizon
- IRR
- 84.8%
- Equity multiple
- 5.70×
- Total profit
- $65,632
- Equity at exit
- $22,437
- IRR
- 84.3%
- Equity multiple
- 11.75×
- Total profit
- $150,163
- Equity at exit
- $34,578
Cash invested: $13,972 (down + closing). Projections, not guarantees.
Landlord ↔ Tenant lean methodology
- Overall (STATE)
- 87 Strongly Landlord-Friendly
- State Texas
- 87 Strongly Landlord-Friendly · R+5
- County
- — inherits STATE
- City
- — inherits STATE
ZIP-level market 75639
- Active inventory
- 40
- Price-to-rent
- 2.6×
Monthly cashflow live
- Estimated rent
- $1,621 medium interval (Pro) →
- Mortgage (P&I)
- −$262
- Tax est. 1.5%
- −$62 /mo · $748/yr
- Insurance
- −$21
- HOA
- −$0
- Vacancy / Maint / Mgmt
- −$340
- Net cashflow
- $936
Break-even live
Sensitivity live
| Price | -10% $970 | -5% $953 | +0% $936 | +5% $918 | +10% $901 |
|---|---|---|---|---|---|
| Rent | -10% $808 | -5% $872 | +0% $936 | +5% $1,000 | +10% $1,064 |
| Rate | -1.0pp $961 | -0.5pp $948 | base $936 | +0.5pp $923 | +1.0pp $910 |
UW: 25.0% down · 7.5% · 30yr · 1.5% tax · 5.0% vac · 8.0% maint · 8.0% mgmt
Financing live
Cash to close
- Down payment
- $12,475
- Closing costs
- $1,497
- Reserves months
- —
- Total cash needed
- —
Loan-product check · same deal, 3 products live
Conventional
25% down · 7.5% · 30yr
- Down + closing
- —
- Monthly P&I
- —
- Monthly cashflow
- —
- DSCR
- —
- Eligible?
- —
Personal DTI + credit; lowest rate.
DSCR
20% down · 8.5% · 30yr
- Down + closing
- —
- Monthly P&I
- —
- Monthly cashflow
- —
- DSCR
- —
- Eligible?
- —
No personal income docs; deal must DSCR.
Hard money
10% down · 12.0% · 12mo
- Down + closing
- —
- Monthly P&I
- —
- Monthly cashflow
- —
- DSCR
- —
- Eligible?
- —
Short-term bridge; refi at stabilization.
Listing history 15 events
-
2026-06-18days on market $49,900 Active 54 DOM
-
2026-06-17days on market $49,900 Active 53 DOM
-
2026-06-16days on market $49,900 Active 52 DOM
-
2026-06-15days on market $49,900 Active 51 DOM
-
2026-06-13days on market $49,900 Active 49 DOM
-
2026-06-12days on market $49,900 Active 48 DOM
-
2026-06-09days on market $49,900 Active 45 DOM
-
2026-06-08days on market $49,900 Active 44 DOM
-
2026-06-08days on market $49,900 Active 43 DOM
-
2026-06-07days on market $49,900 Active 42 DOM
-
2026-06-03days on market $49,900 Active 39 DOM
-
2026-06-02days on market $49,900 Active 38 DOM
-
2026-06-01days on market $49,900 Active 37 DOM
-
2026-05-31days on market $49,900 Active 36 DOM
-
2026-04-25$49,900 Active 394-char remark
ⓘ Source: listings_history table (triggers on properties + properties_extension) + one-shot
backfill from property_details.listing_events for pre-trigger history.
Climate risk First Street
- Flood 1/10 Low 0% chance over 30 yrs
- Wildfire 4/10 Moderate
- Heat 7/10 Severe 7 d/yr ≥111°F today · 23 d/yr by 30 yrs out
- Wind 6/10 Major 76% chance of damaging wind over 30 yrs
- Air quality 2/10 Low 0 unhealthy d/yr today · 1 by 30 yrs out
Nearby sold comps map
Loading sold comps map…
Walkable amenities ~0.75 mi
Loading nearby amenities…
Taxation est. · year 1
- Rental income
- $19,452
- − Mortgage interest
- −$2,795
- − Property taxes
- −$748
- − Insurance
- −$250
- − Repairs & maintenance
- −$1,556
- − Management
- −$1,556
- − Depreciation
- −$1,452
- Taxable income
- $11,095
- Est. tax owed @ 24.0%
- −$2,663
- After-tax cash flow
- $8,566/yr
For passive investors: Depreciation is non-cash, so a rental often shows a tax loss while cash-flowing — sheltering income. Rental losses are passive: they offset passive income freely, and up to $25,000/yr can offset ordinary (W-2) income if you actively participate and your MAGI is under $100k (phasing out to $0 by $150k); unused losses carry forward. On sale, claimed depreciation is recaptured at up to 25%, and gains may owe capital-gains tax (a 1031 exchange can defer both). Figures are a year-1 estimate at your 24.0% rate — not tax advice; consult a CPA.
Condition & rehab AI · 4 photos
This property requires significant repairs and maintenance, including a major roof replacement and exterior siding repair. Landscaping and lawn maintenance are also needed to improve curb appeal and property value.
Repairs flagged
- Major roof — Significant damage with missing shingles
- Major exterior siding — Weathered and peeling
- Major landscaping — Overgrown vegetation and unkempt lawn
Value-add opportunities
- Both repair and replace roof — Critical safety and structural issue
- Both repair and paint exterior siding — Improves curb appeal and property value
- Both landscaping and lawn maintenance — Enhances curb appeal and property value
Renovation cost estimate screening
| Repair item | Severity | Est. cost |
|---|---|---|
| roof · Significant damage with missing shingles | Major | $15,000–50,000 |
| exterior siding · Weathered and peeling | Major | $15,000–50,000 |
| landscaping · Overgrown vegetation and unkempt lawn | Major | $15,000–50,000 |
| Total estimated repair cost · 3 items | $45,000–150,000 |
Value-add ROI direction
- Both repair and replace roof — Critical safety and structural issue ↑
- Both repair and paint exterior siding — Improves curb appeal and property value ↑
- Both landscaping and lawn maintenance — Enhances curb appeal and property value ↑
ⓘ Cost ranges are severity-bucket heuristics (US national rule-of-thumb). Get contractor quotes + a written scope before underwriting a rehab budget.
Schools (NCES district)
- District
- Carthage ISD
- NCES district ID
- 4813110
- Math proficiency
- 41% ▼ -3.00%
- Reading proficiency
- 41% ▼ -3.00%
- Median HH income
- $48,546
- Composite
- 35.19/100
- National rank
- #4997
- State rank
- #364 of 826 in TX
Livability — Carthage
- Score
- 72/100
- State rank
- #258
- US rank
- #6081
Category grades
Schools grade is shown separately in the Schools card above.
Census & demographics
- Population (ZIP)
- 2,698
Population outlook (Panola County) Hauer SSP2
- Today (2025)
- 23,273 people
- By 2030
- 22,845 · -1.8%
- By 2040
- 21,652 · -7.0%
- By 2050
- 20,107 · -13.6%
- By 2075
- 15,709 · -32.5%
- By 2100
- 11,013 · -52.7%
Race, ethnicity, and origin ACS 2023
- Neighborhood character
- Predominantly White (71%)
- Race & ethnicity
- White 71% Black 21% Two or more races 6% Hispanic / Latino 3%
- Common ancestry
- Lithuanian 7% Italian 3% Slovak 2%
- Foreign-born
- 2% · Canada
- Languages at home
- 94% English-only · Spanish 6%
Political lean MEDSL · Panola
- 2024 margin
- Solid R (+66.4) · D 16.7% · R 83.1%
- 2008→2024 swing
- -17.5pp toward R · 2008: -48.9pp · 2024: -66.4pp
- All cycles
- 2024: R+66.4 2020: R+63.5 2016: R+63.5 2012: R+56.1 2008: R+48.9
Not yet ingested
- Civics
- —
Market trends
- HPI YoY
- —
- Current HPI
- —
- Rent YoY
- —
- Metro
- —
- State GDP YoY
- ▲ 3.95%
- F500 in state
- 110
Industry mix (Fortune 500 HQ in TX)
| Industry | F500 HQs | Revenue |
|---|---|---|
| Energy | 16 | $1,198B |
|
||
| Technology | 5 | $198B |
|
||
| Engineering / Construction | 4 | $72B |
|
||
| Energy Services | 3 | $60B |
|
||
| Utilities | 3 | $41B |
|
||
| Healthcare | 2 | $330B |
|
||
Price history
1 event — show timeline
- 2026-04-25 Listed $49,900 LAAR
Cash-flow waterfall
monthlySold comps — $/sqft
last 12 mo · ≤1 miLoading sold comps…