4146 Tamarak Dr · San Antonio, TX
Flood risk 1/10 · Minimal
- FEMA flood zone
- X (unshaded)
- Chance of flooding over 30 yrs
- 0.0%
- Est. flood insurance / yr
- $507 – $1,088
Fire risk 2/10 · Minimal
- Est. fire insurance / yr
- $1,222 – $2,270
Heat risk 8/10 · Major
- Hot days now (above 108°F)
- 7 days/yr
- Hot days in 30 yrs
- 22 days/yr
Wind risk 8/10 · Major
- Chance of severe wind over 30 yrs
- 80.0%
Air-quality risk 2/10 · Minimal
- Unhealthy air days now
- 0 days/yr
- Unhealthy air days in 30 yrs
- 2 days/yr
Risk factors via First Street. Map © Google.
Why this score? — see what drove the B- grade
The composite is a weighted blend of 9 inputs, each scored 0–100. Each bar is that input's sub-score; the figure is the points it added to the 100-point composite (weight × sub-score).
- Cash flow +21.3/30.0
- ARV discount +15.0/15.0
- Appreciation +10.0/10.0
- DSCR +6.8/10.0
- 1% rule +5.0/10.0
- Livability +4.0/5.0
- Rent growth +2.6/5.0
- Condition / age +2.5/5.0
- Schools +1.4/10.0
$133,999
🖨 Deal sheet 📄 Offer letter ✓ Due diligence
Listing remarks MLS
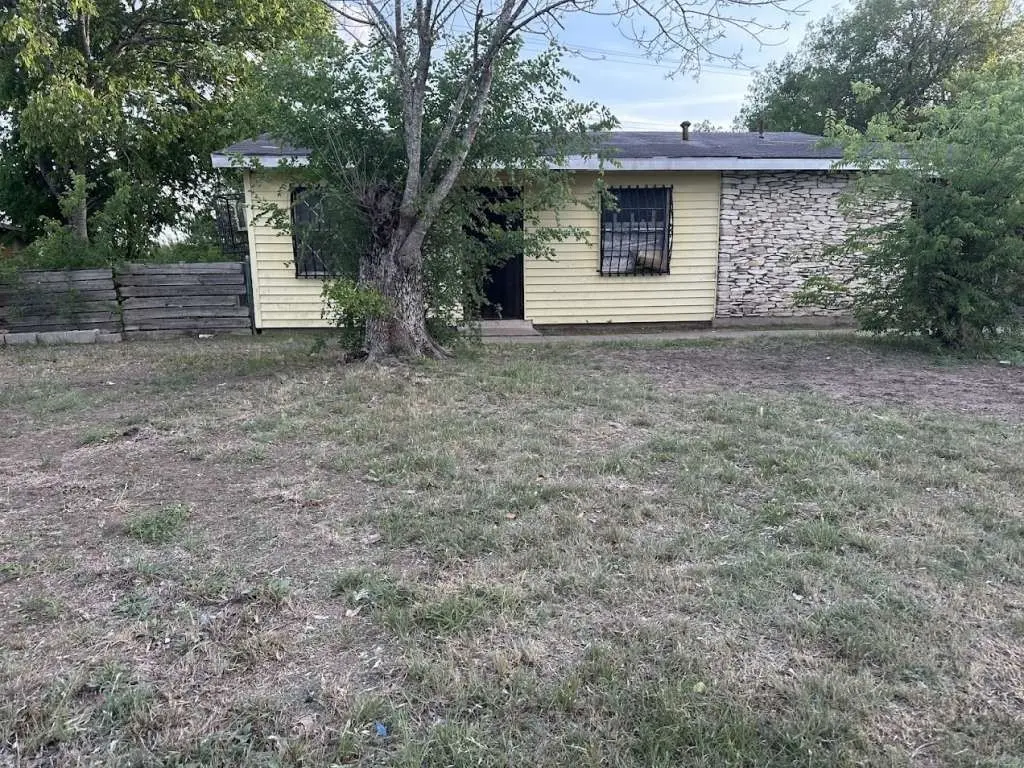
NEAR I-10! Charming home in the San Antonio area! Located near I-10 and Eastwood Village. Martin Luther King Park is located behind the home, there is an H-E-B just down the street, gas stations and a Starbucks a short trip away! This home is being sold AS IS but it has lots of potential. WE MAKE IT EASY TO OWN. This is a great opportunity! Don't wait, call us today to get more information on the owner's easy terms and smooth process that may be able to put the deed in your name and make this your dream home.
Key facts
- Near i-10
- Starbucks nearby
- H-e-b nearby
Tags
Neighborhood map
What this means for you Summary
Snapshot
- This is a 3-bed/1.0-bath single-family listed at $134k.
Deal economics
- At list price, monthly cash flow is $197 ($2k/yr) — positive.
- The deal already cash-flows at list — no discount required.
- To meet the 1% rule (rent ≥ 1% of price), the offer needs to be $134k (0.2% below list).
- Recommended offer: $118k (12.0% below list) — sets the bar for market timing.
- Cap rate 8.1% vs local median 3.8% in San Antonio — top-decile yield for the area; either an underpriced asset or a hidden risk that comps aren't pricing in. Stress-test before assuming the spread holds.
Location & tenants
- Location reads 80/100 on livability (#31 in TX, #1,616 nationally) — a professional / high-income tenant draw. Strengths: amenities A+, commute A+, cost of living A+; Watch: schools C-, crime F.
- San Antonio ISD (urban): math 12% / reading 22% proficiency, ranked #805 of 826 in TX (top 98%) — low school quality limits family demand, transient renter base, plan for 1-2y turnover; 80% free/reduced lunch — lower-income household profile, screen leases tightly.
- Market conditions: Rents flat; 113 active listings in the ZIP; 33 comparable units currently listed for rent nearby; rentals at typical pace (median 24d on market — plan ~3-4 weeks tenant-placement turnaround); lower-income renter base — watch delinquency; 8,308 units permitted in Bexar County in 2024 (2,506 in 5+ unit buildings).
- This rent runs 38% of the median local income ($42k/yr) — at the standard rent-burdened threshold; future hikes will face affordability resistance.
Forward outlook
- In year one you build about $14k of equity ($926 loan paydown + $13k appreciation (10.0% local appreciation)).
- Bexar County population projected at +50% by 2050 — long-run rental-demand tailwind backs the buy-and-hold thesis.
- At projected returns (10.0% appreciation + 0.5% rent growth), your $38k cash investment doubles in ~3 years — after that, you're playing with house money.
- By year 3, paydown + projected appreciation supports a ~$36k cash-out refi (75% LTV) — recoverable capital for the next deal without selling this one.
Negotiation context
- It's been on market 428 days — a 12% lower offer ($118k) is reasonable based on typical stale-listing flexibility.
Risks & watch-outs
- Climate carrying-cost: severe wind risk, 80% chance of damaging wind over 30y; extreme-heat days projected 7→22/yr by 2055 (HVAC capex compounding) — expect insurance premiums to compound above CPI over the hold.
Questions for the listing agent
- It's been on market 428 days. Have you received any prior offers? Is the seller open to a 12% concession, seller financing, or rate buy-down credit?
- Built in 1963 — when were the roof, HVAC, electrical panel, plumbing, and water heater last replaced?
- Why hasn't it sold? Are there any deal-killer items the seller is aware of (foundation, flood, title, zoning, code violations)?
- Is there a deadline driving the sale (1031 exchange, divorce, estate, relocation)? That informs how much negotiation room exists.
- Crime grade is F in this area — have there been break-ins, vandalism, or insurance claims at this property in the last 3 years? What carrier currently insures it and at what premium?
- What's the average days-on-market for RENTAL listings here right now (not sales)? A rising rental-DOM trend means longer vacancies and softer asking-rent achievability than the comps imply.
- What's the recent tenant-quality profile in this submarket — average credit score on applications, eviction rate, late-payment / NSF rate, and stable-employment percentage? A property-management company in the area should have these aggregated.
- How much new for-sale + rental construction is in the pipeline within 1–3 miles? Heavy new supply typically softens prices + rents 12–24 months out; constrained supply supports both.
Investment metrics
- 1% rule
- 1.00% ✗
- Cap rate
- 8.05%
- Cash-on-cash
- 6.29%
- DSCR
- 1.28
- GRM
- 8.3
CMA / ARV
- ARV (median comp)
- $160,717
- List price
- $133,999
- Delta
- -16.62%
- Verdict
- UNDERPRICED
- Comps
- 20 within 1.0 mi
Show comp detail 12 sales within ~0.75 mi
| Address | Dist | Beds/Ba | Sqft | Sold | Price | $/sf | Match |
|---|---|---|---|---|---|---|---|
| 373 Kenmar Dr | 0.11mi | 3/1.0 | 984 (+3%) | 2mo | $189,500 | $193 | 88 |
| 127 Zerrcliff Ln | 0.38mi | 4/1.0 (+1) | 984 (+3%) | 1mo | $159,000 | $162 | 71 |
| 4247 Roark | 0.31mi | 3/1.0 | 875 (-8%) | 4mo | $95,500 | $109 | 69 |
| 261 Shelburn | 0.43mi | 3/1.0 | 935 (-2%) | 10mo | $130,000 | $139 | 69 |
| 4243 Kilrea Dr | 0.38mi | 2/1.0 (-1) | 936 (-2%) | 8mo | $140,000 | $150 | 67 |
| 345 Shelburn | 0.29mi | 2/1.0 (-1) | 1,032 (+8%) | 2mo | $150,000 | $145 | 65 |
| 4338 Kilrea | 0.50mi | 3/1.0 | 912 (-4%) | 6mo | $139,900 | $153 | 65 |
| 4518 Charles Williams | 0.70mi | 3/1.0 | 968 (+2%) | 2mo | $129,500 | $134 | 63 |
| 642 Ferris Ave | 0.68mi | 3/2.0 | 960 (+1%) | 7mo | $142,000 | $148 | 57 |
| 4319 Algruth Dr | 0.58mi | 3/2.0 | 1,021 (+7%) | 3mo | $183,000 | $179 | 55 |
| 234 Charcliff Dr | 0.53mi | 3/1.0 | 1,080 (+13%) | 8mo | $136,000 | $126 | 46 |
| 647 Ferris Ave | 0.66mi | 2/1.0 (-1) | 880 (-8%) | 10mo | $80,000 | $91 | 44 |
Match score weights: distance 35% · size 25% · config 20% · recency 20%. Top-matched comps best support the ARV.
Projected returns pro-forma
10.0% appreciation · 0.53% rent growth · sell at horizon
- IRR
- 27.9%
- Equity multiple
- 3.19×
- Total profit
- $82,242
- Equity at exit
- $120,717
- IRR
- 23.7%
- Equity multiple
- 7.03×
- Total profit
- $226,354
- Equity at exit
- $260,331
Cash invested: $37,520 (down + closing). Projections, not guarantees.
Landlord ↔ Tenant lean methodology
- Overall (STATE)
- 87 Strongly Landlord-Friendly
- State Texas
- 87 Strongly Landlord-Friendly · R+5
- County
- — inherits STATE
- City
- — inherits STATE
ZIP-level market 78220
- Home prices YoY
- 9.1%
- Rents YoY
- 0.5%
- Active inventory
- 113
- Price-to-rent
- 8.3×
Monthly cashflow live
- Estimated rent
- $1,338 high interval (Pro) →
- Mortgage (P&I)
- −$703
- Tax from tax record
- −$102 /mo · $1,220/yr
- Insurance
- −$56
- HOA
- −$0
- Vacancy / Maint / Mgmt
- −$281
- Net cashflow
- $197
Break-even live
UW: 25.0% down · 7.5% · 30yr · 1.5% tax · 5.0% vac · 8.0% maint · 8.0% mgmt
Financing live
Cash to close
- Down payment
- $33,500
- Closing costs
- $4,020
- Reserves months
- —
- Total cash needed
- —
Loan-product check · same deal, 3 products live
Conventional
25% down · 7.5% · 30yr
- Down + closing
- —
- Monthly P&I
- —
- Monthly cashflow
- —
- DSCR
- —
- Eligible?
- —
Personal DTI + credit; lowest rate.
DSCR
20% down · 8.5% · 30yr
- Down + closing
- —
- Monthly P&I
- —
- Monthly cashflow
- —
- DSCR
- —
- Eligible?
- —
No personal income docs; deal must DSCR.
Hard money
10% down · 12.0% · 12mo
- Down + closing
- —
- Monthly P&I
- —
- Monthly cashflow
- —
- DSCR
- —
- Eligible?
- —
Short-term bridge; refi at stabilization.
Rent comps 33 comps
| Address | Beds | Baths | Sqft | Rent | $/sqft | DOM | Units | Dist |
|---|---|---|---|---|---|---|---|---|
| 368 Readwell Dr San Antonio, TX | 3.0 | 1.0 | 1067 | $1,200 | $1.12 | 43d | 1 | 0.18mi |
| 231 Noblewood Dr San Antonio, TX | 1.0–4.0 | 1.0–2.0 | 1084 | $1,387 | $1.28 | 23d | 1 | 0.22mi |
| 334 Tomrob Dr San Antonio, TX | 3.0 | 1.0 | 1064 | $1,300 | $1.22 | 14d | 1 | 0.27mi |
| 302 Kenmar Dr San Antonio, TX | 3.0 | 1.0 | 970 | $1,375 | $1.42 | 23d | 1 | 0.32mi |
| 3815 E Commerce St San Antonio, TX | 3.0 | 1.0–2.0 | 872 | $1,530 | $1.75 | 3d | 60 | 0.50mi |
| 4319 Algruth Dr San Antonio, TX | 3.0 | 2.0 | 1021 | $1,800 | $1.76 | 23d | 1 | 0.56mi |
| 738 Sterling St San Antonio, TX | 4.0 | 1.0 | 1038 | $1,095 | $1.05 | 4d | 1 | 0.73mi |
| 547 Dorie St San Antonio, TX | 3.0 | 2.0 | 909 | $1,135 | $1.25 | 21d | 1 | 0.74mi |
| 4606 Hollyspring Dr San Antonio, TX | 3.0 | 2.0 | 1098 | $1,400 | $1.28 | 23d | 1 | 0.77mi |
| 1311 W Hein Rd Unit 4 San Antonio, TX | 2.0 | 2.0 | 1000 | $1,000 | $1.00 | 43d | 1 | 0.77mi |
| 1311 W Hein Rd Unit 18 San Antonio, TX | 2.0 | 1.5 | 900 | $895 | $0.99 | 43d | 1 | 0.77mi |
| 902 Gembler Rd San Antonio, TX | 1.0–3.0 | 1.0–2.0 | 966 | $1,795 | $1.86 | 1d | 21 | 0.78mi |
| 3327 Martin Luther King Dr Unit a San Antonio, TX | 3.0 | 2.0 | 876 | $915 | $1.04 | 2d | 1 | 0.82mi |
| 3318 Martin Luther King Dr San Antonio, TX | 3.0 | 2.0 | 909 | $975 | $1.07 | 43d | 1 | 0.86mi |
| 4426 N Hein Rd Apt 2204 San Antonio, TX | 2.0 | 1.0 | 723 | $1,250 | $1.73 | 43d | 1 | 0.88mi |
| 458 Ferris Ave San Antonio, TX | 3.0 | 2.0 | 909 | $1,380 | $1.52 | 2d | 1 | 0.90mi |
| 4438 N Hein Rd Unit 104 San Antonio, TX | 2.0 | 1.0 | 632 | $1,150 | $1.82 | 43d | 1 | 0.90mi |
| 3259 Martin Luther King Dr San Antonio, TX | 3.0 | 2.0 | 909 | $1,149 | $1.26 | 4d | 1 | 0.92mi |
| 4251 Wild Oak Dr San Antonio, TX | 4.0 | 1.0 | 1117 | $1,250 | $1.12 | 43d | 1 | 0.97mi |
| 915 Creekview San Antonio, TX | 2.0 | 2.0 | 950 | $1,230 | $1.29 | 23d | 1 | 0.99mi |
| 515 Lincolnshire Dr San Antonio, TX | 2.0 | 1.0 | 681 | $885 | $1.30 | 4d | 1 | 1.04mi |
| 302 Dorie St San Antonio, TX | 3.0 | 2.0 | 1028 | $1,285 | $1.25 | 21d | 1 | 1.04mi |
| 535 Gembler Rd Unit 710 San Antonio, TX | 2.0 | 2.0 | 1031 | $1,081 | $1.05 | 3d | 1 | 1.07mi |
| 4835 Lord Rd Unit 710 San Antonio, TX | 2.0 | 2.0 | 949 | $874 | $0.92 | 3d | 1 | 1.10mi |
| 455 Lincolnshire Dr San Antonio, TX | 2.0 | 1.0 | 768 | $925 | $1.20 | 20d | 1 | 1.14mi |
| 311 Ferris Ave San Antonio, TX | 3.0 | 2.0 | 909 | $1,245 | $1.37 | 4d | 1 | 1.15mi |
| 380 Sterling St Unit 1 San Antonio, TX | 2.0 | 1.0 | 642 | $550 | $0.86 | 23d | 1 | 1.25mi |
| 239 Ferris Ave San Antonio, TX | 3.0 | 2.0 | 909 | $1,249 | $1.37 | 43d | 1 | 1.27mi |
| 3030 Martin Luther King Dr San Antonio, TX | 3.0 | 1.0 | 938 | $1,295 | $1.38 | 23d | 1 | 1.33mi |
| 817 Cresthill Rd San Antonio, TX | 3.0 | 1.0 | 950 | $1,300 | $1.37 | 43d | 1 | 1.35mi |
| 215 Edna Ave San Antonio, TX | 2.0 | 1.0 | 968 | $1,260 | $1.30 | 43d | 1 | 1.37mi |
| 707 SE Loop 410 San Antonio, TX | 1.0–4.0 | 1.0–2.0 | 1139 | $1,216 | $1.07 | 4d | 1 | 1.43mi |
| 311 Spriggsdale Ave Unit 710 San Antonio, TX | 2.0 | 2.0 | 890 | $981 | $1.10 | 3d | 1 | 1.49mi |
Listing history 15 events
-
2026-06-18days on market $133,999 Active 428 DOM
-
2026-06-17days on market $133,999 Active 427 DOM
-
2026-06-16days on market $133,999 Active 426 DOM
-
2026-06-15days on market $133,999 Active 425 DOM
-
2026-06-13days on market $133,999 Active 423 DOM
-
2026-06-09days on market $133,999 Active 419 DOM
-
2026-06-08days on market $133,999 Active 418 DOM
-
2026-06-07days on market $133,999 Active 417 DOM
-
2026-06-04days on market $133,999 Active 414 DOM
-
2026-06-03days on market $133,999 Active 413 DOM
-
2026-06-02days on market $133,999 Active 412 DOM
-
2026-06-01days on market $133,999 Active 411 DOM
-
2026-05-31days on market $133,999 Active 410 DOM
-
2026-02-19price $133,999 514-char remark
Show marketing remark (514 chars)
NEAR I-10! Charming home in the San Antonio area! Located near I-10 and Eastwood Village. Martin Luther King Park is located behind the home, there is an H-E-B just down the street, gas stations and a Starbucks a short trip away! This home is being sold AS IS but it has lots of potential. WE MAKE IT EASY TO OWN. This is a great opportunity! Don't wait, call us today to get more information on the owner's easy terms and smooth process that may be able to put the deed in your name and make this your dream home.
-
2025-04-16$129,999 Active 514-char remark
Show marketing remark (514 chars)
NEAR I-10! Charming home in the San Antonio area! Located near I-10 and Eastwood Village. Martin Luther King Park is located behind the home, there is an H-E-B just down the street, gas stations and a Starbucks a short trip away! This home is being sold AS IS but it has lots of potential. WE MAKE IT EASY TO OWN. This is a great opportunity! Don't wait, call us today to get more information on the owner's easy terms and smooth process that may be able to put the deed in your name and make this your dream home.
ⓘ Source: listings_history table (triggers on properties + properties_extension) + one-shot
backfill from property_details.listing_events for pre-trigger history.
Tax reassessment forecast TX · Resets to sale price
- Current annual tax
- $1,220 · $102/mo
- Projected year-2 tax
- $2,452 · $204/mo
- Expected delta
- +$1,232/yr (+$103/mo · 101.0%)
ⓘ Screening estimate from a state-policy table — verify with the county assessor before closing.
Climate risk First Street
- Flood 1/10 Low FEMA zone X (unshaded) · 0% chance over 30 yrs
- Wildfire 2/10 Low
- Heat 8/10 Severe 7 d/yr ≥108°F today · 22 d/yr by 30 yrs out
- Wind 8/10 Severe 80% chance of damaging wind over 30 yrs
- Air quality 2/10 Low 0 unhealthy d/yr today · 2 by 30 yrs out
Nearby sold comps map
Loading sold comps map…
Walkable amenities ~0.75 mi
Loading nearby amenities…
Taxation est. · year 1
- Rental income
- $16,054
- − Mortgage interest
- −$7,506
- − Property taxes
- −$1,220
- − Insurance
- −$670
- − Repairs & maintenance
- −$1,284
- − Management
- −$1,284
- − Depreciation
- −$3,898
- Taxable income
- $191
- Est. tax owed @ 24.0%
- −$46
- After-tax cash flow
- $2,314/yr
For passive investors: Depreciation is non-cash, so a rental often shows a tax loss while cash-flowing — sheltering income. Rental losses are passive: they offset passive income freely, and up to $25,000/yr can offset ordinary (W-2) income if you actively participate and your MAGI is under $100k (phasing out to $0 by $150k); unused losses carry forward. On sale, claimed depreciation is recaptured at up to 25%, and gains may owe capital-gains tax (a 1031 exchange can defer both). Figures are a year-1 estimate at your 24.0% rate — not tax advice; consult a CPA.
Schools (NCES district)
- District
- San Antonio ISD
- NCES district ID
- 4838730
- Math proficiency
- 12% ▼ -21.00%
- Reading proficiency
- 22% ▼ -7.00%
- Median HH income
- $30,952
- Composite
- 13.57/100
- National rank
- #9512
- State rank
- #805 of 826 in TX
Livability — San Antonio
- Score
- 80/100
- State rank
- #31
- US rank
- #1616
Category grades
Schools grade is shown separately in the Schools card above.
Census & demographics
- Census place
- San Antonio, TX
- County
- Bexar County · 1,990,555 people
- City population
- 1,806,925
- Metro
- San Antonio-New Braunfels, TX
- Population (ZIP)
- 19,423
- Household income
- $41,710
- Rent vs Own
- Severe rent burden
- 705.0
Population outlook (Bexar County) Hauer SSP2
- Today (2025)
- 2,336,851 people
- By 2030
- 2,560,728 · +9.6%
- By 2040
- 3,020,569 · +29.3%
- By 2050
- 3,493,522 · +49.5%
- By 2075
- 4,668,459 · +99.8%
- By 2100
- 5,533,242 · +136.8%
Race, ethnicity, and origin ACS 2023
- Neighborhood character
- Majority Hispanic (60%)
- Race & ethnicity
- Hispanic / Latino 60% Black 30% Two or more races 22% White 8%
- Hispanic origin (detail)
- Mexican 47% Puerto Rican 1%
- Foreign-born
- 11% · Canada
- Languages at home
- 63% English-only · Spanish 36%
Political lean MEDSL · Bexar
- 2024 margin
- Lean D (+9.8) · D 54.3% · R 44.6% · Other 1.1%
- 2008→2024 swing
- +4.2pp toward D · 2008: 5.6pp · 2024: 9.8pp
- All cycles
- 2024: D+9.8 2020: D+18.2 2016: D+13.5 2012: D+4.6 2008: D+5.6
Not yet ingested
- Civics
- —
Market trends
- HPI YoY
- ▲ 23.86%
- Current HPI
- 284.9844
- Rent YoY
- ▲ 0.53%
- Metro
- San Antonio-New Braunfels, TX
- State GDP YoY
- ▲ 3.95%
- F500 in state
- 110
Industry mix (Fortune 500 HQ in TX)
| Industry | F500 HQs | Revenue |
|---|---|---|
| Energy | 16 | $1,198B |
|
||
| Technology | 5 | $198B |
|
||
| Engineering / Construction | 4 | $72B |
|
||
| Energy Services | 3 | $60B |
|
||
| Utilities | 3 | $41B |
|
||
| Healthcare | 2 | $330B |
|
||
Price history
+3.1% since first listed2 events — show timeline
- 2026-02-19 Price Changed $133,999 HARMLS
- 2025-04-16 Listed $129,999 HARMLS
Property tax history
-0.5%/yrLatest (2025): $1,220 · -62.6% YoY. Source: county tax records.
Cash-flow waterfall
monthlySold comps — $/sqft
last 12 mo · ≤1 miLoading sold comps…