2 Cross St · Shelburne Falls, MA
Flood risk 7/10 · Major
- FEMA flood zone
- X
- Chance of flooding over 30 yrs
- 0.76%
- Est. flood insurance / yr
- $473 – $860
Fire risk 1/10 · Minimal
- Est. fire insurance / yr
- $915 – $1,699
Heat risk 3/10 · Minor
- Hot days now (above 90°F)
- 8 days/yr
- Hot days in 30 yrs
- 19 days/yr
Wind risk 4/10 · Minor
- Chance of severe wind over 30 yrs
- 12.0%
Air-quality risk 2/10 · Minimal
- Unhealthy air days now
- 0 days/yr
- Unhealthy air days in 30 yrs
- 1 days/yr
Risk factors via First Street. Map © Google.
Why this score? — see what drove the C+ grade
The composite is a weighted blend of 9 inputs, each scored 0–100. Each bar is that input's sub-score; the figure is the points it added to the 100-point composite (weight × sub-score).
- Cash flow +22.5/30.0
- 1% rule +7.6/10.0
- ARV discount +7.5/15.0
- Appreciation +7.5/10.0
- DSCR +7.2/10.0
- Livability +3.7/5.0
- Schools +3.1/10.0
- Rent growth +2.5/5.0
- Condition / age +2.5/5.0
$150,000
🖨 Deal sheet (PDF) 📄 Offer letter ✓ Due diligence
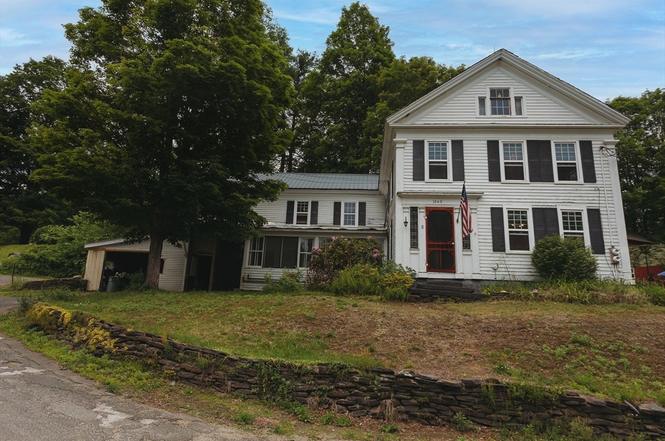
Listing remarks
Bring your vision and creativity to this rustic farmhouse. Built with the craftsmanship and character, this home offers an opportunity to restore and customize a classic property to suit your needs and style. An ideal project for investors, contractors, or anyone looking to create their dream country home. Nestled in the scenic hills of Upper Buckland, the property enjoys a peaceful rural setting while remaining conveniently close to the vibrant village of Shelburne Falls, with its charming shops, restaurants, and local attractions. Outdoor enthusiasts will appreciate the proximity to Berkshire East Mountain Resort, the Deerfield River, hiking trails, and countless year-round recreational o
Key facts
- Scenic hills
- Deerfield river
- Hiking trails
Tags
Property features AI
Finance
- Other: Property area reported as 2,492 (above grade finished area); Lot size approximately 1.8 acres
- HOA & community: Not a senior community
Exterior
- Parking: Attached 1-car garage; 1 covered parking space; 2 open/off-street parking spaces (3 total)
- Utilities: Private water; Private sewer; Electric with circuit breakers
- Home design: Single family residence; White exterior
- Construction: Built approximately (year source: appraiser); Stone foundation; Slate and metal roof
- Exterior features: Corner lot; Enclosed porch; Exterior storage
Interior
- Flooring: Wood floors
- Bathrooms: 2 full bathrooms
- Heating & cooling: Has heating (type listed as Other)
- Interior features: Total of 10 rooms; Partial basement with crawl space, walk-out access and dirt floor; Enclosed porch; Storage
Neighborhood map
What this means for you Summary
Snapshot
- This is a 4-bed/2.0-bath single-family listed at $150k.
Deal economics
- At list price, monthly cash flow is $196 ($2k/yr) — positive.
- The deal already cash-flows at list — no discount required.
- Meets the 1% rule at list price ($2k rent vs $150k).
- Cap rate 8.3% vs local median 1.9% in Shelburne Falls — top-decile yield for the area; either an underpriced asset or a hidden risk that comps aren't pricing in. Stress-test before assuming the spread holds.
Location & tenants
- Location reads 73/100 on livability (#96 in MA) — a middle-class / working-renter tenant base. Strengths: crime A+, health & safety A+, commute B; Watch: amenities F, employment F.
- Mohawk Trail (rural): math 25% / reading 45% proficiency, ranked #235 of 302 in MA (top 78%) — families likely to look elsewhere, expect single-tenant / working-renter base with shorter leases.
- Zoned schools: Mohawk Trail Regional School (math 22% / reading 42%, grade F, #255 of 343 statewide, top 77%, 271 students, 0% FRL) — zoned schools average 0% FRL vs 29% district-wide (29 pts lower); this property's tenant base skews higher-income than the district average.
- Market conditions: 3 active listings in the ZIP; 89 units permitted in Franklin County in 2024 (22 in 5+ unit buildings).
Forward outlook
- In year one you build about $9k of equity ($1k loan paydown + $8k appreciation (5.0% local appreciation)).
- Franklin County population projected at -20% by 2050 — secular population decline; favor cash flow + early exit over multi-decade hold.
- At projected returns (5.0% appreciation + 3.0% rent growth), your $42k cash investment doubles in ~4 years — after that, you're playing with house money.
- By year 5, paydown + projected appreciation supports a ~$37k cash-out refi (75% LTV) — recoverable capital for the next deal without selling this one.
Negotiation context
- Only 11 days on market — expect competitive offers; lowballing is unlikely to land.
Risks & watch-outs
- Watch-outs: property tax is 3.2% of price; flood insurance adds $56/mo; built in 1840 — expect roof / HVAC / electrical / plumbing capex.
- Climate carrying-cost: major flood risk — expect insurance premiums to compound above CPI over the hold.
Questions for the listing agent
- Built in 1840 — when were the roof, HVAC, electrical panel, plumbing, and water heater last replaced?
- Property tax is high relative to price — has the assessment been appealed recently, and will the sale trigger a re-assessment?
- What's the actual annual flood-insurance premium (NFIP or private), and is the property in a SFHA with mandatory coverage?
- Is there a deadline driving the sale (1031 exchange, divorce, estate, relocation)? That informs how much negotiation room exists.
- Schools are D-rated, which usually means shorter tenancies and higher turnover. Who's the typical renter profile here, and what's been the actual vacancy rate?
- What's the average days-on-market for RENTAL listings here right now (not sales)? A rising rental-DOM trend means longer vacancies and softer asking-rent achievability than the comps imply.
- What's the recent tenant-quality profile in this submarket — average credit score on applications, eviction rate, late-payment / NSF rate, and stable-employment percentage? A property-management company in the area should have these aggregated.
- How much new for-sale + rental construction is in the pipeline within 1–3 miles? Heavy new supply typically softens prices + rents 12–24 months out; constrained supply supports both.
Investment metrics
- 1% rule
- 1.26% ✓
- Cap rate
- 8.31%
- Cash-on-cash
- 7.20%
- DSCR
- 1.32
- GRM
- 6.6
CMA / ARV
No comps found within radius.
Projected returns pro-forma
5.05% appreciation · 3.0% rent growth · sell at horizon
- IRR
- 17.8%
- Equity multiple
- 2.13×
- Total profit
- $47,670
- Equity at exit
- $85,422
- IRR
- 18.0%
- Equity multiple
- 4.18×
- Total profit
- $133,500
- Equity at exit
- $147,774
Cash invested: $42,000 (down + closing). Projections, not guarantees.
Landlord ↔ Tenant lean methodology
- Overall (STATE)
- 20 Strongly Tenant-Friendly
- State Massachusetts
- 20 Strongly Tenant-Friendly · D+15
- County
- — inherits STATE
- City
- — inherits STATE
ZIP-level market 01338
- Home prices YoY
- 2.3%
- Active inventory
- 3
- Price-to-rent
- 6.6×
Monthly cashflow live
- Estimated rent
- $1,895 medium interval (Pro) →
- Mortgage (P&I)
- −$787
- Tax from tax record
- −$396 /mo · $4,755/yr
- Insurance
- −$62
- Flood insurance flood zone
- −$56 /mo · $666/yr
- HOA
- −$0
- Vacancy / Maint / Mgmt
- −$398
- Net cashflow
- $196
Break-even live
Sensitivity live
| Price | -10% $281 | -5% $239 | +0% $196 | +5% $154 | +10% $112 |
|---|---|---|---|---|---|
| Rent | -10% $47 | -5% $122 | +0% $196 | +5% $271 | +10% $346 |
| Rate | -1.0pp $272 | -0.5pp $235 | base $196 | +0.5pp $158 | +1.0pp $118 |
UW: 25.0% down · 7.5% · 30yr · 1.5% tax · 5.0% vac · 8.0% maint · 8.0% mgmt
Financing live
Cash to close
- Down payment
- $37,500
- Closing costs
- $4,500
- Reserves months
- —
- Total cash needed
- —
Loan-product check · same deal, 3 products live
Conventional
25% down · 7.5% · 30yr
- Down + closing
- —
- Monthly P&I
- —
- Monthly cashflow
- —
- DSCR
- —
- Eligible?
- —
Personal DTI + credit; lowest rate.
DSCR
20% down · 8.5% · 30yr
- Down + closing
- —
- Monthly P&I
- —
- Monthly cashflow
- —
- DSCR
- —
- Eligible?
- —
No personal income docs; deal must DSCR.
Hard money
10% down · 12.0% · 12mo
- Down + closing
- —
- Monthly P&I
- —
- Monthly cashflow
- —
- DSCR
- —
- Eligible?
- —
Short-term bridge; refi at stabilization.
Listing history 7 events
-
2026-06-21days on market $150,000 Active 11 DOM
-
2026-06-18days on market $150,000 Active 8 DOM
-
2026-06-17days on market $150,000 Active 7 DOM
-
2026-06-16days on market $150,000 Active 6 DOM
-
2026-06-15statusdays on market $150,000 Active 5 DOM
-
2026-06-14remarks 699-char remark
-
2026-06-14$150,000 New 3 DOM
ⓘ Source: listings_history table (triggers on properties + properties_extension) + one-shot
backfill from property_details.listing_events for pre-trigger history.
Tax reassessment forecast MA · Partial reset (capped growth)
- Current annual tax
- $4,755 · $396/mo
- Projected year-2 tax
- $4,755 · $396/mo
- Expected delta
- $0/yr ($0/mo · 0.0%)
ⓘ Screening estimate from a state-policy table — verify with the county assessor before closing.
Climate risk First Street
- Flood 7/10 Severe FEMA zone X · 76% chance over 30 yrs
- Wildfire 1/10 Low
- Heat 3/10 Moderate 8 d/yr ≥90°F today · 19 d/yr by 30 yrs out
- Wind 4/10 Moderate 12% chance of damaging wind over 30 yrs
- Air quality 2/10 Low 0 unhealthy d/yr today · 1 by 30 yrs out
Nearby sold comps map
Loading sold comps map…
Walkable amenities ~0.75 mi
Loading nearby amenities…
Taxation est. · year 1
- Rental income
- $22,745
- − Mortgage interest
- −$8,402
- − Property taxes
- −$4,755
- − Insurance
- −$1,416
- − Repairs & maintenance
- −$1,820
- − Management
- −$1,820
- − Depreciation
- −$4,364
- Taxable income
- $168
- Est. tax owed @ 24.0%
- −$40
- After-tax cash flow
- $2,317/yr
For passive investors: Depreciation is non-cash, so a rental often shows a tax loss while cash-flowing — sheltering income. Rental losses are passive: they offset passive income freely, and up to $25,000/yr can offset ordinary (W-2) income if you actively participate and your MAGI is under $100k (phasing out to $0 by $150k); unused losses carry forward. On sale, claimed depreciation is recaptured at up to 25%, and gains may owe capital-gains tax (a 1031 exchange can defer both). Figures are a year-1 estimate at your 24.0% rate — not tax advice; consult a CPA.
Schools (NCES district)
- District
- Mohawk Trail
- NCES district ID
- 2507990
- Math proficiency
- 25% ▼ -15.00%
- Reading proficiency
- 45% ▼ -7.00%
- Median HH income
- $56,668
- Composite
- 30.91/100
- National rank
- #6114
- State rank
- #235 of 302 in MA
Livability — Shelburne Falls
- Score
- 73/100
- State rank
- #96
- US rank
- #5114
Category grades
Schools grade is shown separately in the Schools card above.
Census & demographics
- Population (ZIP)
- 79
Population outlook (Franklin County) Hauer SSP2
- Today (2025)
- 68,566 people
- By 2030
- 66,543 · -3.0%
- By 2040
- 60,766 · -11.4%
- By 2050
- 54,971 · -19.8%
- By 2075
- 42,642 · -37.8%
- By 2100
- 31,861 · -53.5%
Race, ethnicity, and origin ACS 2023
- Neighborhood character
- Predominantly White (96%)
- Race & ethnicity
- White 96% Hispanic / Latino 4%
- Common ancestry
- Italian 33% Serbian 8% Lithuanian 6%
- Foreign-born
- 4% · Canada
- Languages at home
- 96% English-only · Spanish 4%
Political lean MEDSL · Franklin
- 2024 margin
- Solid D (+37.8) · D 67.3% · R 29.6% · Other 3.1%
- 2008→2024 swing
- -9.9pp toward R · 2008: 47.7pp · 2024: 37.8pp
- All cycles
- 2024: D+37.8 2020: D+44.4 2016: D+37.0 2012: D+47.0 2008: D+47.7
Not yet ingested
- Civics
- —
Market trends
- HPI YoY
- ▲ 5.05%
- Current HPI
- 226.4349
- Rent YoY
- —
- Metro
- —
- State GDP YoY
- ▲ 2.28%
- F500 in state
- 38
Industry mix (Fortune 500 HQ in MA)
| Industry | F500 HQs | Revenue |
|---|---|---|
| Technology | 3 | $17B |
|
||
| Insurance | 2 | $84B |
|
||
| Retail | 2 | $76B |
|
||
| Life Sciences | 1 | $43B |
|
||
| Energy Technology | 1 | $31B |
|
||
| Aerospace / Defense | 1 | $18B |
|
||
Price history
1 event — show timeline
- 2026-06-10 Listed $150,000 MLS PIN
Property tax history
+3.3%/yrLatest (2023): $4,755 · +1.0% YoY. Source: county tax records.
Cash-flow waterfall
monthlySold comps — $/sqft
last 12 mo · ≤1 miLoading sold comps…