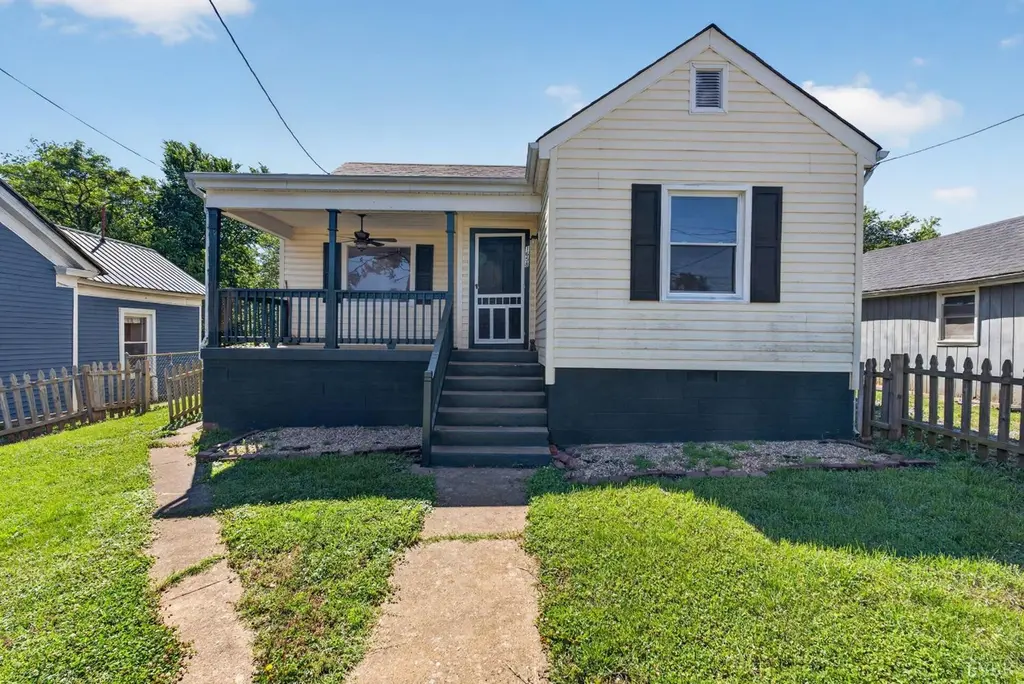
1658 Edmunds St · Lynchburg, VA
Flood risk 1/10 · Minimal
- FEMA flood zone
- X (unshaded)
- Chance of flooding over 30 yrs
- 0.0%
- Est. flood insurance / yr
- $473 – $860
Fire risk 2/10 · Minimal
- Est. fire insurance / yr
- $666 – $1,236
Heat risk 5/10 · Moderate
- Hot days now (above 101°F)
- 7 days/yr
- Hot days in 30 yrs
- 17 days/yr
Wind risk 2/10 · Minimal
- Chance of severe wind over 30 yrs
- 3.0%
Air-quality risk 2/10 · Minimal
- Unhealthy air days now
- 0 days/yr
- Unhealthy air days in 30 yrs
- 1 days/yr
Risk factors via First Street. Map © Google.
Why this score? — see what drove the B+ grade
The composite is a weighted blend of 9 inputs, each scored 0–100. Each bar is that input's sub-score; the figure is the points it added to the 100-point composite (weight × sub-score).
- Cash flow +30.0/30.0
- ARV discount +15.0/15.0
- DSCR +10.0/10.0
- 1% rule +7.7/10.0
- Livability +4.5/5.0
- Schools +4.0/10.0
- Rent growth +2.8/5.0
- Condition / age +2.5/5.0
- Appreciation +0.0/10.0
$92,500
🖨 Deal sheet (PDF) 📄 Offer letter ✓ Due diligence
Listing remarks
Cute 2 Bedroom, 2 Full Bath starter home with a large level back yard perfect for outdoor fun, gardening, or pets! Refinished hardwood floors add warmth throughout the home. Spacious eat-in kitchen includes the refrigerator and stove. A washer & dryer also convey for added convenience. The clean basement provides excellent storage space. A wonderful opportunity for first-time buyers!
Key facts
- Clean basement
- 8,982 sq ft lot
- Built 1953
Tags
Property features AI
Exterior
- Utilities: Public water; Public sewer
- Home design: Single-family residence; One story
- Construction: Vinyl siding
- Exterior features: Deck; Porch; Shingle roof
Interior
- Kitchen: Electric range; Refrigerator
- Flooring: Hardwood; Wood; Vinyl
- Bathrooms: Two full bathrooms
- Heating & cooling: Forced air heating; Central air conditioning
- Interior features: Hardwood and wood flooring in main living areas with vinyl in select rooms; Full basement
- Laundry & utility: Washer hookup on main level; Washer and dryer included; Electric water heater
Neighborhood map
What this means for you Summary
Snapshot
- This is a 2-bed/1.0-bath single-family listed at $92k.
Deal economics
- At list price, monthly cash flow is $347 ($4k/yr) — positive.
- The deal already cash-flows at list — no discount required.
- Meets the 1% rule at list price ($1k rent vs $92k).
- Cap rate 10.8% vs local median 4.0% in Lynchburg — top-decile yield for the area; either an underpriced asset or a hidden risk that comps aren't pricing in. Stress-test before assuming the spread holds.
Location & tenants
- Location reads 91/100 on livability (#1 in VA, #58 nationally) — a professional / high-income tenant draw. Strengths: amenities A+, commute A+, cost of living A+; Watch: crime C-, employment D+.
- Lynchburg City Public School District (urban): math 36% / reading 61% proficiency, ranked #104 of 131 in VA (top 79%) — families likely to look elsewhere, expect single-tenant / working-renter base with shorter leases; 61% free/reduced lunch — lower-income household profile, screen leases tightly.
- Zoned schools: William M. Bass Elementary (math 22% / reading 42%, grade F, #992 of 1,108 statewide, top 90%, 175 students, 91% FRL); Sandusky Middle (math 29% / reading 52%, grade F, #303 of 342 statewide, top 89%, 568 students, 96% FRL); Heritage High (math 32% / reading 77%, grade C-, #281 of 319 statewide, top 90%, 1,073 students, 94% FRL) — zoned schools average 94% FRL vs 61% district-wide (33 pts higher); higher-poverty schools than district average — tighter screening recommended.
- Market conditions: Rents rising (+1.1%/yr); 221 active listings in the ZIP; 29 comparable units currently listed for rent nearby; rentals at typical pace (median 23d on market — plan ~3-4 weeks tenant-placement turnaround); lower-income renter base — watch delinquency; 472 units permitted in Lynchburg city in 2024 (240 in 5+ unit buildings).
- This rent runs 33% of the median local income ($42k/yr) — at the standard rent-burdened threshold; future hikes will face affordability resistance.
Forward outlook
- Local home prices are declining (-3.0%/yr); year-one equity from $640 of loan paydown is wiped out by about $3k of value loss. Plan a longer hold.
- Lynchburg County population projected at +37% by 2050 — long-run rental-demand tailwind backs the buy-and-hold thesis.
- At projected returns (-3.0% appreciation + 1.1% rent growth), your $26k cash investment doubles in ~9 years — after that, you're playing with house money.
Negotiation context
- Only 2 days on market — expect competitive offers; lowballing is unlikely to land.
- Current owner paid $17k; list at $92k implies a 447% gain — meaningful room to come down on a strong offer.
Risks & watch-outs
- Watch-outs: built in 1953 — expect roof / HVAC / electrical / plumbing capex.
- Climate carrying-cost: extreme-heat days projected 7→17/yr by 2055 (HVAC capex compounding) — expect insurance premiums to compound above CPI over the hold.
Questions for the listing agent
- Built in 1953 — when were the roof, HVAC, electrical panel, plumbing, and water heater last replaced?
- Is there a deadline driving the sale (1031 exchange, divorce, estate, relocation)? That informs how much negotiation room exists.
- Schools are A-rated — typically a magnet for longer-tenancy family renters. What's the average tenant stay here, and is there a school-zone premium baked into asking?
- What's the average days-on-market for RENTAL listings here right now (not sales)? A rising rental-DOM trend means longer vacancies and softer asking-rent achievability than the comps imply.
- What's the recent tenant-quality profile in this submarket — average credit score on applications, eviction rate, late-payment / NSF rate, and stable-employment percentage? A property-management company in the area should have these aggregated.
- How much new for-sale + rental construction is in the pipeline within 1–3 miles? Heavy new supply typically softens prices + rents 12–24 months out; constrained supply supports both.
Investment metrics
- 1% rule
- 1.27% ✓
- Cap rate
- 10.80%
- Cash-on-cash
- 16.09%
- DSCR
- 1.72
- GRM
- 6.6
CMA / ARV
- ARV (on-the-fly)
- $154,721
- Comps found
- 12
Show comp detail 12 sales within ~0.75 mi
| Address | Dist | Beds/Ba | Sqft | Sold | Price | $/sf | Match |
|---|---|---|---|---|---|---|---|
| 1658 Edmunds St | 0.00mi | 2/2.0 | 961 (0%) | 0mo | $103,000 | $107 | 96 |
| 1725 Otey St | 0.10mi | 3/1.0 (+1) | 961 (0%) | 4mo | $120,000 | $125 | 87 |
| 1534 Otey St. St | 0.17mi | 2/1.0 | 1,031 (+7%) | 7mo | $169,900 | $165 | 74 |
| 2809 Herbert St | 0.34mi | 2/2.0 | 1,000 (+4%) | 8mo | $198,500 | $199 | 67 |
| 1418 Wise St | 0.63mi | 2/1.0 | 1,024 (+7%) | 6mo | $141,000 | $138 | 55 |
| 3134 Campbell Ave. Ave | 0.51mi | 2/2.0 | 868 (-10%) | 1mo | $160,000 | $184 | 55 |
| 1706 Floyd St | 0.44mi | 2/1.0 | 1,082 (+13%) | 6mo | $145,000 | $134 | 53 |
| 2346 Aragon St | 0.63mi | 2/1.0 | 1,048 (+9%) | 3mo | $139,000 | $133 | 53 |
| 1114 Knight St | 0.45mi | 3/2.0 (+1) | 1,085 (+13%) | 0mo | $43,600 | $40 | 48 |
| 909 Virginia St | 0.56mi | 3/1.0 (+1) | 1,064 (+11%) | 6mo | $171,000 | $161 | 46 |
| 2518 Carter St | 0.48mi | 3/2.0 (+1) | 1,091 (+14%) | 2mo | $187,400 | $172 | 44 |
| 2013 Poplar St | 0.63mi | 3/2.5 (+1) | 1,040 (+8%) | 4mo | $176,000 | $169 | 43 |
Match score weights: distance 35% · size 25% · config 20% · recency 20%. Top-matched comps best support the ARV.
Projected returns pro-forma
-3.0% appreciation · 1.15% rent growth · sell at horizon
- IRR
- 5.1%
- Equity multiple
- 1.19×
- Total profit
- $4,971
- Equity at exit
- $13,792
- IRR
- 12.8%
- Equity multiple
- 1.94×
- Total profit
- $24,268
- Equity at exit
- $7,998
Cash invested: $25,900 (down + closing). Projections, not guarantees.
Landlord ↔ Tenant lean methodology
- Overall (STATE)
- 55 Moderately Landlord-Leaning
- State Virginia
- 55 Moderately Landlord-Leaning · D+2
- County
- — inherits STATE
- City
- — inherits STATE
ZIP-level market 24501
- Rents YoY
- 1.1%
- Active inventory
- 221
- Price-to-rent
- 6.6×
Monthly cashflow live
- Estimated rent
- $1,171 high interval (Pro) →
- Mortgage (P&I)
- −$485
- Tax from tax record
- −$54 /mo · $648/yr
- Insurance
- −$39
- HOA
- −$0
- Vacancy / Maint / Mgmt
- −$246
- Net cashflow
- $347
Break-even live
Sensitivity live
| Price | -10% $400 | -5% $373 | +0% $347 | +5% $321 | +10% $295 |
|---|---|---|---|---|---|
| Rent | -10% $255 | -5% $301 | +0% $347 | +5% $394 | +10% $440 |
| Rate | -1.0pp $394 | -0.5pp $371 | base $347 | +0.5pp $323 | +1.0pp $299 |
UW: 25.0% down · 7.5% · 30yr · 1.5% tax · 5.0% vac · 8.0% maint · 8.0% mgmt
Financing live
Cash to close
- Down payment
- $23,125
- Closing costs
- $2,775
- Reserves months
- —
- Total cash needed
- —
Loan-product check · same deal, 3 products live
Conventional
25% down · 7.5% · 30yr
- Down + closing
- —
- Monthly P&I
- —
- Monthly cashflow
- —
- DSCR
- —
- Eligible?
- —
Personal DTI + credit; lowest rate.
DSCR
20% down · 8.5% · 30yr
- Down + closing
- —
- Monthly P&I
- —
- Monthly cashflow
- —
- DSCR
- —
- Eligible?
- —
No personal income docs; deal must DSCR.
Hard money
10% down · 12.0% · 12mo
- Down + closing
- —
- Monthly P&I
- —
- Monthly cashflow
- —
- DSCR
- —
- Eligible?
- —
Short-term bridge; refi at stabilization.
Rent comps 29 comps
| Address | Beds | Baths | Sqft | Rent | $/sqft | DOM | Units | Dist |
|---|---|---|---|---|---|---|---|---|
| 2205 Easley Ave Lynchburg, VA | 2.0 | 2.0 | 870 | $1,400 | $1.61 | 45d | 1 | 0.45mi |
| 2518 Carter St Lynchburg, VA | 3.0 | 2.0 | 1091 | $1,500 | $1.37 | 45d | 1 | 0.47mi |
| 2336 Aragon St Lynchburg, VA | 2.0 | 1.0 | 1042 | $995 | $0.95 | 15d | 1 | 0.60mi |
| 1401 Kemper St Lynchburg, VA | 2.0–3.0 | 2.0 | 1118 | $707 | $0.63 | 23d | 6 | 0.64mi |
| 1810 Laurel St Lynchburg, VA | 2.0 | 1.0 | 720 | $995 | $1.38 | 45d | 1 | 0.70mi |
| 1625 Shaffer St Lynchburg, VA | 2.0 | 1.0 | 895 | $850 | $0.95 | 45d | 1 | 0.74mi |
| 1106 Pierce St Lynchburg, VA | 3.0 | 2.0 | 1018 | $875 | $0.86 | 23d | 1 | 0.79mi |
| 2210 Haden St Lynchburg, VA | 2.0 | 1.0 | 784 | $1,050 | $1.34 | 45d | 1 | 0.86mi |
| 2734 Fort Ave Lynchburg, VA | 1.0–2.0 | 1.0–2.0 | 875 | $1,450 | $1.66 | 45d | 1 | 0.95mi |
| 1308 Clay St Apt 2 Lynchburg, VA | 1.0 | 1.0 | 750 | $995 | $1.33 | 23d | 1 | 0.99mi |
| 900 Polk St Unit A Lynchburg, VA | 3.0 | 1.0 | 1100 | $895 | $0.81 | 15d | 1 | 1.03mi |
| 1500 Main St Lynchburg, VA | 1.0–2.0 | 1.0 | 1182 | $1,600 | $1.35 | 15d | 6 | 1.04mi |
| 905 Centerdale St Lynchburg, VA | 2.0 | 1.0 | 780 | $895 | $1.15 | 15d | 1 | 1.05mi |
| 318 Wadsworth St Lynchburg, VA | 3.0 | 1.0 | 943 | $995 | $1.06 | 23d | 1 | 1.06mi |
| 317 Grove St Unit A Lynchburg, VA | 2.0 | 1.0 | 900 | $895 | $0.99 | 45d | 1 | 1.06mi |
| 2107 Park Ave Unit 4 Lynchburg, VA | 2.0 | 1.0 | 800 | $785 | $0.98 | 15d | 1 | 1.06mi |
| 1217 Church St Unit 210 Lynchburg, VA | 1.0 | 1.0 | 635 | $1,150 | $1.81 | 15d | 1 | 1.09mi |
| 216 Kenyon St Lynchburg, VA | 2.0 | 1.0 | 1114 | $995 | $0.89 | 45d | 1 | 1.17mi |
| 8 Parkwood Ave Unit A Lynchburg, VA | 2.0 | 1.0 | 840 | $895 | $1.07 | 15d | 1 | 1.18mi |
| 2021 Rose Ln Lynchburg, VA | 2.0 | 1.0 | 836 | $1,095 | $1.31 | 23d | 1 | 1.18mi |
| 803 Mansfield Ave Lynchburg, VA | 2.0 | 1.0 | 900 | $1,300 | $1.44 | 23d | 1 | 1.30mi |
| 51 11th St Lynchburg, VA | 1.0 | 1.0 | 608 | $1,295 | $2.13 | 15d | 1 | 1.31mi |
| 801 Church St Unit 6 Lynchburg, VA | 1.0 | 1.0 | 675 | $1,200 | $1.78 | 45d | 1 | 1.31mi |
| 801 Church St Unit 8 Lynchburg, VA | 2.0 | 2.0 | 875 | $1,850 | $2.11 | 15d | 1 | 1.31mi |
| 317 Polk St Lynchburg, VA | 3.0 | 2.0 | 925 | $1,650 | $1.78 | 45d | 1 | 1.38mi |
| 106 Yeardley Ave Unit B Lynchburg, VA | 3.0 | 1.0 | 1060 | $895 | $0.84 | 23d | 1 | 1.42mi |
| 723 Jefferson St Lynchburg, VA | 1.0 | 1.0 | 723 | $1,095 | $1.51 | 15d | 1 | 1.45mi |
| 1705 1st St Unit A Lynchburg, VA | 2.0 | 1.0 | 1100 | $1,395 | $1.27 | 23d | 1 | 1.49mi |
| 612 Commerce St Lynchburg, VA | 1.0–2.0 | 1.0–2.0 | 716 | $1,250 | $1.74 | 15d | 2 | 1.49mi |
Listing history 4 events
-
2026-05-14status Pending
-
2026-05-12$92,500 Active
-
1981-06-24soldstatus $16,900
-
1967-06-12soldstatus $6,800
ⓘ Source: listings_history table (triggers on properties + properties_extension) + one-shot
backfill from property_details.listing_events for pre-trigger history.
Tax reassessment forecast VA · Resets to sale price
- Current annual tax
- $648 · $54/mo
- Projected year-2 tax
- $759 · $63/mo
- Expected delta
- +$111/yr (+$9/mo · 17.1%)
ⓘ Screening estimate from a state-policy table — verify with the county assessor before closing.
Climate risk First Street
- Flood 1/10 Low FEMA zone X (unshaded) · 0% chance over 30 yrs
- Wildfire 2/10 Low
- Heat 5/10 Major 7 d/yr ≥101°F today · 17 d/yr by 30 yrs out
- Wind 2/10 Low 3% chance of damaging wind over 30 yrs
- Air quality 2/10 Low 0 unhealthy d/yr today · 1 by 30 yrs out
Nearby sold comps map
Loading sold comps map…
Walkable amenities ~0.75 mi
Loading nearby amenities…
Taxation est. · year 1
- Rental income
- $14,049
- − Mortgage interest
- −$5,181
- − Property taxes
- −$648
- − Insurance
- −$462
- − Repairs & maintenance
- −$1,124
- − Management
- −$1,124
- − Depreciation
- −$2,691
- Taxable income
- $2,819
- Est. tax owed @ 24.0%
- −$676
- After-tax cash flow
- $3,491/yr
For passive investors: Depreciation is non-cash, so a rental often shows a tax loss while cash-flowing — sheltering income. Rental losses are passive: they offset passive income freely, and up to $25,000/yr can offset ordinary (W-2) income if you actively participate and your MAGI is under $100k (phasing out to $0 by $150k); unused losses carry forward. On sale, claimed depreciation is recaptured at up to 25%, and gains may owe capital-gains tax (a 1031 exchange can defer both). Figures are a year-1 estimate at your 24.0% rate — not tax advice; consult a CPA.
Schools (NCES district)
- District
- Lynchburg City Public School District
- NCES district ID
- 5102340
- Math proficiency
- 36% ▼ -38.00%
- Reading proficiency
- 61% ▼ -8.00%
- Median HH income
- $39,097
- Composite
- 40.4/100
- National rank
- #3730
- State rank
- #104 of 131 in VA
Livability — Lynchburg
- Score
- 91/100
- State rank
- #1
- US rank
- #58
Category grades
Schools grade is shown separately in the Schools card above.
Census & demographics
- Census place
- Lynchburg, VA
- County
- Lynchburg City · 97,036 people
- City population
- 97,036
- Metro
- Lynchburg, VA
- Population (ZIP)
- 25,006
- Household income
- $42,222
- Rent vs Own
- Severe rent burden
- 1717.0
Population outlook (Lynchburg County) Hauer SSP2
- Today (2025)
- 87,977 people
- By 2030
- 93,626 · +6.4%
- By 2040
- 106,145 · +20.7%
- By 2050
- 120,783 · +37.3%
- By 2075
- 162,249 · +84.4%
- By 2100
- 191,358 · +117.5%
Race, ethnicity, and origin ACS 2023
- Neighborhood character
- Diverse neighborhood (Simpson 0.55)
- Race & ethnicity
- White 58% Black 34% Two or more races 4% Hispanic / Latino 3%
- Common ancestry
- Slovak 1% Italian 1% Serbian 1%
- Foreign-born
- 3% · Canada
- Languages at home
- 96% English-only · Spanish 2%
Political lean MEDSL · Lynchburg
- 2024 margin
- Lean R (+7.9) · D 45.4% · R 53.3% · Other 1.3%
- 2008→2024 swing
- -3.9pp toward R · 2008: -4.0pp · 2024: -7.9pp
- All cycles
- 2024: R+7.9 2020: D+2.6 2016: R+9.0 2012: R+10.6 2008: R+4.0
Not yet ingested
- Civics
- —
Market trends
- HPI YoY
- ▼ -131.06%
- Current HPI
- 223.6839
- Rent YoY
- ▲ 1.15%
- Metro
- Lynchburg, VA
- State GDP YoY
- ▲ 2.40%
- F500 in state
- 50
Industry mix (Fortune 500 HQ in VA)
| Industry | F500 HQs | Revenue |
|---|---|---|
| Aerospace / Defense | 4 | $236B |
|
||
| Technology / Defense | 3 | $32B |
|
||
| Financial Services | 2 | $176B |
|
||
| Utilities | 2 | $27B |
|
||
| Insurance | 2 | $25B |
|
||
| Technology | 2 | $15B |
|
||
Price history
+1260.3% since first listed4 events — show timeline
- 2026-05-14 Pending — LMLS
- 2026-05-12 Listed $92,500 LMLS
- 1981-06-24 Sold (Public Records) $16,900 Public Records
- 1967-06-12 Sold (Public Records) $6,800 Public Records
Property tax history
+2.6%/yrLatest (2025): $648 · +1.8% YoY. Source: county tax records.
Cash-flow waterfall
monthlySold comps — $/sqft
last 12 mo · ≤1 miLoading sold comps…