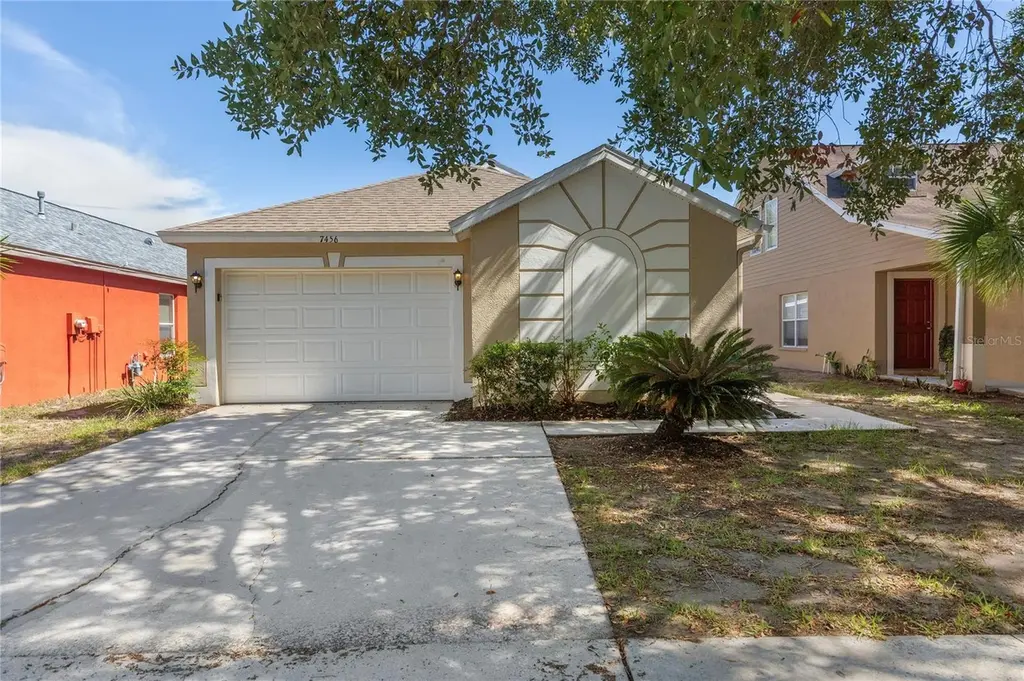
7456 Oxford Garden Cir · Apollo Beach, FL
Flood risk 1/10 · Minimal
- FEMA flood zone
- X (unshaded)
- Chance of flooding over 30 yrs
- 0.0%
- Est. flood insurance / yr
- $507 – $1,088
Fire risk 4/10 · Minor
- Est. fire insurance / yr
- $947 – $1,759
Heat risk 10/10 · Severe
- Hot days now (above 108°F)
- 7 days/yr
- Hot days in 30 yrs
- 29 days/yr
Wind risk 9/10 · Severe
- Chance of severe wind over 30 yrs
- 99.0%
Air-quality risk 3/10 · Minor
- Unhealthy air days now
- 3 days/yr
- Unhealthy air days in 30 yrs
- 4 days/yr
Risk factors via First Street. Map © Google.
Why this score? — see what drove the D- grade
The composite is a weighted blend of 9 inputs, each scored 0–100. Each bar is that input's sub-score; the figure is the points it added to the 100-point composite (weight × sub-score).
- Cash flow +8.5/30.0
- ARV discount +7.5/15.0
- Schools +4.2/10.0
- Livability +3.6/5.0
- 1% rule +3.4/10.0
- Rent growth +3.3/5.0
- Condition / age +2.5/5.0
- DSCR +2.3/10.0
- Appreciation +0.0/10.0
$295,000
🖨 Deal sheet (PDF) 📄 Offer letter ✓ Due diligence
Listing remarks
Welcome home to this beautifully updated residence in the highly desirable Covington Park community. Featuring an open-concept design with soaring vaulted ceilings, this home offers a bright and spacious feel that's perfect for both everyday living and entertaining, with the HVAC having been replaced in the last 5 years. The updated kitchen seamlessly overlooks the living area and is equipped with stainless steel appliances, creating a functional and inviting gathering space. Stylish laminate flooring throughout the main living areas adds warmth, durability, and easy maintenance. Step outside to enjoy the screened lanai, an ideal spot for morning coffee, outdoor dining, or simply relaxing w
Key facts
- Open-concept design
- Screened lanai
- Updated residence
Tags
Property features AI
Finance
- Other: Total living area reported as 1,367 (public records); Building area reported as 2,011; Lot area approximately 452 square meters
- HOA & community: Covington Park HOA (annual fee $135; monthly equivalent $11.25); HOA fee required; Pets allowed: cats and dogs
Exterior
- Parking: Attached garage (2 car)
- Utilities: Public water; Public sewer; Other utilities
- Home design: Single-family residence; One story; Faces north; Residential property in planned development zoning
- Construction: Concrete construction; Shingle roof; Slab foundation; Built on a 0.11-acre lot
- Exterior features: Paved road access; Lot dimensions approximately 41.24 x 118
Interior
- Kitchen: Dishwasher; Microwave; Range
- Bedrooms: 4 bedrooms
- Flooring: Laminate
- Bathrooms: 2 full bathrooms
- Heating & cooling: Central heating (electric); Central air conditioning
- Interior features: High ceilings; Open floorplan
- Laundry & utility: Laundry: Other
Neighborhood map
What this means for you Summary
Snapshot
- This is a 4-bed/2.0-bath single-family listed at $295k.
Deal economics
- At list price, monthly cash flow is $-257 ($-3k/yr) — negative.
- To cash-flow at today's rent, offer at most $250k (15.4% below list).
- To meet the 1% rule (rent ≥ 1% of price), the offer needs to be $248k (16.0% below list).
- Recommended offer: $248k (16.0% below list) — sets the bar for 1% rule.
Location & tenants
- Location reads 72/100 on livability (#333 in FL) — a middle-class / working-renter tenant base. Strengths: crime A+, employment A+, housing A+; Watch: cost of living C-, amenities F, health & safety F.
- Hillsborough (suburban): math 47% / reading 50% proficiency, ranked #41 of 73 in FL (top 56%) — families likely to look elsewhere, expect single-tenant / working-renter base with shorter leases.
- Market conditions: Rents rising (+3.4%/yr); 768 active listings in the ZIP; 17 comparable units currently listed for rent nearby; rentals leasing fast (median 6d on market — plan ~1-2 weeks tenant-placement turnaround); high-income renter base; 9,053 units permitted in Hillsborough County in 2024 (4,555 in 5+ unit buildings).
Forward outlook
- Local home prices are declining (-3.0%/yr); year-one equity from $2k of loan paydown is wiped out by about $9k of value loss. Plan a longer hold.
- Hillsborough County population projected at +37% by 2050 — long-run rental-demand tailwind backs the buy-and-hold thesis.
Negotiation context
- Only 3 days on market — expect competitive offers; lowballing is unlikely to land.
- 6 sale attempts since 3y ago with the ask held roughly flat each time — persistent listings suggest the price (not the market) is what's stuck; bring a comps-based counter.
- Current owner paid $205k; 44% above their basis — modest negotiation headroom, anchor on the comps not their cost.
Risks & watch-outs
- Climate carrying-cost: severe wind risk, 99% chance of damaging wind over 30y; extreme-heat days projected 7→29/yr by 2055 (HVAC capex compounding) — expect insurance premiums to compound above CPI over the hold.
Questions for the listing agent
- What do current leases actually rent for vs. the listed asking? Can we see a recent rent roll and the last 12 months of T-12 income?
- What does the HOA fee cover, when was the last increase, and are there any pending special assessments or reserve-fund shortfalls?
- Is there a deadline driving the sale (1031 exchange, divorce, estate, relocation)? That informs how much negotiation room exists.
- Schools are B-rated — typically a magnet for longer-tenancy family renters. What's the average tenant stay here, and is there a school-zone premium baked into asking?
- The area grade is low — what's the realistic commute time and amenity access for the typical tenant pool here? Any planned neighborhood developments (good or bad) we should know about?
- What's the average days-on-market for RENTAL listings here right now (not sales)? A rising rental-DOM trend means longer vacancies and softer asking-rent achievability than the comps imply.
- What's the recent tenant-quality profile in this submarket — average credit score on applications, eviction rate, late-payment / NSF rate, and stable-employment percentage? A property-management company in the area should have these aggregated.
- How much new for-sale + rental construction is in the pipeline within 1–3 miles? Heavy new supply typically softens prices + rents 12–24 months out; constrained supply supports both.
Investment metrics
- 1% rule
- 0.84% ✗
- Cap rate
- 5.25%
- Cash-on-cash
- -3.74%
- DSCR
- 0.83
- GRM
- 9.9
CMA / ARV
No comps found within radius.
Projected returns pro-forma
-3.0% appreciation · 3.36% rent growth · sell at horizon
- IRR
- -22.1%
- Equity multiple
- 0.24×
- Total profit
- $-63,150
- Equity at exit
- $43,985
- IRR
- -15.0%
- Equity multiple
- 0.13×
- Total profit
- $-71,783
- Equity at exit
- $25,506
Cash invested: $82,600 (down + closing). Projections, not guarantees.
Landlord ↔ Tenant lean methodology
- Overall (STATE)
- 87 Strongly Landlord-Friendly
- State Florida
- 87 Strongly Landlord-Friendly · R+3
- County
- — inherits STATE
- City
- — inherits STATE
ZIP-level market 33572
- Rents YoY
- 3.4%
- Active inventory
- 768
- Price-to-rent
- 9.9×
Monthly cashflow live
- Estimated rent
- $2,478 high interval (Pro) →
- Mortgage (P&I)
- −$1,547
- Tax from tax record
- −$534 /mo · $6,413/yr
- Insurance
- −$123
- HOA
- −$11
- Vacancy / Maint / Mgmt
- −$520
- Net cashflow
- $-257
Break-even live
Sensitivity live
| Price | -10% $-90 | -5% $-174 | +0% $-257 | +5% $-341 | +10% $-424 |
|---|---|---|---|---|---|
| Rent | -10% $-453 | -5% $-355 | +0% $-257 | +5% $-160 | +10% $-62 |
| Rate | -1.0pp $-109 | -0.5pp $-182 | base $-257 | +0.5pp $-334 | +1.0pp $-412 |
UW: 25.0% down · 7.5% · 30yr · 1.5% tax · 5.0% vac · 8.0% maint · 8.0% mgmt
Financing live
Cash to close
- Down payment
- $73,750
- Closing costs
- $8,850
- Reserves months
- —
- Total cash needed
- —
Loan-product check · same deal, 3 products live
Conventional
25% down · 7.5% · 30yr
- Down + closing
- —
- Monthly P&I
- —
- Monthly cashflow
- —
- DSCR
- —
- Eligible?
- —
Personal DTI + credit; lowest rate.
DSCR
20% down · 8.5% · 30yr
- Down + closing
- —
- Monthly P&I
- —
- Monthly cashflow
- —
- DSCR
- —
- Eligible?
- —
No personal income docs; deal must DSCR.
Hard money
10% down · 12.0% · 12mo
- Down + closing
- —
- Monthly P&I
- —
- Monthly cashflow
- —
- DSCR
- —
- Eligible?
- —
Short-term bridge; refi at stabilization.
Rent comps 17 comps
| Address | Beds | Baths | Sqft | Rent | $/sqft | DOM | Units | Dist |
|---|---|---|---|---|---|---|---|---|
| 7556 Oxford Garden Cir Apollo Beach, FL | 3.0 | 2.0 | 1335 | $2,020 | $1.51 | 5d | 1 | 0.12mi |
| 6808 Cambridge Park Dr Apollo Beach, FL | 3.0 | 2.0 | 1858 | $2,350 | $1.26 | 18d | 1 | 0.25mi |
| 6447 Clair Shore Dr Apollo Beach, FL | 3.0 | 2.0 | 1770 | $2,700 | $1.53 | 5d | 1 | 0.48mi |
| 6981 Waterset Blvd Apollo Beach, FL | 3.0 | 2.0 | 1412 | $2,406 | $1.70 | 0d | 1 | 0.60mi |
| 7006 Monarch Park Dr Apollo Beach, FL | 4.0 | 2.0 | 1868 | $2,425 | $1.30 | 21d | 1 | 0.73mi |
| 6981 Tapestry Heights Ave Apollo Beach, FL | 3.0 | 1.0–2.0 | 1050 | $2,595 | $2.47 | 0d | 36 | 0.84mi |
| 13128 Logan Captiva Ln Gibsonton, FL | 3.0 | 2.5 | 1588 | $2,150 | $1.35 | 25d | 1 | 1.00mi |
| 13123 Kings Crossing Dr Gibsonton, FL | 3.0 | 2.5 | 1360 | $1,850 | $1.36 | 25d | 1 | 1.10mi |
| 6350 Union Station Ct Apollo Beach, FL | 3.0 | 1.0–2.0 | 1116 | $2,744 | $2.46 | 0d | 43 | 1.12mi |
| 12978 Kings Crossing Dr Gibsonton, FL | 4.0 | 3.0 | 1576 | $2,300 | $1.46 | 25d | 1 | 1.15mi |
| 9437 Lemon Drop Loop Sun City Center, FL | 3.0 | 2.0 | 1451 | $2,350 | $1.62 | 20d | 1 | 1.16mi |
| 13047 Bridleford Dr Gibsonton, FL | 3.0 | 2.0 | 1593 | $2,025 | $1.27 | 25d | 1 | 1.20mi |
| 10040 Blackstone Creek CT Riverview, FL | 3.0–4.0 | 2.5 | 1687 | $2,995 | $1.78 | 5d | 20 | 1.21mi |
| 13049 Waterbourne Dr Gibsonton, FL | 3.0 | 2.0 | 1632 | $2,049 | $1.26 | 3d | 1 | 1.24mi |
| 6322 Camino Dr Apollo Beach, FL | 3.0 | 2.5 | 1677 | $2,400 | $1.43 | 15d | 1 | 1.27mi |
| 6222 Camino Dr Apollo Beach, FL | 3.0 | 2.5 | 1617 | $2,400 | $1.48 | 5d | 1 | 1.37mi |
| 9620 Sage Creek Dr Sun City Center, FL | 3.0 | 2.0 | 1555 | $2,061 | $1.33 | 0d | 1 | 1.37mi |
HOA detail
- Monthly dues
- $11 · $132/yr
Listing history 3 events
-
2026-06-21days on market $295,000 Active 3 DOM
-
2026-06-18remarks 699-char remark
-
2026-06-18$295,000 Active 1 DOM
ⓘ Source: listings_history table (triggers on properties + properties_extension) + one-shot
backfill from property_details.listing_events for pre-trigger history.
Tax reassessment forecast FL · Resets to sale price
- Current annual tax
- $6,413 · $534/mo
- Projected year-2 tax
- $6,413 · $534/mo
- Expected delta
- $0/yr ($0/mo · 0.0%)
ⓘ Screening estimate from a state-policy table — verify with the county assessor before closing.
Climate risk First Street
- Flood 1/10 Low FEMA zone X (unshaded) · 0% chance over 30 yrs
- Wildfire 4/10 Moderate
- Heat 10/10 Extreme 7 d/yr ≥108°F today · 29 d/yr by 30 yrs out
- Wind 9/10 Extreme 99% chance of damaging wind over 30 yrs
- Air quality 3/10 Moderate 3 unhealthy d/yr today · 4 by 30 yrs out
Nearby sold comps map
Loading sold comps map…
Walkable amenities ~0.75 mi
Loading nearby amenities…
Taxation est. · year 1
- Rental income
- $29,741
- − Mortgage interest
- −$16,525
- − Property taxes
- −$6,413
- − Insurance
- −$1,475
- − Repairs & maintenance
- −$2,379
- − Management
- −$2,379
- − HOA
- −$132
- − Depreciation
- −$8,582
- Taxable loss
- −$8,144
- Est. tax savings @ 24.0%
- +$1,955
- After-tax cash flow
- $-1,134/yr
For passive investors: Depreciation is non-cash, so a rental often shows a tax loss while cash-flowing — sheltering income. Rental losses are passive: they offset passive income freely, and up to $25,000/yr can offset ordinary (W-2) income if you actively participate and your MAGI is under $100k (phasing out to $0 by $150k); unused losses carry forward. On sale, claimed depreciation is recaptured at up to 25%, and gains may owe capital-gains tax (a 1031 exchange can defer both). Figures are a year-1 estimate at your 24.0% rate — not tax advice; consult a CPA.
Schools (NCES district)
- District
- Hillsborough
- NCES district ID
- 1200870
- Math proficiency
- 47% ▼ -8.00%
- Reading proficiency
- 50% ▼ -4.00%
- Median HH income
- $50,622
- Composite
- 41.6/100
- National rank
- #3435
- State rank
- #41 of 73 in FL
Livability — Apollo Beach
- Score
- 72/100
- State rank
- #333
- US rank
- #5784
Category grades
Schools grade is shown separately in the Schools card above.
Census & demographics
- Census place
- Apollo Beach, FL
- County
- Hillsborough County · 1,540,968 people
- City population
- 26,495
- Metro
- Tampa-St. Petersburg-Clearwater, FL
- Population (ZIP)
- 26,495
- Household income
- $122,130
- Rent vs Own
- Severe rent burden
- 381.0
Population outlook (Hillsborough County) Hauer SSP2
- Today (2025)
- 1,607,022 people
- By 2030
- 1,733,968 · +7.9%
- By 2040
- 1,979,565 · +23.2%
- By 2050
- 2,203,427 · +37.1%
- By 2075
- 2,667,893 · +66.0%
- By 2100
- 2,891,558 · +79.9%
Race, ethnicity, and origin ACS 2023
- Neighborhood character
- Predominantly White (65%)
- Race & ethnicity
- White 65% Hispanic / Latino 15% Black 13% Two or more races 12% Asian 2%
- Hispanic origin (detail)
- Mexican 2% Puerto Rican 3% Cuban 2% Dominican 2%
- Common ancestry
- Romanian 3% Lithuanian 3% Slovak 2%
- Foreign-born
- 10% · Canada, Jamaica, Guatemala
- Languages at home
- 86% English-only · Spanish 10% Russian/Polish/Slavic 1% Tagalog/Filipino 1%
Political lean MEDSL · Hillsborough
- 2024 margin
- Toss-up / Even · D 47.8% · R 50.9% · Other 1.3%
- 2008→2024 swing
- -10.2pp toward R · 2008: 7.1pp · 2024: -3.1pp
- All cycles
- 2024: R+3.1 2020: D+6.9 2016: D+6.8 2012: D+6.7 2008: D+7.1
Not yet ingested
- Civics
- —
Market trends
- HPI YoY
- ▼ -393.97%
- Current HPI
- 300.9596
- Rent YoY
- ▲ 3.36%
- Metro
- Tampa-St. Petersburg-Clearwater, FL
- State GDP YoY
- ▲ 3.28%
- F500 in state
- 36
Industry mix (Fortune 500 HQ in FL)
| Industry | F500 HQs | Revenue |
|---|---|---|
| Industrial Technology | 2 | $29B |
|
||
| Insurance | 2 | $17B |
|
||
| Retail | 1 | $60B |
|
||
| Technology Distribution | 1 | $58B |
|
||
| Homebuilding | 1 | $35B |
|
||
| Technology Manufacturing | 1 | $35B |
|
||
Price history
+8.3% since first listed21 events — show timeline
- 2026-06-18 Listed $295,000 Stellar MLS as Distributed by MLS Grid
- 2025-04-18 Rental Removed $2,095 RENT.
- 2025-04-14 Rental Removed $2,095 STELLARMLS
- 2025-03-31 Price Changed $2,095 STELLARMLS
- 2025-03-15 Price Changed $2,095 RENT.
- 2025-02-16 Price Changed $2,210 RENT.
- 2024-09-24 Listed for Rent $2,275 STELLARMLS
- 2024-09-24 Rental Removed $2,275 RENTLY
- 2024-09-17 Listed for Rent $2,275 RENTLY
- 2024-09-10 Listed for Rent $2,275 RENT.
- 2023-08-29 Rental Removed $2,225 RENTLY
- 2023-08-27 Rental Removed $2,225 RENT.
- 2023-08-19 Price Changed $2,225 RENTLY
- 2023-08-18 Price Changed $2,225 RENT.
- 2023-08-11 Price Changed $2,245 RENT.
- 2023-08-11 Price Changed $2,245 RENTLY
- 2023-08-02 Listed for Rent $2,295 RENT.
- 2023-08-02 Listed for Rent $2,295 RENTLY
- 2021-03-22 Sold (Public Records) $205,000 Public Records
- 2004-05-03 Sold (Public Records) $31,500 Public Records
- 2004-03-31 Sold (Public Records) $272,400 Public Records
Property tax history
+6.4%/yrLatest (2025): $6,413 · +0.1% YoY. Source: county tax records.
Cash-flow waterfall
monthlySold comps — $/sqft
last 12 mo · ≤1 miLoading sold comps…