 Duplex
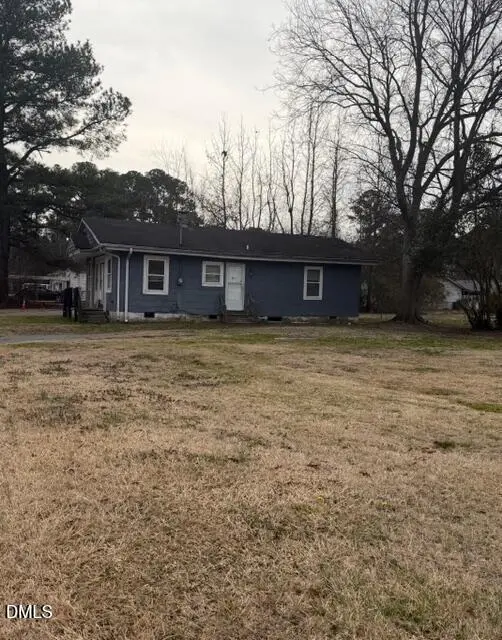
804 Midway St · Smithfield, NC
Flood risk 1/10 · Minimal
- FEMA flood zone
- X (unshaded)
- Chance of flooding over 30 yrs
- 0.0%
- Est. flood insurance / yr
- $507 – $1,088
Fire risk 1/10 · Minimal
- Est. fire insurance / yr
- $906 – $1,684
Heat risk 7/10 · Major
- Hot days now (above 105°F)
- 7 days/yr
- Hot days in 30 yrs
- 17 days/yr
Wind risk 7/10 · Major
- Chance of severe wind over 30 yrs
- 78.0%
Air-quality risk 2/10 · Minimal
- Unhealthy air days now
- 1 days/yr
- Unhealthy air days in 30 yrs
- 1 days/yr
Risk factors via First Street. Map © Google.
Why this score? — see what drove the C+ grade
The composite is a weighted blend of 9 inputs, each scored 0–100. Each bar is that input's sub-score; the figure is the points it added to the 100-point composite (weight × sub-score).
- Cash flow +30.0/30.0
- 1% rule +10.0/10.0
- DSCR +10.0/10.0
- Schools +3.5/10.0
- Livability +3.3/5.0
- Condition / age +2.5/5.0
- Rent growth +2.2/5.0
- ARV discount +0.0/15.0
- Appreciation +0.0/10.0
$144,000
🖨 Deal sheet 📄 Offer letter ✓ Due diligence
Multi-family units
County records classify this as Multi-Family (2-4 Unit). Listing-text estimate: 2 units. confirmed
Listing remarks
Duplex on large lot in the heart of Smithfield. Two efficiency one bedroom units with open floor plan living area, one full bath and one bedroom.
Key facts
- Open floor plan
- Large lot
- 9,000 sq ft lot
Tags
Property features AI
Finance
- Other: Living area reported as 956; Building area reported as 956
- Financial info: Property contains 1 unit; Owner pays: None
- HOA & community: No association
Exterior
- Parking: Driveway with 2 open parking spaces (2 total)
- Utilities: Public water; Public sewer; Electric service
- Home design: Duplex; One level; 1 common wall
- Construction: Asbestos and asphalt construction materials; Asphalt roof; Slab foundation; Built as part of 1 building
- Exterior features: Publicly maintained road access; Lot approximately 0.21 acres
Interior
- Kitchen: Electric cooktop; Electric oven
- Bedrooms: 2 bedrooms
- Flooring: Carpet; Vinyl
- Bathrooms: 2 full bathrooms
- Heating & cooling: Heat pump heating; Ceiling fan(s) for cooling
- Interior features: Electric cooktop; Electric oven
Neighborhood map
What this means for you Summary
Snapshot
- This is a 2 × 1-bed/1.0-bath units multifamily listed at $144k.
Deal economics
- At list price, monthly cash flow is $961 ($12k/yr) — positive. Per door: $481/mo.
- The deal already cash-flows at list — no discount required.
- Meets the 1% rule at list price ($2k rent vs $144k).
- Recommended offer: $140k (3.0% below list) — sets the bar for market timing.
- Cap rate 14.3% vs local median 3.5% in Smithfield — top-decile yield for the area; either an underpriced asset or a hidden risk that comps aren't pricing in. Stress-test before assuming the spread holds.
Location & tenants
- Location reads 66/100 on livability (#259 in NC) — a middle-class / working-renter tenant base. Strengths: cost of living A+, health & safety A+, housing B+; Watch: crime F, amenities F, commute F.
- Johnston County Public Schools (rural): math 39% / reading 42% proficiency, ranked #105 of 178 in NC (top 59%) — families likely to look elsewhere, expect single-tenant / working-renter base with shorter leases.
- Zoned schools: Smithfield Middle (math 20% / reading 32%, grade F, #385 of 475 statewide, top 81%, 501 students, 99% FRL); Smithfield-Selma High (math 25% / reading 37%, grade F, #454 of 535 statewide, top 85%, 1,503 students, 69% FRL) — zoned schools average 84% FRL vs 41% district-wide (44 pts higher); higher-poverty schools than district average — tighter screening recommended.
- Zoned-school proficiency averages 28% at this address vs 40% district-wide (-12 pts) — the specific schools serving this property underperform the Johnston County Public Schools average; the district grade overstates school quality for this exact location.
- Market conditions: Rents soft (-1.1%/yr); 401 active listings in the ZIP; 3 comparable units currently listed for rent nearby; rentals at typical pace (median 17d on market — plan ~3-4 weeks tenant-placement turnaround); 2,783 units permitted in Johnston County in 2024 (6 in 5+ unit buildings).
Forward outlook
- Local home prices are declining (-3.0%/yr); year-one equity from $996 of loan paydown is wiped out by about $4k of value loss. Plan a longer hold.
- Johnston County population projected at +37% by 2050 — long-run rental-demand tailwind backs the buy-and-hold thesis.
- At projected returns (-3.0% appreciation + 0.0% rent growth), your $40k cash investment doubles in ~5 years — after that, you're playing with house money.
Negotiation context
- It's been on market 51 days — a 3% lower offer ($140k) is reasonable based on typical stale-listing flexibility.
- Current owner paid $36k; list at $144k implies a 306% gain — meaningful room to come down on a strong offer.
Risks & watch-outs
- Watch-outs: built in 1940 — expect roof / HVAC / electrical / plumbing capex.
- Climate carrying-cost: major wind risk, 78% chance of damaging wind over 30y; extreme-heat days projected 7→17/yr by 2055 (HVAC capex compounding) — expect insurance premiums to compound above CPI over the hold.
Questions for the listing agent
- It's been on market 51 days. Have you received any prior offers? Is the seller open to a 3% concession, seller financing, or rate buy-down credit?
- Can we see the unit-by-unit rent roll, current vacancy, and any below-market leases? What's the average tenancy length?
- What capital expenditures (roof, boiler, parking lot, exteriors) have been made in the last 5 years, and what's planned in the next 2?
- Built in 1940 — when were the roof, HVAC, electrical panel, plumbing, and water heater last replaced?
- Is there a deadline driving the sale (1031 exchange, divorce, estate, relocation)? That informs how much negotiation room exists.
- Schools are F-rated, which usually means shorter tenancies and higher turnover. Who's the typical renter profile here, and what's been the actual vacancy rate?
- Crime grade is F in this area — have there been break-ins, vandalism, or insurance claims at this property in the last 3 years? What carrier currently insures it and at what premium?
- What's the average days-on-market for RENTAL listings here right now (not sales)? A rising rental-DOM trend means longer vacancies and softer asking-rent achievability than the comps imply.
- What's the recent tenant-quality profile in this submarket — average credit score on applications, eviction rate, late-payment / NSF rate, and stable-employment percentage? A property-management company in the area should have these aggregated.
- How much new apartment / multifamily construction is in the pipeline within 1–3 miles? Heavy new supply (>2% of stock underway) typically softens rents 12–24 months out; light construction supports rent growth.
Investment metrics
- 1% rule
- 1.62% ✓
- Cap rate
- 14.30%
- Cash-on-cash
- 28.61%
- DSCR
- 2.27
- GRM
- 5.1
CMA / ARV
- ARV (on-the-fly)
- $102,375
- Comps found
- 1
Show comp detail 1 sale within ~0.75 mi
| Address | Dist | Beds/Ba | Sqft | Sold | Price | $/sf | Match |
|---|---|---|---|---|---|---|---|
| 804 Midway St | 0.00mi | 2/2.0 | 956 (-2%) | 1mo | $100,000 | $105 | 96 |
Match score weights: distance 35% · size 25% · config 20% · recency 20%. Top-matched comps best support the ARV.
Projected returns pro-forma
-3.0% appreciation · 0.0% rent growth · sell at horizon
- IRR
- 19.6%
- Equity multiple
- 1.77×
- Total profit
- $31,014
- Equity at exit
- $21,471
- IRR
- 25.9%
- Equity multiple
- 2.97×
- Total profit
- $79,255
- Equity at exit
- $12,450
Cash invested: $40,320 (down + closing). Projections, not guarantees.
Landlord ↔ Tenant lean methodology
- Overall (STATE)
- 85 Strongly Landlord-Friendly
- State North Carolina
- 85 Strongly Landlord-Friendly · R+3
- County
- — inherits STATE
- City
- — inherits STATE
ZIP-level market 27577
- Home prices YoY
- -23.7%
- Rents YoY
- -1.1%
- Active inventory
- 401
- Price-to-rent
- 10.3×
Monthly cashflow live
- Estimated rent
- $2,336 medium interval (Pro) →
- Mortgage (P&I)
- −$755
- Tax from tax record
- −$69 /mo · $828/yr
- Insurance
- −$60
- HOA
- −$0
- Vacancy / Maint / Mgmt
- −$491
- Net cashflow
- $961
Break-even live
2-unit breakdown (identical units grouped — click to expand)
| Units | Beds | Baths | Est. rent |
|---|---|---|---|
| 2× units | 1 | 1 | $2,336 |
| #1 | 1 | 1 | $1,168 |
| #2 | 1 | 1 | $1,168 |
| Total (2 units) | $2,336 | ||
UW: 25.0% down · 7.5% · 30yr · 1.5% tax · 5.0% vac · 8.0% maint · 8.0% mgmt
Financing live
Cash to close
- Down payment
- $36,000
- Closing costs
- $4,320
- Reserves months
- —
- Total cash needed
- —
Loan-product check · same deal, 3 products live
Conventional
25% down · 7.5% · 30yr
- Down + closing
- —
- Monthly P&I
- —
- Monthly cashflow
- —
- DSCR
- —
- Eligible?
- —
Personal DTI + credit; lowest rate.
DSCR
20% down · 8.5% · 30yr
- Down + closing
- —
- Monthly P&I
- —
- Monthly cashflow
- —
- DSCR
- —
- Eligible?
- —
No personal income docs; deal must DSCR.
Hard money
10% down · 12.0% · 12mo
- Down + closing
- —
- Monthly P&I
- —
- Monthly cashflow
- —
- DSCR
- —
- Eligible?
- —
Short-term bridge; refi at stabilization.
Rent comps 3 comps
| Address | Beds | Baths | Sqft | Rent | $/sqft | DOM | Units | Dist |
|---|---|---|---|---|---|---|---|---|
| 928 Blount St Smithfield, NC | 2.0 | 1.0 | 672 | $950 | $1.41 | 4d | 1 | 0.17mi |
| 510 Crump St Smithfield, NC | 3.0 | 2.0 | 1109 | $1,800 | $1.62 | 23d | 1 | 0.21mi |
| 105 W Langdon Ave Unit B Smithfield, NC | 3.0 | 2.0 | 1120 | $1,500 | $1.34 | 17d | 1 | 1.29mi |
Listing history 4 events
-
2026-05-10status Pending
-
2026-04-17price $144,000
-
2026-03-20$149,000 Active
-
2003-06-01soldstatus $35,500
ⓘ Source: listings_history table (triggers on properties + properties_extension) + one-shot
backfill from property_details.listing_events for pre-trigger history.
Tax reassessment forecast NC · Resets to sale price
- Current annual tax
- $828 · $69/mo
- Projected year-2 tax
- $1,181 · $98/mo
- Expected delta
- +$353/yr (+$29/mo · 42.7%)
ⓘ Screening estimate from a state-policy table — verify with the county assessor before closing.
Climate risk First Street
- Flood 1/10 Low FEMA zone X (unshaded) · 0% chance over 30 yrs
- Wildfire 1/10 Low
- Heat 7/10 Severe 7 d/yr ≥105°F today · 17 d/yr by 30 yrs out
- Wind 7/10 Severe 78% chance of damaging wind over 30 yrs
- Air quality 2/10 Low 1 unhealthy d/yr today · 1 by 30 yrs out
Nearby sold comps map
Loading sold comps map…
Walkable amenities ~0.75 mi
Loading nearby amenities…
Taxation est. · year 1
- Rental income
- $28,032
- − Mortgage interest
- −$8,066
- − Property taxes
- −$828
- − Insurance
- −$720
- − Repairs & maintenance
- −$2,243
- − Management
- −$2,243
- − Depreciation
- −$4,189
- Taxable income
- $9,744
- Est. tax owed @ 24.0%
- −$2,339
- After-tax cash flow
- $9,197/yr
For passive investors: Depreciation is non-cash, so a rental often shows a tax loss while cash-flowing — sheltering income. Rental losses are passive: they offset passive income freely, and up to $25,000/yr can offset ordinary (W-2) income if you actively participate and your MAGI is under $100k (phasing out to $0 by $150k); unused losses carry forward. On sale, claimed depreciation is recaptured at up to 25%, and gains may owe capital-gains tax (a 1031 exchange can defer both). Figures are a year-1 estimate at your 24.0% rate — not tax advice; consult a CPA.
Schools (NCES district)
- District
- Johnston County Public Schools
- NCES district ID
- 3702370
- Math proficiency
- 39% ▲ 4.00%
- Reading proficiency
- 42% ▲ 2.00%
- Median HH income
- $50,912
- Composite
- 34.99/100
- National rank
- #5052
- State rank
- #105 of 178 in NC
Livability — Smithfield
- Score
- 66/100
- State rank
- #259
- US rank
- #11380
Category grades
Schools grade is shown separately in the Schools card above.
Census & demographics
- Census place
- Smithfield, NC
- County
- Johnston County · 175,441 people
- City population
- 28,354
- Metro
- Raleigh-Cary, NC
- Population (ZIP)
- 28,354
- Household income
- $62,758
- Rent vs Own
- Severe rent burden
- 919.0
Population outlook (Johnston County) Hauer SSP2
- Today (2025)
- 222,440 people
- By 2030
- 240,227 · +8.0%
- By 2040
- 274,616 · +23.5%
- By 2050
- 304,915 · +37.1%
- By 2075
- 369,507 · +66.1%
- By 2100
- 406,280 · +82.6%
Race, ethnicity, and origin ACS 2023
- Neighborhood character
- Diverse neighborhood (Simpson 0.60)
- Race & ethnicity
- White 57% Hispanic / Latino 21% Black 19% Two or more races 7% Asian 1%
- Hispanic origin (detail)
- Mexican 13% Puerto Rican 2% Dominican 1%
- Common ancestry
- Lithuanian 2% Serbian 2% Slovak 1%
- Foreign-born
- 12% · Canada, Jamaica, South Korea
- Languages at home
- 80% English-only · Spanish 19%
Political lean MEDSL · Johnston
- 2024 margin
- Strong R (+21.5) · D 38.7% · R 60.2% · Other 1.1%
- 2008→2024 swing
- +2.2pp toward D · 2008: -23.7pp · 2024: -21.5pp
- All cycles
- 2024: R+21.5 2020: R+24.3 2016: R+30.7 2012: R+27.8 2008: R+23.7
Not yet ingested
- Civics
- —
Market trends
- HPI YoY
- ▼ -72.11%
- Current HPI
- 232.1552
- Rent YoY
- ▼ -1.05%
- Metro
- Raleigh-Cary, NC
- State GDP YoY
- ▲ 3.28%
- F500 in state
- 26
Industry mix (Fortune 500 HQ in NC)
| Industry | F500 HQs | Revenue |
|---|---|---|
| Financial Services | 2 | $213B |
|
||
| Retail | 2 | $95B |
|
||
| Industrial Conglomerate | 1 | $38B |
|
||
| Metals / Steel | 1 | $35B |
|
||
| Utilities | 1 | $30B |
|
||
| Industrial Machinery | 1 | $19B |
|
||
Price history
+305.6% since first listed4 events — show timeline
- 2026-05-10 Pending — TMLS
- 2026-04-17 Price Changed $144,000 TMLS
- 2026-03-20 Listed $149,000 TMLS
- 2003-06-01 Sold (Public Records) $35,500 Public Records
Property tax history
+8.1%/yrLatest (2025): $828 · +83.9% YoY. Source: county tax records.
Cash-flow waterfall
monthlySold comps — $/sqft
last 12 mo · ≤1 miLoading sold comps…