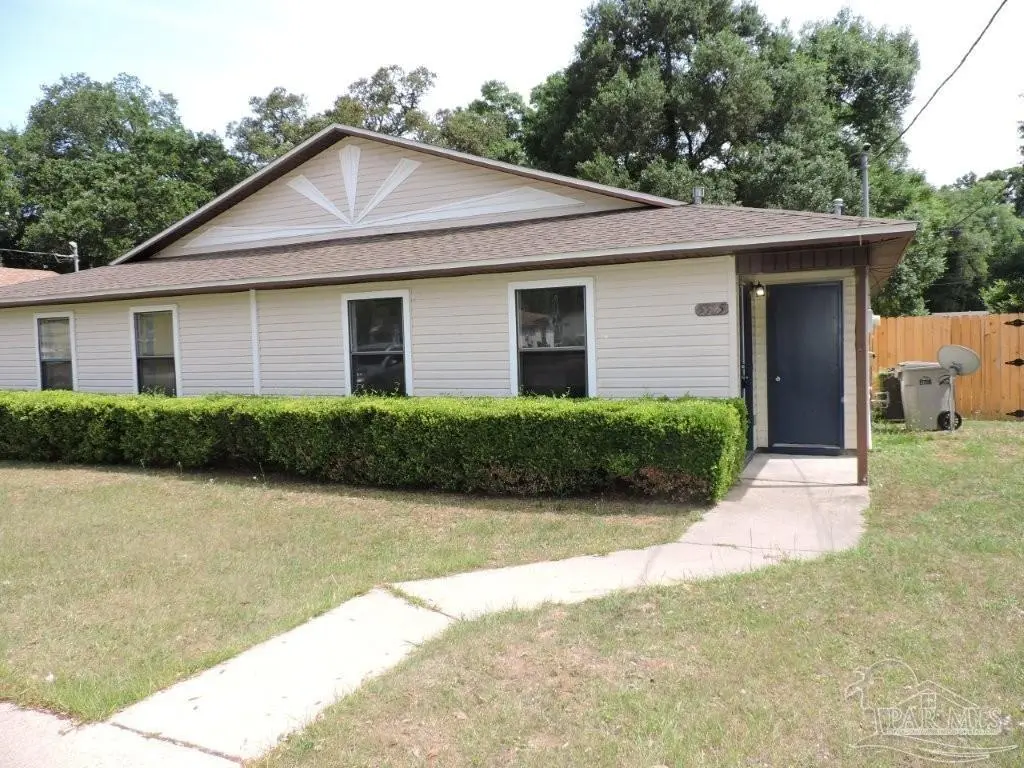
5525 Woodsman Ct · West Pensacola, FL
Flood risk 1/10 · Minimal
- FEMA flood zone
- X (unshaded)
- Chance of flooding over 30 yrs
- 0.0%
- Est. flood insurance / yr
- $507 – $1,088
Fire risk 1/10 · Minimal
- Est. fire insurance / yr
- $947 – $1,759
Heat risk 9/10 · Severe
- Hot days now (above threshold)
- 8 days/yr
- Hot days in 30 yrs
- 2 days/yr
Wind risk 9/10 · Severe
- Chance of severe wind over 30 yrs
- 99.0%
Air-quality risk 1/10 · Minimal
- Unhealthy air days now
- 0 days/yr
- Unhealthy air days in 30 yrs
- 0 days/yr
Risk factors via First Street. Map © Google.
Why this score? — see what drove the D+ grade
The composite is a weighted blend of 9 inputs, each scored 0–100. Each bar is that input's sub-score; the figure is the points it added to the 100-point composite (weight × sub-score).
- Cash flow +17.8/30.0
- ARV discount +9.3/15.0
- DSCR +5.6/10.0
- 1% rule +4.4/10.0
- Schools +3.6/10.0
- Rent growth +3.5/5.0
- Livability +3.3/5.0
- Condition / age +2.5/5.0
- Appreciation +0.0/10.0
$149,000
🖨 Deal sheet (PDF) 📄 Offer letter ✓ Due diligence
Listing remarks
Welcome to 5525 Woodsman Ct in Pensacola, FL! This well-maintained 2 bedroom, 2 bathroom home offers 1,224 square feet of comfortable living space with fresh updates throughout. Step inside to discover brand-new flooring that gives the home a clean, modern feel while creating a warm and inviting atmosphere. The functional layout provides spacious living areas, comfortable bedrooms, and plenty of natural light throughout the home. Whether you’re a first-time home buyer, downsizing, or looking for an investment opportunity, this property offers both convenience and value. Located in a quiet Pensacola neighborhood with easy access to shopping, dining, schools, NAS Pensacola, and the beau
Key facts
- Move-in ready
- Brand-new flooring
- Functional layout
Tags
Property features AI
Finance
- Other: Lot roughly 0.151 acres
- HOA & community: No association; If any association fees exist they are listed as annually
Exterior
- Parking: 2 spaces per unit
- Utilities: Public water; Septic tank sewer; Copper wiring electrical
- Home design: Single-story (one level); Attached property; Frame construction
- Construction: Frame construction; Off-grade foundation; Shingle roof
- Exterior features: Shingle roof; Central access; Located on a cul-de-sac; Paved, county-maintained road
Interior
- Kitchen: Electric water heater
- Bedrooms: Two bedrooms on the first floor (each approximately 10' x 10')
- Bathrooms: Two full bathrooms on the first floor; Bathrooms listed as not updated
- Heating & cooling: Central heating; Central air conditioning
- Interior features: Kitchen/dining combo; Resale condition; Attached property
- Laundry & utility: Off-grade foundation utilities (no specific washer/dryer listed)
Neighborhood map
What this means for you Summary
Snapshot
- This is a 2-bed/2.0-bath townhouse listed at $149k.
Deal economics
- At list price, monthly cash flow is $124 ($1k/yr) — positive.
- The deal already cash-flows at list — no discount required.
- To meet the 1% rule (rent ≥ 1% of price), the offer needs to be $140k (6.2% below list).
- Recommended offer: $140k (6.2% below list) — sets the bar for 1% rule.
Location & tenants
- Location reads 66/100 on livability (#629 in FL) — a middle-class / working-renter tenant base. Strengths: cost of living A+, housing A+, health & safety B+; Watch: crime D, schools F, amenities F.
- Escambia (suburban): math 40% / reading 45% proficiency, ranked #56 of 73 in FL (top 77%) — families likely to look elsewhere, expect single-tenant / working-renter base with shorter leases.
- Market conditions: Rents rising (+3.9%/yr); 270 active listings in the ZIP; 13 comparable units currently listed for rent nearby; rentals at typical pace (median 24d on market — plan ~3-4 weeks tenant-placement turnaround); 1,479 units permitted in Escambia County in 2024 (0 in 5+ unit buildings).
Forward outlook
- Local home prices are declining (-3.0%/yr); year-one equity from $1k of loan paydown is wiped out by about $4k of value loss. Plan a longer hold.
- Escambia County population projected at +13% by 2050 — modest demand growth; plan on rents tracking national, not racing it.
Negotiation context
- It's been on market 15 days — a 2% lower offer ($147k) is reasonable based on typical stale-listing flexibility.
- 4 sale attempts since 5y ago with the ask held roughly flat each time — persistent listings suggest the price (not the market) is what's stuck; bring a comps-based counter.
- Current owner paid $70k; list at $149k implies a 113% gain — meaningful room to come down on a strong offer.
Risks & watch-outs
- Climate carrying-cost: severe wind risk, 99% chance of damaging wind over 30y — expect insurance premiums to compound above CPI over the hold.
Questions for the listing agent
- Is there a deadline driving the sale (1031 exchange, divorce, estate, relocation)? That informs how much negotiation room exists.
- Schools are F-rated, which usually means shorter tenancies and higher turnover. Who's the typical renter profile here, and what's been the actual vacancy rate?
- Crime grade is D in this area — have there been break-ins, vandalism, or insurance claims at this property in the last 3 years? What carrier currently insures it and at what premium?
- The area grade is low — what's the realistic commute time and amenity access for the typical tenant pool here? Any planned neighborhood developments (good or bad) we should know about?
- What's the average days-on-market for RENTAL listings here right now (not sales)? A rising rental-DOM trend means longer vacancies and softer asking-rent achievability than the comps imply.
- What's the recent tenant-quality profile in this submarket — average credit score on applications, eviction rate, late-payment / NSF rate, and stable-employment percentage? A property-management company in the area should have these aggregated.
- How much new for-sale + rental construction is in the pipeline within 1–3 miles? Heavy new supply typically softens prices + rents 12–24 months out; constrained supply supports both.
Investment metrics
- 1% rule
- 0.94% ✗
- Cap rate
- 7.29%
- Cash-on-cash
- 3.56%
- DSCR
- 1.16
- GRM
- 8.9
CMA / ARV
- ARV (median comp)
- $155,315
- List price
- $149,000
- Delta
- -4.07%
- Verdict
- FAIR
- Comps
- 11 within 1.0 mi
Projected returns pro-forma
-3.0% appreciation · 3.85% rent growth · sell at horizon
- IRR
- -9.8%
- Equity multiple
- 0.64×
- Total profit
- $-15,071
- Equity at exit
- $22,216
- IRR
- 0.7%
- Equity multiple
- 1.05×
- Total profit
- $2,014
- Equity at exit
- $12,883
Cash invested: $41,720 (down + closing). Projections, not guarantees.
Landlord ↔ Tenant lean methodology
- Overall (STATE)
- 87 Strongly Landlord-Friendly
- State Florida
- 87 Strongly Landlord-Friendly · R+3
- County
- — inherits STATE
- City
- — inherits STATE
ZIP-level market 32506
- Home prices YoY
- -22.5%
- Rents YoY
- 3.9%
- Active inventory
- 270
- Price-to-rent
- 8.9×
Monthly cashflow live
- Estimated rent
- $1,398 high interval (Pro) →
- Mortgage (P&I)
- −$781
- Tax from tax record
- −$137 /mo · $1,645/yr
- Insurance
- −$62
- HOA
- −$0
- Vacancy / Maint / Mgmt
- −$294
- Net cashflow
- $124
Break-even live
Sensitivity live
| Price | -10% $208 | -5% $166 | +0% $124 | +5% $81 | +10% $39 |
|---|---|---|---|---|---|
| Rent | -10% $13 | -5% $68 | +0% $124 | +5% $179 | +10% $234 |
| Rate | -1.0pp $199 | -0.5pp $162 | base $124 | +0.5pp $85 | +1.0pp $46 |
UW: 25.0% down · 7.5% · 30yr · 1.5% tax · 5.0% vac · 8.0% maint · 8.0% mgmt
Financing live
Cash to close
- Down payment
- $37,250
- Closing costs
- $4,470
- Reserves months
- —
- Total cash needed
- —
Loan-product check · same deal, 3 products live
Conventional
25% down · 7.5% · 30yr
- Down + closing
- —
- Monthly P&I
- —
- Monthly cashflow
- —
- DSCR
- —
- Eligible?
- —
Personal DTI + credit; lowest rate.
DSCR
20% down · 8.5% · 30yr
- Down + closing
- —
- Monthly P&I
- —
- Monthly cashflow
- —
- DSCR
- —
- Eligible?
- —
No personal income docs; deal must DSCR.
Hard money
10% down · 12.0% · 12mo
- Down + closing
- —
- Monthly P&I
- —
- Monthly cashflow
- —
- DSCR
- —
- Eligible?
- —
Short-term bridge; refi at stabilization.
Rent comps 13 comps
| Address | Beds | Baths | Sqft | Rent | $/sqft | DOM | Units | Dist |
|---|---|---|---|---|---|---|---|---|
| 5501 Mayfair Dr Pensacola, FL | 3.0 | 1.0 | 912 | $1,295 | $1.42 | 24d | 1 | 0.29mi |
| 908 N 57th Ave Pensacola, FL | 1.0 | 1.0 | 740 | $1,195 | $1.61 | 24d | 1 | 0.33mi |
| 316 Teakwood Cir Pensacola, FL | 2.0 | 1.5 | 1024 | $1,350 | $1.32 | 14d | 1 | 0.43mi |
| 4600 Twin Oaks Dr Pensacola, FL | 1.0–2.0 | 1.0 | 838 | $1,499 | $1.79 | 14d | 29 | 0.74mi |
| 4519 Martha Ave Pensacola, FL | 3.0 | 1.0 | 1104 | $1,600 | $1.45 | 24d | 1 | 0.89mi |
| 190 N Old Corry Field Rd Pensacola, FL | 1.0–2.0 | 1.0–2.0 | 915 | $1,174 | $1.28 | 14d | 3 | 1.10mi |
| 7200 Lillian Hwy Pensacola, FL | 2.0 | 1.0 | 675 | $1,200 | $1.78 | 14d | 11 | 1.10mi |
| 101 Vanderbilt Rd Pensacola, FL | 3.0 | 2.0 | 1104 | $1,850 | $1.68 | 21d | 1 | 1.23mi |
| 346 Quigley Rd Pensacola, FL | 3.0 | 2.0 | 1021 | $1,500 | $1.47 | 24d | 1 | 1.36mi |
| 542 S 72nd Ave Unit C Pensacola, FL | 3.0 | 2.0 | 1300 | $1,400 | $1.08 | 24d | 1 | 1.41mi |
| 585 S 72nd Ave Pensacola, FL | 1.0–2.0 | 1.0 | 862 | $1,300 | $1.51 | 24d | 3 | 1.43mi |
| 7071 Lake Joanne Dr Unit 2C Pensacola, FL | 3.0 | 2.0 | 1300 | $1,400 | $1.08 | 14d | 1 | 1.43mi |
| 7071 Lake Joanne Dr Unit 2A Pensacola, FL | 3.0 | 2.0 | 1300 | $1,400 | $1.08 | 24d | 1 | 1.43mi |
Listing history 12 events
-
2026-05-08$149,000 Active 930-char remark
-
2025-05-10historical $1,295
-
2025-05-07$1,295
-
2021-04-13historical
-
2021-04-06status Active
-
2021-04-06price $62,000
-
2021-03-26historical
-
2021-03-25$69,000 Active
-
2005-11-22soldstatus $70,000
-
1996-11-18soldstatus $54,800
-
1996-11-01soldstatus $54,800
-
1993-08-01soldstatus $9,500
ⓘ Source: listings_history table (triggers on properties + properties_extension) + one-shot
backfill from property_details.listing_events for pre-trigger history.
Tax reassessment forecast FL · Resets to sale price
- Current annual tax
- $1,645 · $137/mo
- Projected year-2 tax
- $1,645 · $137/mo
- Expected delta
- $0/yr ($0/mo · 0.0%)
ⓘ Screening estimate from a state-policy table — verify with the county assessor before closing.
Climate risk First Street
- Flood 1/10 Low FEMA zone X (unshaded) · 0% chance over 30 yrs
- Wildfire 1/10 Low
- Heat 9/10 Extreme
- Wind 9/10 Extreme 99% chance of damaging wind over 30 yrs
- Air quality 1/10 Low 0 unhealthy d/yr today · 0 by 30 yrs out
Nearby sold comps map
Loading sold comps map…
Walkable amenities ~0.75 mi
Loading nearby amenities…
Taxation est. · year 1
- Rental income
- $16,773
- − Mortgage interest
- −$8,346
- − Property taxes
- −$1,645
- − Insurance
- −$745
- − Repairs & maintenance
- −$1,342
- − Management
- −$1,342
- − Depreciation
- −$4,335
- Taxable loss
- −$982
- Est. tax savings @ 24.0%
- +$236
- After-tax cash flow
- $1,720/yr
For passive investors: Depreciation is non-cash, so a rental often shows a tax loss while cash-flowing — sheltering income. Rental losses are passive: they offset passive income freely, and up to $25,000/yr can offset ordinary (W-2) income if you actively participate and your MAGI is under $100k (phasing out to $0 by $150k); unused losses carry forward. On sale, claimed depreciation is recaptured at up to 25%, and gains may owe capital-gains tax (a 1031 exchange can defer both). Figures are a year-1 estimate at your 24.0% rate — not tax advice; consult a CPA.
Schools (NCES district)
- District
- Escambia
- NCES district ID
- 1200510
- Math proficiency
- 40% ▼ -9.00%
- Reading proficiency
- 45% ▼ -4.00%
- Median HH income
- $44,649
- Composite
- 36.04/100
- National rank
- #4773
- State rank
- #56 of 73 in FL
Livability — West Pensacola
- Score
- 66/100
- State rank
- #629
- US rank
- #12275
Category grades
Schools grade is shown separately in the Schools card above.
Census & demographics
- Census place
- West Pensacola, FL
- County
- Escambia County · 301,722 people
- Metro
- Pensacola-Ferry Pass-Brent, FL
- Population (ZIP)
- 34,549
- Household income
- $62,486
- Rent vs Own
- Severe rent burden
- 1359.0
Population outlook (Escambia County) Hauer SSP2
- Today (2025)
- 334,637 people
- By 2030
- 345,779 · +3.3%
- By 2040
- 364,828 · +9.0%
- By 2050
- 378,514 · +13.1%
- By 2075
- 403,220 · +20.5%
- By 2100
- 386,125 · +15.4%
Race, ethnicity, and origin ACS 2023
- Neighborhood character
- Diverse neighborhood (Simpson 0.60)
- Race & ethnicity
- White 60% Black 18% Two or more races 11% Hispanic / Latino 6% Asian 6%
- Hispanic origin (detail)
- Mexican 3%
- Common ancestry
- Lithuanian 4% Slovak 2% Italian 2%
- Foreign-born
- 9% · Canada, China, Vietnam
- Languages at home
- 89% English-only · Spanish 4% Tagalog/Filipino 2% Other Indo-European 1%
Political lean MEDSL · Escambia
- 2024 margin
- R (+19.5) · D 39.7% · R 59.2% · Other 1.1%
- 2008→2024 swing
- -0.2pp no change · 2008: -19.3pp · 2024: -19.5pp
- All cycles
- 2024: R+19.5 2020: R+15.1 2016: R+20.6 2012: R+20.6 2008: R+19.3
Not yet ingested
- Civics
- —
Market trends
- HPI YoY
- ▼ -71.86%
- Current HPI
- 247.6085
- Rent YoY
- ▲ 3.85%
- Metro
- Pensacola-Ferry Pass-Brent, FL
- State GDP YoY
- ▲ 3.28%
- F500 in state
- 36
Industry mix (Fortune 500 HQ in FL)
| Industry | F500 HQs | Revenue |
|---|---|---|
| Industrial Technology | 2 | $29B |
|
||
| Insurance | 2 | $17B |
|
||
| Retail | 1 | $60B |
|
||
| Technology Distribution | 1 | $58B |
|
||
| Homebuilding | 1 | $35B |
|
||
| Technology Manufacturing | 1 | $35B |
|
||
Price history
+1468.4% since first listed13 events — show timeline
- 2026-05-23 Pending — PARMLS
- 2026-05-08 Listed $149,000 PARMLS
- 2025-05-10 Rental Removed $1,295 PARMLS
- 2025-05-07 Listed for Rent $1,295 PARMLS
- 2021-04-13 Listing Removed — PARMLS
- 2021-04-06 Relisted — PARMLS
- 2021-04-06 Price Changed $62,000 PARMLS
- 2021-03-26 Listing Removed — PARMLS
- 2021-03-25 Listed $69,000 PARMLS
- 2005-11-22 Sold (Public Records) $70,000 Public Records
- 1996-11-18 Sold (Public Records) $54,800 Public Records
- 1996-11-01 Sold (Public Records) $54,800 Public Records
- 1993-08-01 Sold (Public Records) $9,500 Public Records
Property tax history
+6.7%/yrLatest (2025): $1,645 · +16.4% YoY. Source: county tax records.
Cash-flow waterfall
monthlySold comps — $/sqft
last 12 mo · ≤1 miLoading sold comps…