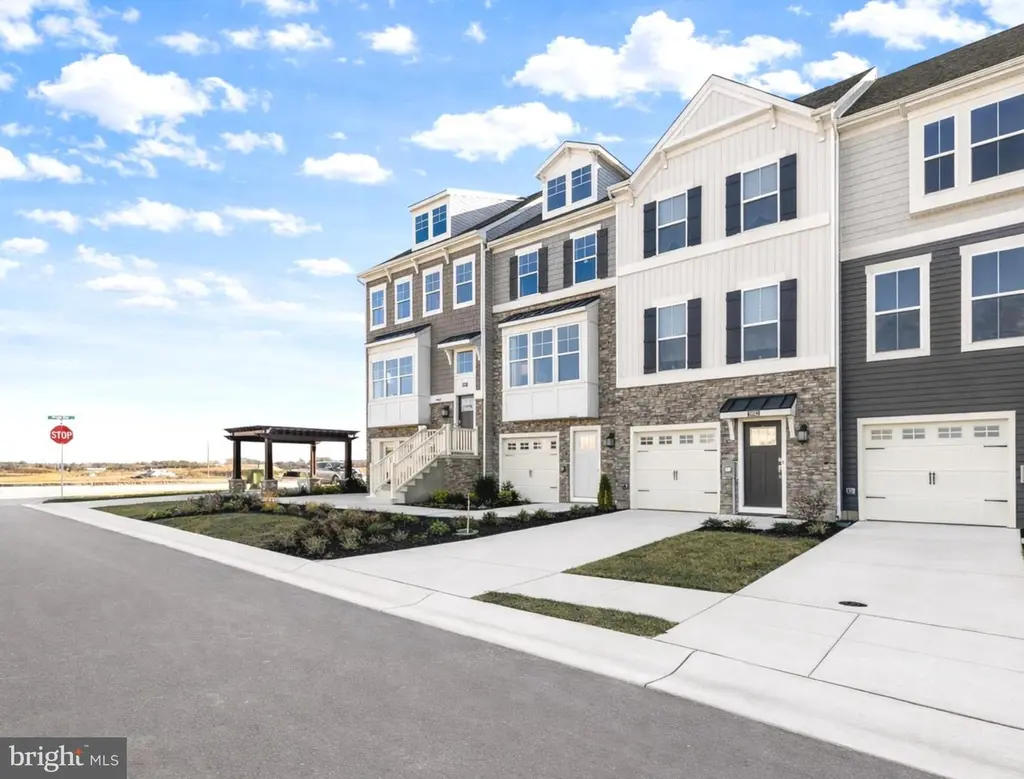
29851 Bankert Dr · Millsboro, DE
Flood risk No data
- FEMA flood zone
- —
- Chance of flooding over 30 yrs
- —
- Est. flood insurance / yr
- —
Fire risk No data
- Est. fire insurance / yr
- —
Heat risk No data
- Hot days now (above threshold)
- —
- Hot days in 30 yrs
- —
Wind risk No data
- Chance of severe wind over 30 yrs
- —
Air-quality risk No data
- Unhealthy air days now
- —
- Unhealthy air days in 30 yrs
- —
Risk factors via First Street. Map © Google.
Why this score? — see what drove the D grade
The composite is a weighted blend of 9 inputs, each scored 0–100. Each bar is that input's sub-score; the figure is the points it added to the 100-point composite (weight × sub-score).
- Cash flow +13.3/30.0
- ARV discount +9.7/15.0
- DSCR +4.0/10.0
- Condition / age +4.0/5.0
- Livability +3.3/5.0
- 1% rule +3.1/10.0
- Schools +2.9/10.0
- Rent growth +2.5/5.0
- Appreciation +0.0/10.0
$289,000
🖨 Deal sheet (PDF) 📄 Offer letter ✓ Due diligence
Listing remarks
3 bedrooms. 3.5 baths. Three finished levels. And a lifestyle you don’t have to wait for. Low-maintenance living meets resort-style amenities at Plantation Lakes South Shore Townhomes in Millsboro—home to a championship golf course, lively social scene, and easy access to the Delaware beaches. This thoughtfully designed home gives you space where it matters most. The entry level features a private bedroom and full bath—perfect for guests, a quiet home office, or a little extra separation when you need it. Upstairs, the main living area is bright, open, and made for everyday living. The kitchen, dining, and living spaces flow together seamlessly, with Luna Pearl countertops
Key facts
- Fitness center
- Private bedroom
- Full bath
Tags
Property features AI
Finance
- Other: Not in a federal flood zone; Living area reported as estimated finished area above grade
- HOA & community: Monthly HOA fee; HOA amenities include basketball courts, clubhouse, fitness center, golf club, jogging/walking path, outdoor pool, tennis courts, and playground
Exterior
- Parking: Front-entry attached garage (1 garage space); Driveway parking (1 space), total 2 parking spaces
- Utilities: Public water; Public sewer; Electric cooling fuel; Natural gas heating and hot water
- Home design: Interior townhouse/rowhouse; Fee simple ownership
- Construction: Vinyl siding; Concrete perimeter foundation; Construction completed; Estimated year built
- Exterior features: Community pool; In city limits; No tidal water; Above grade and below grade structures noted
Interior
- Bedrooms: Two bedrooms on the upper level; One bedroom on the lower level (entry level)
- Bathrooms: Three full bathrooms; One half bathroom on the main level; Two full bathrooms on the upper level; One full bathroom on the lower level
- Heating & cooling: Forced air heating; Central A/C (electric); Natural gas hot water with tankless system
- Interior features: Entry level bedroom; Construction completed; property in excellent condition
Neighborhood map
What this means for you Summary
Snapshot
- This is a 3-bed/3.5-bath townhouse listed at $289k. Condition is rated good.
Deal economics
- At list price, monthly cash flow is $0 ($5/yr) — positive.
- The deal already cash-flows at list — no discount required.
- To meet the 1% rule (rent ≥ 1% of price), the offer needs to be $235k (18.7% below list).
- Recommended offer: $235k (18.7% below list) — sets the bar for 1% rule.
- Cap rate 6.3% vs local median 3.3% in Millsboro — top-decile yield for the area; either an underpriced asset or a hidden risk that comps aren't pricing in. Stress-test before assuming the spread holds.
Location & tenants
- Location reads 66/100 on livability (#44 in DE) — a middle-class / working-renter tenant base. Strengths: health & safety A+, housing A, cost of living B+; Watch: crime D-, amenities D-, commute F.
- Indian River School District (rural): math 25% / reading 41% proficiency, ranked #14 of 26 in DE (top 54%) — families likely to look elsewhere, expect single-tenant / working-renter base with shorter leases.
- Zoned schools: East Millsboro Elementary School (math 24% / reading 40%, grade F, #44 of 105 statewide, top 46%, 815 students, 0% FRL); Millsboro Middle School (math 24% / reading 42%, grade F, #14 of 36 statewide, top 37%, 771 students, 0% FRL); Sussex Central High School (math 23% / reading 42%, grade F, #24 of 40 statewide, top 59%, 2,039 students, 0% FRL) — zoned schools average 0% FRL vs 49% district-wide (49 pts lower); this property's tenant base skews higher-income than the district average.
- Market conditions: 870 active listings in the ZIP; 6 comparable units currently listed for rent nearby; rentals lingering (median 46d on market — plan ~5-8 weeks vacancy on turnover, expect pricing pressure); 50% of comp listings sitting > 30 days — soft ceiling on asking rent; solid renter incomes; 4,354 units permitted in Sussex County in 2024 (344 in 5+ unit buildings).
- This rent runs 36% of the median local income ($78k/yr) — at the standard rent-burdened threshold; future hikes will face affordability resistance.
Forward outlook
- Local home prices are declining (-3.0%/yr); year-one equity from $2k of loan paydown is wiped out by about $9k of value loss. Plan a longer hold.
- Sussex County population projected at +25% by 2050 — long-run rental-demand tailwind backs the buy-and-hold thesis.
Negotiation context
- Only 10 days on market — expect competitive offers; lowballing is unlikely to land.
Questions for the listing agent
- What does the HOA fee cover, when was the last increase, and are there any pending special assessments or reserve-fund shortfalls?
- Is there a deadline driving the sale (1031 exchange, divorce, estate, relocation)? That informs how much negotiation room exists.
- Crime grade is D in this area — have there been break-ins, vandalism, or insurance claims at this property in the last 3 years? What carrier currently insures it and at what premium?
- The area grade is low — what's the realistic commute time and amenity access for the typical tenant pool here? Any planned neighborhood developments (good or bad) we should know about?
- What's the average days-on-market for RENTAL listings here right now (not sales)? A rising rental-DOM trend means longer vacancies and softer asking-rent achievability than the comps imply.
- What's the recent tenant-quality profile in this submarket — average credit score on applications, eviction rate, late-payment / NSF rate, and stable-employment percentage? A property-management company in the area should have these aggregated.
- How much new for-sale + rental construction is in the pipeline within 1–3 miles? Heavy new supply typically softens prices + rents 12–24 months out; constrained supply supports both.
Investment metrics
- 1% rule
- 0.81% ✗
- Cap rate
- 6.29%
- Cash-on-cash
- 0.01%
- DSCR
- 1.00
- GRM
- 10.2
CMA / ARV
- ARV (median comp)
- $303,569
- List price
- $289,000
- Delta
- -4.80%
- Verdict
- FAIR
- Comps
- 20 within 1.0 mi
Show comp detail 12 sales within ~0.75 mi
| Address | Dist | Beds/Ba | Sqft | Sold | Price | $/sf | Match |
|---|---|---|---|---|---|---|---|
| 29878 Bankert Dr | 0.05mi | 3/3.5 | 1,837 (0%) | 1mo | $289,990 | $158 | 97 |
| 29859 Bankert Dr | 0.01mi | 3/3.5 | 1,837 (0%) | 4mo | $299,990 | $163 | 96 |
| 29866 Bankert Dr | 0.03mi | 3/3.5 | 1,837 (0%) | 4mo | $295,000 | $161 | 95 |
| 29475 Oxford Dr | 0.09mi | 3/3.5 | 1,837 (0%) | 1mo | $285,000 | $155 | 95 |
| 29882 Bankert Dr | 0.05mi | 3/3.5 | 1,837 (0%) | 4mo | $283,221 | $154 | 94 |
| 29481 Oxford Dr | 0.10mi | 3/3.5 | 1,837 (0%) | 2mo | $306,383 | $167 | 94 |
| 29857 Bankert Dr | 0.01mi | 3/2.0 | 1,837 (0%) | 4mo | $299,990 | $163 | 90 |
| 24804 Wye Mill Ln | 0.06mi | 3/3.0 | 2,095 (+14%) | 1mo | $334,490 | $160 | 71 |
| 24802 Wye Mill Ln | 0.06mi | 3/3.0 | 2,095 (+14%) | 2mo | $337,000 | $161 | 70 |
| 19185 Sandstone Ln | 0.43mi | 3/2.5 | 1,908 (+4%) | 2mo | $305,000 | $160 | 68 |
| 30111 Plantation Dr | 0.66mi | 3/3.0 | 1,800 (-2%) | 2mo | $280,000 | $156 | 62 |
| 30112 Plantation Dr Unit A1-3 | 0.68mi | 3/2.5 | 1,600 (-13%) | 2mo | $275,000 | $172 | 41 |
Match score weights: distance 35% · size 25% · config 20% · recency 20%. Top-matched comps best support the ARV.
Projected returns pro-forma
-3.0% appreciation · 3.0% rent growth · sell at horizon
- IRR
- -16.3%
- Equity multiple
- 0.42×
- Total profit
- $-46,853
- Equity at exit
- $43,091
- IRR
- -8.1%
- Equity multiple
- 0.49×
- Total profit
- $-40,970
- Equity at exit
- $24,987
Cash invested: $80,920 (down + closing). Projections, not guarantees.
Landlord ↔ Tenant lean methodology
- Overall (STATE)
- 70 Landlord-Friendly
- State Delaware
- 70 Landlord-Friendly · D+7
- County
- — inherits STATE
- City
- — inherits STATE
ZIP-level market 19966
- Home prices YoY
- -6.4%
- Active inventory
- 870
- Price-to-rent
- 10.2×
Monthly cashflow live
- Estimated rent
- $2,351 high interval (Pro) →
- Mortgage (P&I)
- −$1,516
- Tax from tax record
- −$49 /mo · $585/yr
- Insurance
- −$120
- HOA
- −$172
- Vacancy / Maint / Mgmt
- −$494
- Net cashflow
- $0
Break-even live
Sensitivity live
| Price | -10% $164 | -5% $82 | +0% $0 | +5% $-412 | +10% $-512 |
|---|---|---|---|---|---|
| Rent | -10% $-185 | -5% $-92 | +0% $0 | +5% $93 | +10% $186 |
| Rate | -1.0pp $146 | -0.5pp $74 | base $0 | +0.5pp $-74 | +1.0pp $-151 |
UW: 25.0% down · 7.5% · 30yr · 1.5% tax · 5.0% vac · 8.0% maint · 8.0% mgmt
Financing live
Cash to close
- Down payment
- $72,250
- Closing costs
- $8,670
- Reserves months
- —
- Total cash needed
- —
Loan-product check · same deal, 3 products live
Conventional
25% down · 7.5% · 30yr
- Down + closing
- —
- Monthly P&I
- —
- Monthly cashflow
- —
- DSCR
- —
- Eligible?
- —
Personal DTI + credit; lowest rate.
DSCR
20% down · 8.5% · 30yr
- Down + closing
- —
- Monthly P&I
- —
- Monthly cashflow
- —
- DSCR
- —
- Eligible?
- —
No personal income docs; deal must DSCR.
Hard money
10% down · 12.0% · 12mo
- Down + closing
- —
- Monthly P&I
- —
- Monthly cashflow
- —
- DSCR
- —
- Eligible?
- —
Short-term bridge; refi at stabilization.
Rent comps 6 comps
| Address | Beds | Baths | Sqft | Rent | $/sqft | DOM | Units | Dist |
|---|---|---|---|---|---|---|---|---|
| 29793 Oakwood Ln Millsboro, DE | 3.0 | 3.5 | 1837 | $2,350 | $1.28 | 45d | 1 | 0.05mi |
| 24852 Wye Mill Ln Millsboro, DE | 3.0 | 3.5 | 1878 | $2,250 | $1.20 | 45d | 1 | 0.07mi |
| 29369 Oxford Dr Millsboro, DE | 3.0 | 3.5 | 1837 | $1,900 | $1.03 | 22d | 1 | 0.11mi |
| 29273 Oxford Dr Millsboro, DE | 4.0 | 3.5 | 2560 | $2,600 | $1.02 | 15d | 1 | 0.28mi |
| 20873 Brunswick Ln Millsboro, DE | 3.0 | 2.5 | 2400 | $2,300 | $0.96 | 22d | 1 | 0.67mi |
| 20559 Asheville Dr Millsboro, DE | 2.0 | 2.5 | 1300 | $1,850 | $1.42 | 45d | 1 | 0.84mi |
HOA detail
- Monthly dues
- $172 · $2,064/yr
Listing history 4 events
-
2026-05-11status Pending 2078-char remark
-
2026-05-06price $289,000 2078-char remark
-
2026-05-01$297,000 Active 2078-char remark
-
2025-12-22soldstatus $1,671,471
ⓘ Source: listings_history table (triggers on properties + properties_extension) + one-shot
backfill from property_details.listing_events for pre-trigger history.
Tax reassessment forecast DE · Partial reset (capped growth)
- Current annual tax
- $585 · $49/mo
- Projected year-2 tax
- $1,130 · $94/mo
- Expected delta
- +$546/yr (+$45/mo · 93.4%)
ⓘ Screening estimate from a state-policy table — verify with the county assessor before closing.
Nearby sold comps map
Loading sold comps map…
Walkable amenities ~0.75 mi
Loading nearby amenities…
Taxation est. · year 1
- Rental income
- $28,209
- − Mortgage interest
- −$16,188
- − Property taxes
- −$585
- − Insurance
- −$1,445
- − Repairs & maintenance
- −$2,257
- − Management
- −$2,257
- − HOA
- −$2,064
- − Depreciation
- −$8,407
- Taxable loss
- −$4,993
- Est. tax savings @ 24.0%
- +$1,198
- After-tax cash flow
- $1,204/yr
For passive investors: Depreciation is non-cash, so a rental often shows a tax loss while cash-flowing — sheltering income. Rental losses are passive: they offset passive income freely, and up to $25,000/yr can offset ordinary (W-2) income if you actively participate and your MAGI is under $100k (phasing out to $0 by $150k); unused losses carry forward. On sale, claimed depreciation is recaptured at up to 25%, and gains may owe capital-gains tax (a 1031 exchange can defer both). Figures are a year-1 estimate at your 24.0% rate — not tax advice; consult a CPA.
Condition & rehab AI · 12 photos
This townhouse is in good condition with a good condition score of 80. It is move-in ready with minimal repairs and maintenance needed. The home has a good curb appeal and is located in a desirable community with resort-style amenities.
Value-add opportunities
- Both Painting the exterior and interior walls — Fresh paint can enhance curb appeal and interior aesthetics
- Both Landscaping improvements — Enhanced landscaping can improve curb appeal and attract potential buyers
- Both Upgrading the flooring in the kitchen and bathrooms — Modern flooring can improve the overall look and feel of the home
Renovation cost estimate screening
Value-add ROI direction
- Both Painting the exterior and interior walls — Fresh paint can enhance curb appeal and interior aesthetics ↑
- Both Landscaping improvements — Enhanced landscaping can improve curb appeal and attract potential buyers ↑
- Both Upgrading the flooring in the kitchen and bathrooms — Modern flooring can improve the overall look and feel of the home ↑
ⓘ Cost ranges are severity-bucket heuristics (US national rule-of-thumb). Get contractor quotes + a written scope before underwriting a rehab budget.
Schools (NCES district)
- District
- Indian River School District
- NCES district ID
- 1000680
- Math proficiency
- 25% ▼ -27.00%
- Reading proficiency
- 41% ▼ -17.00%
- Median HH income
- $53,838
- Composite
- 28.99/100
- National rank
- #6620
- State rank
- #14 of 26 in DE
Livability — Millsboro
- Score
- 66/100
- State rank
- #44
- US rank
- #12135
Category grades
Schools grade is shown separately in the Schools card above.
Census & demographics
- Census place
- Millsboro, DE
- County
- Sussex County · 82,708 people
- City population
- 35,884
- Metro
- Salisbury, MD-DE
- Population (ZIP)
- 35,884
- Household income
- $78,305
- Rent vs Own
- Severe rent burden
- 464.0
Population outlook (Sussex County) Hauer SSP2
- Today (2025)
- 248,853 people
- By 2030
- 264,464 · +6.3%
- By 2040
- 290,980 · +16.9%
- By 2050
- 311,259 · +25.1%
- By 2075
- 352,488 · +41.6%
- By 2100
- 367,406 · +47.6%
Race, ethnicity, and origin ACS 2023
- Neighborhood character
- Predominantly White (74%)
- Race & ethnicity
- White 74% Hispanic / Latino 11% Black 8% Two or more races 7% Native American 3% Asian 1%
- Hispanic origin (detail)
- Mexican 3%
- Common ancestry
- Romanian 4% Slovak 2% Serbian 1%
- Foreign-born
- 8% · Canada, China
- Languages at home
- 88% English-only · Spanish 9% Other Indo-European 1%
Political lean MEDSL · Sussex
- 2024 margin
- R (+11.0) · D 43.9% · R 54.9% · Other 1.2%
- 2008→2024 swing
- -2.4pp toward R · 2008: -8.6pp · 2024: -11.0pp
- All cycles
- 2024: R+11.0 2020: R+11.2 2016: R+22.0 2012: R+13.0 2008: R+8.6
Not yet ingested
- Civics
- —
Market trends
- HPI YoY
- ▼ -18.26%
- Current HPI
- 268.5609
- Rent YoY
- —
- Metro
- Salisbury, MD-DE
- State GDP YoY
- —
- F500 in state
- 0
Price history
-82.7% since first listed4 events — show timeline
- 2026-05-11 Pending — BRIGHT MLS
- 2026-05-06 Price Changed $289,000 BRIGHT MLS
- 2026-05-01 Listed $297,000 BRIGHT MLS
- 2025-12-22 Sold (Public Records) $1,671,471 Public Records
Property tax history
+465.6%/yrLatest (2025): $585 · +465.6% YoY. Source: county tax records.
Cash-flow waterfall
monthlySold comps — $/sqft
last 12 mo · ≤1 miLoading sold comps…