123 W School St · Linden, TN
Flood risk 6/10 · Moderate
- FEMA flood zone
- X (unshaded)
- Chance of flooding over 30 yrs
- 0.27%
- Est. flood insurance / yr
- $473 – $860
Fire risk 4/10 · Minor
- Est. fire insurance / yr
- $949 – $1,763
Heat risk 6/10 · Moderate
- Hot days now (above 106°F)
- 7 days/yr
- Hot days in 30 yrs
- 21 days/yr
Wind risk 4/10 · Minor
- Chance of severe wind over 30 yrs
- 14.0%
Air-quality risk 1/10 · Minimal
- Unhealthy air days now
- 0 days/yr
- Unhealthy air days in 30 yrs
- 0 days/yr
Risk factors via First Street. Map © Google.
Why this score? — see what drove the B+ grade
The composite is a weighted blend of 9 inputs, each scored 0–100. Each bar is that input's sub-score; the figure is the points it added to the 100-point composite (weight × sub-score).
- Cash flow +30.0/30.0
- 1% rule +10.0/10.0
- DSCR +10.0/10.0
- Appreciation +9.1/10.0
- ARV discount +7.5/15.0
- Livability +3.2/5.0
- Rent growth +2.5/5.0
- Condition / age +2.5/5.0
- Schools +1.5/10.0
$59,900
🖨 Deal sheet 📄 Offer letter ✓ Due diligence
Listing remarks
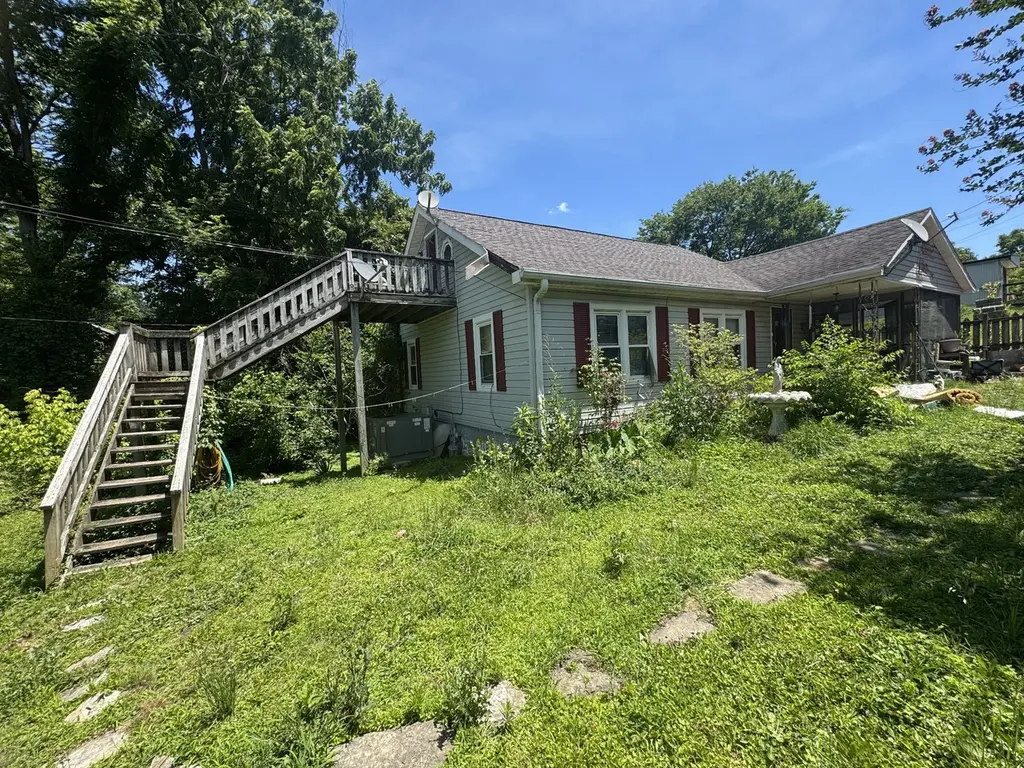
Location, location, location! Situated in the heart of Linden, TN, this property offers one of the best locations in town with a spacious lot and large yard that provides plenty of room for gardening, outdoor entertaining, children to play, or future improvements. The home itself needs work and is being sold as-is, but for the right buyer, it presents an opportunity to renovate, remodel, or create something truly special. What you see is what you get—a home with potential sitting on a beautiful piece of property in a highly desirable location. If you've been searching for a place where the land and location do most of the talking, this is one worth seeing. Home is selling as-is with a
Key facts
- 0.28 acre lot
- Built 1950
- Listed 4 days
Property features AI
Finance
- Other: Living area approximately 1,069 square feet; Year built: existing (per assessor)
Exterior
- Parking: No covered parking reported; No total parking spaces reported
- Utilities: Public water; Public sewer
- Home design: Single-family residence; One story; Residential property
- Construction: Vinyl siding
- Exterior features: Lot roughly 0.28 acre with irregular dimensions (118' x 90' x 125' x 102'); Water available
Interior
- Kitchen: Refrigerator, Freezer
- Bedrooms: 3 bedrooms (all on the main level)
- Flooring: Carpet; Vinyl
- Bathrooms: 2 full bathrooms
- Heating & cooling: Central heating; Central air conditioning
- Interior features: Unfinished basement; Dryer, Freezer, Refrigerator, Washer
- Laundry & utility: Washer and Dryer
Neighborhood map
What this means for you Summary
Snapshot
- This is a 3-bed/1.0-bath single-family listed at $60k.
Deal economics
- At list price, monthly cash flow is $519 ($6k/yr) — positive.
- The deal already cash-flows at list — no discount required.
- Meets the 1% rule at list price ($1k rent vs $60k).
Location & tenants
- Location reads 65/100 on livability (#147 in TN) — a middle-class / working-renter tenant base. Strengths: cost of living A+, housing A+, crime B; Watch: health & safety C-, amenities F, commute F.
- Perry County (rural): math 17% / reading 21% proficiency, ranked #124 of 139 in TN (top 89%) — low school quality limits family demand, transient renter base, plan for 1-2y turnover.
- Zoned schools: Linden Elementary (math 22% / reading 27%, grade F, #546 of 952 statewide, top 61%, 303 students, 0% FRL); Perry County High School (math 2% / reading 12%, grade F, #294 of 332 statewide, top 91%, 294 students, 0% FRL) — zoned schools average 0% FRL vs 59% district-wide (59 pts lower); this property's tenant base skews higher-income than the district average.
- Market conditions: 137 active listings in the ZIP; 12 units permitted in Perry County in 2024 (0 in 5+ unit buildings).
Forward outlook
- In year one you build about $5k of equity ($414 loan paydown + $5k appreciation (8.2% local appreciation)).
- Perry County population projected at -13% by 2050 — secular population decline; favor cash flow + early exit over multi-decade hold.
- At projected returns (8.2% appreciation + 3.0% rent growth), your $17k cash investment doubles in ~2 years — after that, you're playing with house money.
- By year 7, paydown + projected appreciation supports a ~$36k cash-out refi (75% LTV) — recoverable capital for the next deal without selling this one.
Negotiation context
- Only 4 days on market — expect competitive offers; lowballing is unlikely to land.
Risks & watch-outs
- Watch-outs: built in 1950 — expect roof / HVAC / electrical / plumbing capex.
- Climate carrying-cost: major flood risk; extreme-heat days projected 7→21/yr by 2055 (HVAC capex compounding) — expect insurance premiums to compound above CPI over the hold.
Questions for the listing agent
- Built in 1950 — when were the roof, HVAC, electrical panel, plumbing, and water heater last replaced?
- Is there a deadline driving the sale (1031 exchange, divorce, estate, relocation)? That informs how much negotiation room exists.
- Schools are F-rated, which usually means shorter tenancies and higher turnover. Who's the typical renter profile here, and what's been the actual vacancy rate?
- What's the average days-on-market for RENTAL listings here right now (not sales)? A rising rental-DOM trend means longer vacancies and softer asking-rent achievability than the comps imply.
- What's the recent tenant-quality profile in this submarket — average credit score on applications, eviction rate, late-payment / NSF rate, and stable-employment percentage? A property-management company in the area should have these aggregated.
- How much new for-sale + rental construction is in the pipeline within 1–3 miles? Heavy new supply typically softens prices + rents 12–24 months out; constrained supply supports both.
Investment metrics
- 1% rule
- 1.90% ✓
- Cap rate
- 16.70%
- Cash-on-cash
- 37.16%
- DSCR
- 2.65
- GRM
- 4.4
CMA / ARV
No comps found within radius.
Projected returns pro-forma
8.15% appreciation · 3.0% rent growth · sell at horizon
- IRR
- 50.3%
- Equity multiple
- 4.48×
- Total profit
- $58,306
- Equity at exit
- $46,100
- IRR
- 45.3%
- Equity multiple
- 9.62×
- Total profit
- $144,609
- Equity at exit
- $92,077
Cash invested: $16,772 (down + closing). Projections, not guarantees.
Landlord ↔ Tenant lean methodology
- Overall (STATE)
- 87 Strongly Landlord-Friendly
- State Tennessee
- 87 Strongly Landlord-Friendly · R+13
- County
- — inherits STATE
- City
- — inherits STATE
ZIP-level market 37096
- Home prices YoY
- 2.5%
- Active inventory
- 137
- Price-to-rent
- 4.4×
Monthly cashflow live
- Estimated rent
- $1,136 medium interval (Pro) →
- Mortgage (P&I)
- −$314
- Tax from tax record
- −$39 /mo · $472/yr
- Insurance
- −$25
- HOA
- −$0
- Vacancy / Maint / Mgmt
- −$239
- Net cashflow
- $519
Break-even live
UW: 25.0% down · 7.5% · 30yr · 1.5% tax · 5.0% vac · 8.0% maint · 8.0% mgmt
Financing live
Cash to close
- Down payment
- $14,975
- Closing costs
- $1,797
- Reserves months
- —
- Total cash needed
- —
Loan-product check · same deal, 3 products live
Conventional
25% down · 7.5% · 30yr
- Down + closing
- —
- Monthly P&I
- —
- Monthly cashflow
- —
- DSCR
- —
- Eligible?
- —
Personal DTI + credit; lowest rate.
DSCR
20% down · 8.5% · 30yr
- Down + closing
- —
- Monthly P&I
- —
- Monthly cashflow
- —
- DSCR
- —
- Eligible?
- —
No personal income docs; deal must DSCR.
Hard money
10% down · 12.0% · 12mo
- Down + closing
- —
- Monthly P&I
- —
- Monthly cashflow
- —
- DSCR
- —
- Eligible?
- —
Short-term bridge; refi at stabilization.
Listing history 5 events
-
2026-06-09status $59,900 Pending 4 DOM
-
2026-06-08days on market $59,900 Active 4 DOM
-
2026-06-08days on market $59,900 Active 3 DOM
-
2026-06-07remarks 693-char remark
-
2026-06-07$59,900 Active 2 DOM
ⓘ Source: listings_history table (triggers on properties + properties_extension) + one-shot
backfill from property_details.listing_events for pre-trigger history.
Tax reassessment forecast TN · Resets to sale price
- Current annual tax
- $472 · $39/mo
- Projected year-2 tax
- $472 · $39/mo
- Expected delta
- $0/yr ($0/mo · 0.0%)
ⓘ Screening estimate from a state-policy table — verify with the county assessor before closing.
Climate risk First Street
- Flood 6/10 Major FEMA zone X (unshaded) · 27% chance over 30 yrs
- Wildfire 4/10 Moderate
- Heat 6/10 Major 7 d/yr ≥106°F today · 21 d/yr by 30 yrs out
- Wind 4/10 Moderate 14% chance of damaging wind over 30 yrs
- Air quality 1/10 Low 0 unhealthy d/yr today · 0 by 30 yrs out
Nearby sold comps map
Loading sold comps map…
Walkable amenities ~0.75 mi
Loading nearby amenities…
Taxation est. · year 1
- Rental income
- $13,637
- − Mortgage interest
- −$3,355
- − Property taxes
- −$472
- − Insurance
- −$300
- − Repairs & maintenance
- −$1,091
- − Management
- −$1,091
- − Depreciation
- −$1,743
- Taxable income
- $5,586
- Est. tax owed @ 24.0%
- −$1,341
- After-tax cash flow
- $4,892/yr
For passive investors: Depreciation is non-cash, so a rental often shows a tax loss while cash-flowing — sheltering income. Rental losses are passive: they offset passive income freely, and up to $25,000/yr can offset ordinary (W-2) income if you actively participate and your MAGI is under $100k (phasing out to $0 by $150k); unused losses carry forward. On sale, claimed depreciation is recaptured at up to 25%, and gains may owe capital-gains tax (a 1031 exchange can defer both). Figures are a year-1 estimate at your 24.0% rate — not tax advice; consult a CPA.
Schools (NCES district)
- District
- Perry County
- NCES district ID
- 4703390
- Math proficiency
- 17% ▼ -10.00%
- Reading proficiency
- 21% ▼ -9.00%
- Median HH income
- $32,903
- Composite
- 15.44/100
- National rank
- #9315
- State rank
- #124 of 139 in TN
Livability — Linden
- Score
- 65/100
- State rank
- #147
- US rank
- #13244
Category grades
Schools grade is shown separately in the Schools card above.
Census & demographics
- Census place
- Linden, TN
- Population (ZIP)
- 5,851
Population outlook (Perry County) Hauer SSP2
- Today (2025)
- 7,645 people
- By 2030
- 7,424 · -2.9%
- By 2040
- 7,008 · -8.3%
- By 2050
- 6,656 · -12.9%
- By 2075
- 5,907 · -22.7%
- By 2100
- 5,253 · -31.3%
Race, ethnicity, and origin ACS 2023
- Neighborhood character
- Predominantly White (88%)
- Race & ethnicity
- White 88% Two or more races 6% Hispanic / Latino 2% Asian 2%
- Common ancestry
- Russian 2% Estonian 2% Italian 2%
- Foreign-born
- 2% · Canada
- Languages at home
- 96% English-only · Other Indo-European 4%
Political lean MEDSL · Perry
- 2024 margin
- Solid R (+69.5) · D 15.0% · R 84.5%
- 2008→2024 swing
- -60.6pp toward R · 2008: -8.9pp · 2024: -69.5pp
- All cycles
- 2024: R+69.5 2020: R+63.0 2016: R+55.0 2012: R+22.4 2008: R+8.9
Not yet ingested
- Civics
- —
Market trends
- HPI YoY
- ▲ 8.15%
- Current HPI
- 339.2223
- Rent YoY
- —
- Metro
- —
- State GDP YoY
- ▲ 2.78%
- F500 in state
- 22
Industry mix (Fortune 500 HQ in TN)
| Industry | F500 HQs | Revenue |
|---|---|---|
| Healthcare | 3 | $91B |
|
||
| Retail | 3 | $72B |
|
||
| Transportation / Logistics | 1 | $88B |
|
||
| Paper / Packaging | 1 | $19B |
|
||
| Insurance | 1 | $13B |
|
||
| Energy | 1 | $12B |
|
||
Price history
1 event — show timeline
- 2026-06-04 Listed $59,900 REALTRACS as Distributed by MLS Grid
Property tax history
-1.0%/yrLatest (2025): $472 · +0.0% YoY. Source: county tax records.
Cash-flow waterfall
monthlySold comps — $/sqft
last 12 mo · ≤1 miLoading sold comps…