 🏷️ Likely Rental
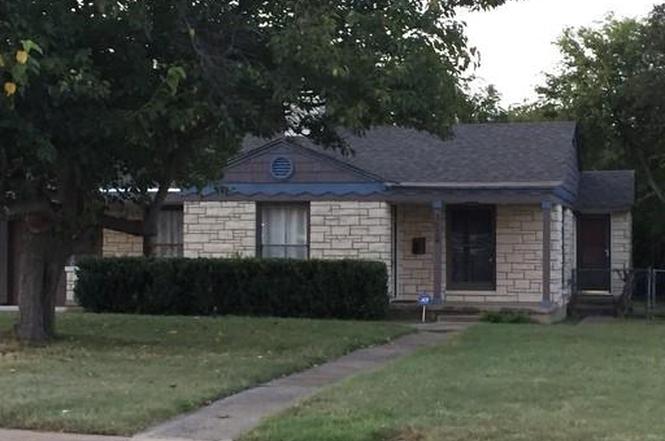
3524 W Biddison St · Fort Worth, TX
Flood risk 1/10 · Minimal
- FEMA flood zone
- X (unshaded)
- Chance of flooding over 30 yrs
- 0.0%
- Est. flood insurance / yr
- $507 – $1,088
Fire risk 1/10 · Minimal
- Est. fire insurance / yr
- $1,222 – $2,270
Heat risk 8/10 · Major
- Hot days now (above 109°F)
- 7 days/yr
- Hot days in 30 yrs
- 24 days/yr
Wind risk 6/10 · Moderate
- Chance of severe wind over 30 yrs
- 27.0%
Air-quality risk 3/10 · Minor
- Unhealthy air days now
- 2 days/yr
- Unhealthy air days in 30 yrs
- 3 days/yr
Risk factors via First Street. Map © Google.
Why this score? — see what drove the D grade
The composite is a weighted blend of 9 inputs, each scored 0–100. Each bar is that input's sub-score; the figure is the points it added to the 100-point composite (weight × sub-score).
- Cash flow +15.0/30.0
- ARV discount +7.5/15.0
- 1% rule +5.0/10.0
- DSCR +5.0/10.0
- Livability +4.0/5.0
- Rent growth +3.7/5.0
- Condition / age +2.5/5.0
- Schools +2.0/10.0
- Appreciation +0.0/10.0
$2,250
🖨 Deal sheet 📄 Offer letter ✓ Due diligence
Listing remarks
Fall in love with this precious three bedroom, two bath home, near TCU. Back room updated with new flooring. Kitchen comes with all appliances. Mosaic tile in kitchen. Full size washer and dryer hook ups. Over sized fenced backyard for your pleasure or for entertaining. Schools and shopping are within walking distance. Come take a look at this precious home, located right in the heart of Ft. Worth.
Key facts
- Updated flooring
- Mosaic tile
- Fenced backyard
Tags
Property features AI
Finance
- Other: Restrictions: No livestock and other restrictions; Possession: Subject to lease
- Financial info: Loan type noted as 'Treat As Clear'; No second mortgage
- HOA & community: No homeowners association
Exterior
- Parking: Covered parking space; Attached garage (1-car) with 14' width and 16' length; Garage door opener; 2-car single door configuration
- Security: Burglar alarm; Security service; Security system
- Utilities: City water; City sewer; No municipal utility district
- Home design: Single-family residence; One story; Residential property; Subdivision: Foster Rev Bellaire Heights Add
- Construction: Built in 1946 (preowned); Brick and rock/stone exterior; Composition roof
- Exterior features: Chain link fenced yard; Fenced property; Lot under 0.5 acre (approximately 0.297 acres); Directions: One half mile south of Bellaire near TCU; north of the WestCliff Shopping Center
Interior
- Kitchen: Dishwasher; Electric range; Microwave; Refrigerator
- Bedrooms: Three bedrooms total; Primary bedroom on main level with walk-in closet; Second primary-style bedroom on main level with built-in cabinets and walk-in closet; Third bedroom on main level with walk-in closet
- Flooring: Stone flooring; Wood flooring
- Bathrooms: Two full bathrooms
- Heating & cooling: Central heating (electric); Central air; Ceiling fans
- Interior features: Cable TV available; One living area; One dining area; Total of 5 rooms
- Laundry & utility: Utilities: City water and city sewer
Neighborhood map
What this means for you Summary
Snapshot
- This is a 3-bed/2.0-bath single-family listed at $2k.
Deal economics
- At list price, monthly cash flow is $2k ($21k/yr) — positive.
- The deal already cash-flows at list — no discount required.
- Meets the 1% rule at list price ($2k rent vs $2k).
- Cap rate 944.8% vs local median 3.9% in Fort Worth — top-decile yield for the area; either an underpriced asset or a hidden risk that comps aren't pricing in. Stress-test before assuming the spread holds.
Location & tenants
- Location reads 80/100 on livability (#49 in TX, #1,954 nationally) — a professional / high-income tenant draw. Strengths: amenities A+, cost of living A+, housing A+; Watch: schools D+, crime F.
- Fort Worth ISD (urban): math 18% / reading 28% proficiency, ranked #742 of 826 in TX (top 90%) — low school quality limits family demand, transient renter base, plan for 1-2y turnover; 73% free/reduced lunch — lower-income household profile, screen leases tightly.
- Market conditions: Rents rising fast (+4.7%/yr); 185 active listings in the ZIP; 40 comparable units currently listed for rent nearby; rentals at typical pace (median 25d on market — plan ~3-4 weeks tenant-placement turnaround); solid renter incomes; 18,938 units permitted in Tarrant County in 2024 (8,336 in 5+ unit buildings).
Forward outlook
- Local home prices are declining (-3.0%/yr); year-one equity from $16 of loan paydown is wiped out by about $68 of value loss. Plan a longer hold.
- Tarrant County population projected at +41% by 2050 — long-run rental-demand tailwind backs the buy-and-hold thesis.
- At projected returns (-3.0% appreciation + 4.7% rent growth), your $630 cash investment doubles in ~1 year — after that, you're playing with house money.
Negotiation context
- Only 2 days on market — expect competitive offers; lowballing is unlikely to land.
- 3 sale attempts since 2y ago with the ask held roughly flat each time — persistent listings suggest the price (not the market) is what's stuck; bring a comps-based counter.
Risks & watch-outs
- Watch-outs: built in 1946 — expect roof / HVAC / electrical / plumbing capex.
- Climate carrying-cost: major wind risk, 27% chance of damaging wind over 30y; extreme-heat days projected 7→24/yr by 2055 (HVAC capex compounding) — expect insurance premiums to compound above CPI over the hold.
Questions for the listing agent
- Built in 1946 — when were the roof, HVAC, electrical panel, plumbing, and water heater last replaced?
- Is there a deadline driving the sale (1031 exchange, divorce, estate, relocation)? That informs how much negotiation room exists.
- Schools are D-rated, which usually means shorter tenancies and higher turnover. Who's the typical renter profile here, and what's been the actual vacancy rate?
- Crime grade is F in this area — have there been break-ins, vandalism, or insurance claims at this property in the last 3 years? What carrier currently insures it and at what premium?
- The area grade is low — what's the realistic commute time and amenity access for the typical tenant pool here? Any planned neighborhood developments (good or bad) we should know about?
- What's the average days-on-market for RENTAL listings here right now (not sales)? A rising rental-DOM trend means longer vacancies and softer asking-rent achievability than the comps imply.
- What's the recent tenant-quality profile in this submarket — average credit score on applications, eviction rate, late-payment / NSF rate, and stable-employment percentage? A property-management company in the area should have these aggregated.
- How much new for-sale + rental construction is in the pipeline within 1–3 miles? Heavy new supply typically softens prices + rents 12–24 months out; constrained supply supports both.
Investment metrics
- 1% rule
- 99.87% ✓
- Cap rate
- 944.80%
- Cash-on-cash
- 3351.81%
- DSCR
- 150.14
- GRM
- 0.1
CMA / ARV
- ARV (on-the-fly)
- $389,640
- Comps found
- 12
Show comp detail 12 sales within ~0.75 mi
| Address | Dist | Beds/Ba | Sqft | Sold | Price | $/sf | Match |
|---|---|---|---|---|---|---|---|
| 3717 Carolyn Rd | 0.23mi | 3/2.0 | 1,183 (+3%) | 9mo | $319,000 | $270 | 77 |
| 3607 Kell St | 0.15mi | 3/1.0 | 1,023 (-11%) | 9mo | $275,000 | $269 | 64 |
| 2713 Mission St | 0.74mi | 3/2.0 | 1,136 (-1%) | 1mo | $339,000 | $298 | 63 |
| 3418 Worth Hills Dr | 0.32mi | 2/1.0 (-1) | 1,266 (+10%) | 2mo | $449,000 | $355 | 57 |
| 3541 Suffolk Dr | 0.62mi | 3/1.0 | 1,174 (+2%) | 12mo | $399,000 | $340 | 53 |
| 3458 Brady Ave | 0.46mi | 2/1.0 (-1) | 1,046 (-9%) | 4mo | $235,000 | $225 | 52 |
| 3425 Cloer Dr | 0.56mi | 3/2.0 | 1,306 (+14%) | 2mo | $480,000 | $368 | 49 |
| 3116 Wabash Ave | 0.58mi | 2/1.0 (-1) | 1,234 (+8%) | 4mo | $575,000 | $466 | 47 |
| 3229 Odessa Ave | 0.44mi | 3/1.0 | 1,315 (+15%) | 12mo | $545,000 | $414 | 41 |
| 4204 Winfield Ave | 0.69mi | 2/2.0 (-1) | 1,246 (+9%) | 16mo | $345,000 | $277 | 35 |
| 3208 Cockrell Ave | 0.64mi | 2/1.0 (-1) | 1,286 (+12%) | 7mo | $375,000 | $292 | 35 |
| 3225 Greene Ave | 0.70mi | 2/1.5 (-1) | 1,293 (+13%) | 8mo | $530,000 | $410 | 32 |
Match score weights: distance 35% · size 25% · config 20% · recency 20%. Top-matched comps best support the ARV.
Projected returns pro-forma
-3.0% appreciation · 4.67% rent growth · sell at horizon
- IRR
- —
- Equity multiple
- 184.47×
- Total profit
- $115,584
- Equity at exit
- $335
- IRR
- —
- Equity multiple
- 415.92×
- Total profit
- $261,400
- Equity at exit
- $195
Cash invested: $630 (down + closing). Projections, not guarantees.
Landlord ↔ Tenant lean methodology
- Overall (STATE)
- 87 Strongly Landlord-Friendly
- State Texas
- 87 Strongly Landlord-Friendly · R+5
- County
- — inherits STATE
- City
- — inherits STATE
ZIP-level market 76109
- Rents YoY
- 4.7%
- Active inventory
- 185
- Price-to-rent
- 0.1×
Monthly cashflow live
- Estimated rent
- $2,247 high interval (Pro) →
- Mortgage (P&I)
- −$12
- Tax est. 1.5%
- −$3 /mo · $34/yr
- Insurance
- −$1
- HOA
- −$0
- Vacancy / Maint / Mgmt
- −$472
- Net cashflow
- $1,760
Break-even live
UW: 25.0% down · 7.5% · 30yr · 1.5% tax · 5.0% vac · 8.0% maint · 8.0% mgmt
Financing live
Cash to close
- Down payment
- $562
- Closing costs
- $68
- Reserves months
- —
- Total cash needed
- —
Loan-product check · same deal, 3 products live
Conventional
25% down · 7.5% · 30yr
- Down + closing
- —
- Monthly P&I
- —
- Monthly cashflow
- —
- DSCR
- —
- Eligible?
- —
Personal DTI + credit; lowest rate.
DSCR
20% down · 8.5% · 30yr
- Down + closing
- —
- Monthly P&I
- —
- Monthly cashflow
- —
- DSCR
- —
- Eligible?
- —
No personal income docs; deal must DSCR.
Hard money
10% down · 12.0% · 12mo
- Down + closing
- —
- Monthly P&I
- —
- Monthly cashflow
- —
- DSCR
- —
- Eligible?
- —
Short-term bridge; refi at stabilization.
Rent comps 40 comps
| Address | Beds | Baths | Sqft | Rent | $/sqft | DOM | Units | Dist |
|---|---|---|---|---|---|---|---|---|
| 3559 Norfolk Rd Fort Worth, TX | 2.0 | 1.0 | 1223 | $2,100 | $1.72 | 43d | 1 | 0.27mi |
| 3241 Odessa Ave Fort Worth, TX | 2.0 | 1.5 | 1180 | $2,600 | $2.20 | 5d | 1 | 0.41mi |
| 3324 S University Dr Unit Down Fort Worth, TX | 2.0 | 2.0 | 1312 | $1,600 | $1.22 | 5d | 1 | 0.49mi |
| 3205 Wabash Ave Fort Worth, TX | 2.0 | 1.5 | 1050 | $1,950 | $1.86 | 43d | 1 | 0.52mi |
| 3417 S University Dr Unit A Fort Worth, TX | 2.0 | 1.0 | 1059 | $1,095 | $1.03 | 5d | 1 | 0.52mi |
| 3417 S University Dr Unit D Fort Worth, TX | 2.0 | 1.0 | 900 | $1,235 | $1.37 | 43d | 1 | 0.52mi |
| 3419 S University Dr Unit D Fort Worth, TX | 2.0 | 1.0 | 900 | $1,095 | $1.22 | 17d | 1 | 0.54mi |
| 3211 Rogers Ave Fort Worth, TX | 2.0 | 1.0 | 1015 | $1,695 | $1.67 | 15d | 1 | 0.55mi |
| 3301 S University Dr Unit C Fort Worth, TX | 2.0 | 1.0 | 800 | $1,500 | $1.88 | 24d | 1 | 0.55mi |
| 3259 S University Dr Unit A Fort Worth, TX | 3.0 | 3.0 | 1490 | $2,495 | $1.67 | 43d | 1 | 0.56mi |
| 3208 S University Dr Unit The Carter 204B Fort Worth, TX | 3.0 | 2.0 | 1099 | $3,600 | $3.28 | 18d | 1 | 0.58mi |
| 3208 S University Dr Unit The Carter 306B Fort Worth, TX | 4.0 | 2.0 | 1385 | $4,800 | $3.47 | 18d | 1 | 0.58mi |
| 3208 S University Dr Unit The Carter 106B Fort Worth, TX | 3.0 | 2.0 | 1121 | $3,600 | $3.21 | 6d | 1 | 0.58mi |
| 3232 Cockrell Ave Fort Worth, TX | 2.0 | 1.0 | 1128 | $2,100 | $1.86 | 43d | 1 | 0.61mi |
| 3245 Cockrell Ave Fort Worth, TX | 2.0 | 1.0 | 1402 | $2,500 | $1.78 | 43d | 1 | 0.62mi |
| 3136 Cockrell Ave Unit 102 Fort Worth, TX | 3.0 | 3.0 | 1376 | $3,900 | $2.83 | 5d | 1 | 0.68mi |
| 2809 South Hills Ave Fort Worth, TX | 3.0 | 2.0 | 1203 | $1,650 | $1.37 | 18d | 1 | 0.71mi |
| 2809 South Hills Ave Fort Worth, TX | 3.0 | 2.0 | 1203 | $1,650 | $1.37 | 43d | 1 | 0.71mi |
| 4129 Winfield Ave Fort Worth, TX | 3.0 | 2.0 | 1465 | $2,580 | $1.76 | 3d | 1 | 0.73mi |
| 4228 Winfield Ave Fort Worth, TX | 4.0 | 2.0 | 1486 | $3,500 | $2.36 | 18d | 1 | 0.74mi |
| 3145 Waits Ave #302 Fort Worth, TX | 3.0 | 3.0 | 1245 | $3,000 | $2.41 | 24d | 1 | 0.79mi |
| 4152 Anita Ave Fort Worth, TX | 2.0 | 1.0 | 1112 | $1,995 | $1.79 | 18d | 1 | 0.81mi |
| 2720 W Devitt St Fort Worth, TX | 2.0 | 2.0 | 740 | $2,750 | $3.72 | 18d | 1 | 0.83mi |
| 3241 Sandage Ave Fort Worth, TX | 3.0 | 2.0 | 1115 | $3,000 | $2.69 | 18d | 1 | 0.90mi |
| 2505 Benbrook Blvd Unit 503 Fort Worth, TX | 3.0 | 3.0 | 1367 | $2,495 | $1.83 | 43d | 1 | 0.91mi |
| 4317 Clay Ave Fort Worth, TX | 3.0 | 1.0 | 1240 | $1,995 | $1.61 | 24d | 1 | 0.95mi |
| 4256 Standish Rd Fort Worth, TX | 3.0 | 2.0 | 1392 | $1,650 | $1.19 | 24d | 1 | 0.98mi |
| 4343 Bellaire Dr S Unit 137 Fort Worth, TX | 2.0 | 1.5 | 1077 | $1,895 | $1.76 | 43d | 1 | 1.03mi |
| 4347 Bellaire Dr S Unit 132S Fort Worth, TX | 2.0 | 1.5 | 1077 | $2,000 | $1.86 | 43d | 1 | 1.04mi |
| 2565 Rogers Ave Fort Worth, TX | 2.0 | 1.0 | 1425 | $1,795 | $1.26 | 24d | 1 | 1.12mi |
| 4409 Bellaire Dr S Fort Worth, TX | 2.0 | 2.0 | 1149 | $2,100 | $1.83 | 43d | 1 | 1.12mi |
| 4409 Bellaire Dr S Unit 113 Fort Worth, TX | 2.0 | 1.5 | 1149 | $2,025 | $1.76 | 43d | 1 | 1.12mi |
| 4113 McCart Ave Fort Worth, TX | 2.0 | 1.0 | 807 | $1,375 | $1.70 | 43d | 1 | 1.21mi |
| 2450 Oak Hill Cir Fort Worth, TX | 1.0–4.0 | 1.0–2.5 | 1120 | $2,563 | $2.29 | 1d | 80 | 1.24mi |
| 2500 S University Dr Fort Worth, TX | 2.0 | 2.5 | 1411 | $2,200 | $1.56 | 43d | 1 | 1.27mi |
| 2714 McCart Ave Unit 2712 Fort Worth, TX | 2.0 | 2.0 | 1045 | $1,800 | $1.72 | 15d | 1 | 1.29mi |
| 2200 W Lowden St Unit 18 Fort Worth, TX | 2.0 | 1.0 | 873 | $1,410 | $1.62 | 24d | 1 | 1.30mi |
| 2708 McCart Ave Unit 2710 Fort Worth, TX | 2.0 | 2.0 | 1045 | $1,900 | $1.82 | 15d | 1 | 1.30mi |
| 2708 McCart Ave Fort Worth, TX | 2.0 | 2.0 | 1045 | $2,300 | $2.20 | 18d | 1 | 1.30mi |
| 2200 W Lowden St Fort Worth, TX | 1.0–2.0 | 1.0 | 782 | $1,410 | $1.80 | 15d | 6 | 1.30mi |
Listing history 3 events
-
2026-06-17days on market $2,250 Active 2 DOM
-
2026-06-15remarks 401-char remark
-
2026-06-15$2,250 Active 1 DOM
ⓘ Source: listings_history table (triggers on properties + properties_extension) + one-shot
backfill from property_details.listing_events for pre-trigger history.
Climate risk First Street
- Flood 1/10 Low FEMA zone X (unshaded) · 0% chance over 30 yrs
- Wildfire 1/10 Low
- Heat 8/10 Severe 7 d/yr ≥109°F today · 24 d/yr by 30 yrs out
- Wind 6/10 Major 27% chance of damaging wind over 30 yrs
- Air quality 3/10 Moderate 2 unhealthy d/yr today · 3 by 30 yrs out
Nearby sold comps map
Loading sold comps map…
Walkable amenities ~0.75 mi
Loading nearby amenities…
Taxation est. · year 1
- Rental income
- $26,966
- − Mortgage interest
- −$126
- − Property taxes
- −$34
- − Insurance
- −$11
- − Repairs & maintenance
- −$2,157
- − Management
- −$2,157
- − Depreciation
- −$65
- Taxable income
- $22,415
- Est. tax owed @ 24.0%
- −$5,380
- After-tax cash flow
- $15,737/yr
For passive investors: Depreciation is non-cash, so a rental often shows a tax loss while cash-flowing — sheltering income. Rental losses are passive: they offset passive income freely, and up to $25,000/yr can offset ordinary (W-2) income if you actively participate and your MAGI is under $100k (phasing out to $0 by $150k); unused losses carry forward. On sale, claimed depreciation is recaptured at up to 25%, and gains may owe capital-gains tax (a 1031 exchange can defer both). Figures are a year-1 estimate at your 24.0% rate — not tax advice; consult a CPA.
Schools (NCES district)
- District
- Fort Worth ISD
- NCES district ID
- 4819700
- Math proficiency
- 18% ▼ -16.00%
- Reading proficiency
- 28% ▼ -6.00%
- Median HH income
- $42,109
- Composite
- 19.61/100
- National rank
- #8753
- State rank
- #742 of 826 in TX
Livability — Fort Worth
- Score
- 80/100
- State rank
- #49
- US rank
- #1954
Category grades
Schools grade is shown separately in the Schools card above.
Census & demographics
- Census place
- Fort Worth, TX
- County
- Tarrant County · 2,033,669 people
- City population
- 911,619
- Metro
- Dallas-Fort Worth-Arlington, TX
- Population (ZIP)
- 26,006
- Household income
- $100,507
- Rent vs Own
- Severe rent burden
- 1281.0
Population outlook (Tarrant County) Hauer SSP2
- Today (2025)
- 2,380,417 people
- By 2030
- 2,578,900 · +8.3%
- By 2040
- 2,974,995 · +25.0%
- By 2050
- 3,350,489 · +40.8%
- By 2075
- 4,216,909 · +77.2%
- By 2100
- 4,741,527 · +99.2%
Race, ethnicity, and origin ACS 2023
- Neighborhood character
- Predominantly White (75%)
- Race & ethnicity
- White 75% Hispanic / Latino 11% Two or more races 7% Asian 6% Black 5%
- Hispanic origin (detail)
- Mexican 8%
- Common ancestry
- Slovak 5% Italian 3% Lithuanian 2%
- Foreign-born
- 9% · Canada, China, Vietnam
- Languages at home
- 85% English-only · Spanish 7% Other Indo-European 2% Arabic 2%
Political lean MEDSL · Tarrant
- 2024 margin
- Lean R (+5.1) · D 46.7% · R 51.9% · Other 1.4%
- 2008→2024 swing
- +6.6pp toward D · 2008: -11.7pp · 2024: -5.1pp
- All cycles
- 2024: R+5.1 2020: D+0.2 2016: R+8.7 2012: R+15.7 2008: R+11.7
Not yet ingested
- Civics
- —
Market trends
- HPI YoY
- ▼ -505.62%
- Current HPI
- 296.162
- Rent YoY
- ▲ 4.67%
- Metro
- Dallas-Fort Worth-Arlington, TX
- State GDP YoY
- ▲ 3.95%
- F500 in state
- 110
Industry mix (Fortune 500 HQ in TX)
| Industry | F500 HQs | Revenue |
|---|---|---|
| Energy | 16 | $1,198B |
|
||
| Technology | 5 | $198B |
|
||
| Engineering / Construction | 4 | $72B |
|
||
| Energy Services | 3 | $60B |
|
||
| Utilities | 3 | $41B |
|
||
| Healthcare | 2 | $330B |
|
||
Price history
+12.5% since first listed5 events — show timeline
- 2026-06-02 Listed $2,250 NTREIS
- 2025-02-18 Rental Removed $2,000 NTREIS
- 2024-02-07 Listed for Rent $2,000 NTREIS
- 2024-02-06 Rental Removed $2,000 NTREIS
- 2024-02-05 Listed for Rent $2,000 NTREIS
Property tax history
+3.8%/yrLatest (2025): $6,920 · -24.6% YoY. Source: county tax records.
Cash-flow waterfall
monthlySold comps — $/sqft
last 12 mo · ≤1 miLoading sold comps…