 Fourplex
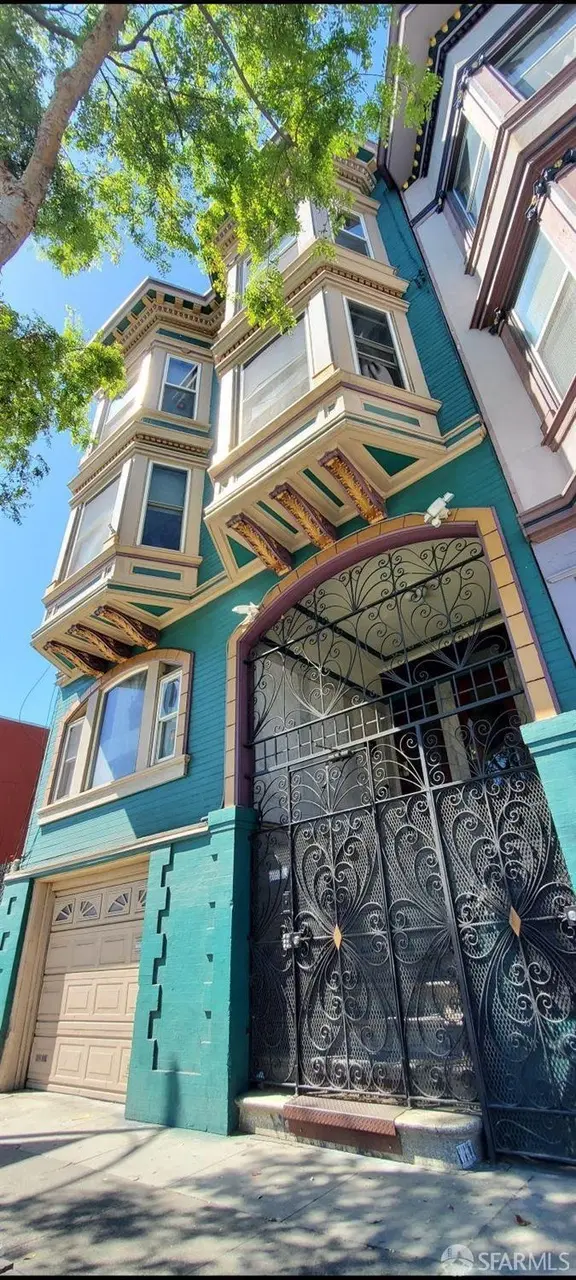
1608 Folsom St · San Francisco, CA
Flood risk 4/10 · Minor
- FEMA flood zone
- X (unshaded)
- Chance of flooding over 30 yrs
- 0.22%
- Est. flood insurance / yr
- $507 – $1,088
Fire risk 1/10 · Minimal
- Est. fire insurance / yr
- $659 – $1,223
Heat risk 2/10 · Minimal
- Hot days now (above 78°F)
- 8 days/yr
- Hot days in 30 yrs
- 17 days/yr
Wind risk 1/10 · Minimal
- Chance of severe wind over 30 yrs
- —
Air-quality risk 8/10 · Major
- Unhealthy air days now
- 15 days/yr
- Unhealthy air days in 30 yrs
- 15 days/yr
Risk factors via First Street. Map © Google.
Why this score? — see what drove the C grade
The composite is a weighted blend of 9 inputs, each scored 0–100. Each bar is that input's sub-score; the figure is the points it added to the 100-point composite (weight × sub-score).
- Cash flow +19.2/30.0
- Appreciation +7.5/10.0
- DSCR +6.1/10.0
- 1% rule +5.1/10.0
- Rent growth +5.0/5.0
- Schools +5.0/10.0
- Livability +3.8/5.0
- Condition / age +3.8/5.0
- ARV discount +0.0/15.0
$2,075,000
🖨 Deal sheet (PDF) 📄 Offer letter ✓ Due diligence
Multi-family units
County records classify this as Multi-Family (2-4 Unit). Listing-text estimate: 4 units. confirmed
Listing remarks MLS
Welcome to 1608 Folsom Street a well-maintained and fully occupied 4-unit building in a vibrant and highly accessible part of San Francisco. This property features three spacious 2-bedroom, 1-bathroom units, each offering a full kitchen, sit-in dining area, in-unit washer and dryer, and thoughtful layouts ideal for comfortable living. Additionally, there is an unwarranted studio unit, also fully rented, providing added income potential. Som e units include private outdoor balconies or patios, perfect for relaxing or entertaining. The property also offers on-site parking for up to 3 standard cars or 2 SUVs a rare and valuable amenity in the city. Located in the heart of SOMA, this property is just steps away from Trendy cafes, nightlife, artisan breweries, and major tech offices. Easy access to BART, Muni, and freeways makes commuting a breeze. With strong rental income and surrounded by some of the city's most dynamic amenities, 1608 Folsom is a smart addition to any investment portfolio.
Key facts
- Full kitchen
- Income potential
- On-site parking
Tags
Neighborhood map
What this means for you Summary
Snapshot
- This is a 3×2bd/1ba + 1×1bd/1ba units multifamily listed at $2.08M. Condition is rated good.
Deal economics
- At list price, monthly cash flow is $2k ($27k/yr) — positive. Per door: $564/mo.
- The deal already cash-flows at list — no discount required.
- Meets the 1% rule at list price ($21k rent vs $2.08M).
- Recommended offer: $1.95M (6.0% below list) — sets the bar for market timing.
- Cap rate 7.6% vs local median 2.1% in San Francisco — top-decile yield for the area; either an underpriced asset or a hidden risk that comps aren't pricing in. Stress-test before assuming the spread holds.
Location & tenants
- Location reads 76/100 on livability (#90 in CA, #3,143 nationally) — a middle-class / working-renter tenant base. Strengths: amenities A+, commute A+, employment A+; Watch: crime F, cost of living F.
- San Francisco Unified (urban): math 50% / reading 56% proficiency, ranked #322 of 1,400 in CA (top 23%) — acceptable for families but not a draw, mixed tenant base, ~2y average lease.
- Market conditions: Rents rising fast (+15.5%/yr); 108 active listings in the ZIP; high-income renter base; 750 units permitted in San Francisco County in 2024 (688 in 5+ unit buildings).
- At $21,007/mo this rent would consume 216% of the median local household income ($116k/yr) (locally 2666% of renters already pay >50% of income on rent) — very limited rent-growth headroom before tenants either downsize or default.
Forward outlook
- In year one you build about $117k of equity ($14k loan paydown + $103k appreciation (5.0% local appreciation)).
- San Francisco County population projected at +39% by 2050 — long-run rental-demand tailwind backs the buy-and-hold thesis.
- At projected returns (5.0% appreciation + 8.0% rent growth), your $581k cash investment doubles in ~4 years — after that, you're playing with house money.
- By year 2, paydown + projected appreciation supports a ~$188k cash-out refi (75% LTV) — recoverable capital for the next deal without selling this one.
Negotiation context
- It's been on market 77 days — a 6% lower offer ($1.95M) is reasonable based on typical stale-listing flexibility.
- 2 sale attempts with the ask held roughly flat each time — persistent listings suggest the price (not the market) is what's stuck; bring a comps-based counter.
Risks & watch-outs
- Watch-outs: built in 1914 — expect roof / HVAC / electrical / plumbing capex.
Questions for the listing agent
- It's been on market 77 days. Have you received any prior offers? Is the seller open to a 6% concession, seller financing, or rate buy-down credit?
- Can we see the unit-by-unit rent roll, current vacancy, and any below-market leases? What's the average tenancy length?
- What capital expenditures (roof, boiler, parking lot, exteriors) have been made in the last 5 years, and what's planned in the next 2?
- Built in 1914 — when were the roof, HVAC, electrical panel, plumbing, and water heater last replaced?
- Why hasn't it sold? Are there any deal-killer items the seller is aware of (foundation, flood, title, zoning, code violations)?
- Is there a deadline driving the sale (1031 exchange, divorce, estate, relocation)? That informs how much negotiation room exists.
- Schools are B-rated — typically a magnet for longer-tenancy family renters. What's the average tenant stay here, and is there a school-zone premium baked into asking?
- Crime grade is F in this area — have there been break-ins, vandalism, or insurance claims at this property in the last 3 years? What carrier currently insures it and at what premium?
- What's the average days-on-market for RENTAL listings here right now (not sales)? A rising rental-DOM trend means longer vacancies and softer asking-rent achievability than the comps imply.
- What's the recent tenant-quality profile in this submarket — average credit score on applications, eviction rate, late-payment / NSF rate, and stable-employment percentage? A property-management company in the area should have these aggregated.
- How much new apartment / multifamily construction is in the pipeline within 1–3 miles? Heavy new supply (>2% of stock underway) typically softens rents 12–24 months out; light construction supports rent growth.
Investment metrics
- 1% rule
- 1.01% ✓
- Cap rate
- 7.60%
- Cash-on-cash
- 4.66%
- DSCR
- 1.21
- GRM
- 8.2
CMA / ARV
- ARV (median comp)
- $1,399,279
- List price
- $2,075,000
- Delta
- 48.29%
- Verdict
- OVERPRICED
- Comps
- 20 within 1.0 mi
Projected returns pro-forma
4.96% appreciation · 8.0% rent growth · sell at horizon
- IRR
- 19.3%
- Equity multiple
- 2.25×
- Total profit
- $728,815
- Equity at exit
- $1,171,150
- IRR
- 21.5%
- Equity multiple
- 5.04×
- Total profit
- $2,348,487
- Equity at exit
- $2,017,350
Cash invested: $581,000 (down + closing). Projections, not guarantees.
Landlord ↔ Tenant lean methodology
- Overall (CITY)
- 0 Strongly Tenant-Friendly
- State California
- 18 Strongly Tenant-Friendly · D+13
- County
- — inherits STATE
- City San Francisco
- 0 Strongly Tenant-Friendly · D+57
ZIP-level market 94103
- Home prices YoY
- 2.9%
- Rents YoY
- 15.5%
- Active inventory
- 108
- Price-to-rent
- 31.8×
Monthly cashflow live
- Estimated rent
- $21,007 high interval (Pro) →
- Mortgage (P&I)
- −$10,882
- Tax est. 1.5%
- −$2,594 /mo · $31,125/yr
- Insurance
- −$865
- HOA
- −$0
- Vacancy / Maint / Mgmt
- −$4,411
- Net cashflow
- $2,256
Break-even live
Sensitivity live
| Price | -10% $3,690 | -5% $2,973 | +0% $2,256 | +5% $1,539 | +10% $822 |
|---|---|---|---|---|---|
| Rent | -10% $596 | -5% $1,426 | +0% $2,256 | +5% $3,085 | +10% $3,915 |
| Rate | -1.0pp $3,301 | -0.5pp $2,783 | base $2,256 | +0.5pp $1,718 | +1.0pp $1,171 |
4-unit breakdown (identical units grouped — click to expand)
| Units | Beds | Baths | Est. rent |
|---|---|---|---|
| 3× units | 2 | 1 | $16,311 |
| #1 | 2 | 1 | $5,437 |
| #2 | 2 | 1 | $5,437 |
| #3 | 2 | 1 | $5,437 |
| 1× unit | 1 | 1 | $4,697 |
| Total (4 units) | $21,007 | ||
UW: 25.0% down · 7.5% · 30yr · 1.5% tax · 5.0% vac · 8.0% maint · 8.0% mgmt
Financing live
Cash to close
- Down payment
- $518,750
- Closing costs
- $62,250
- Reserves months
- —
- Total cash needed
- —
Loan-product check · same deal, 3 products live
Conventional
25% down · 7.5% · 30yr
- Down + closing
- —
- Monthly P&I
- —
- Monthly cashflow
- —
- DSCR
- —
- Eligible?
- —
Personal DTI + credit; lowest rate.
DSCR
20% down · 8.5% · 30yr
- Down + closing
- —
- Monthly P&I
- —
- Monthly cashflow
- —
- DSCR
- —
- Eligible?
- —
No personal income docs; deal must DSCR.
Hard money
10% down · 12.0% · 12mo
- Down + closing
- —
- Monthly P&I
- —
- Monthly cashflow
- —
- DSCR
- —
- Eligible?
- —
Short-term bridge; refi at stabilization.
Listing history 17 events
-
2026-06-18days on market $2,075,000 Active 77 DOM
-
2026-06-17days on market $2,075,000 Active 76 DOM
-
2026-06-16days on market $2,075,000 Active 75 DOM
-
2026-06-15days on market $2,075,000 Active 74 DOM
-
2026-06-13days on market $2,075,000 Active 72 DOM
-
2026-06-13days on market $2,075,000 Active 71 DOM
-
2026-06-09days on market $2,075,000 Active 68 DOM
-
2026-06-08days on market $2,075,000 Active 67 DOM
-
2026-06-07days on market $2,075,000 Active 66 DOM
-
2026-06-04days on market $2,075,000 Active 63 DOM
-
2026-06-03days on market $2,075,000 Active 62 DOM
-
2026-06-02days on market $2,075,000 Active 61 DOM
-
2026-06-01days on market $2,075,000 Active 60 DOM
-
2026-05-31days on market $2,075,000 Active 59 DOM
-
2026-04-01$2,075,000 Active 1005-char remark
Show marketing remark (1005 chars)
Welcome to 1608 Folsom Street a well-maintained and fully occupied 4-unit building in a vibrant and highly accessible part of San Francisco. This property features three spacious 2-bedroom, 1-bathroom units, each offering a full kitchen, sit-in dining area, in-unit washer and dryer, and thoughtful layouts ideal for comfortable living. Additionally, there is an unwarranted studio unit, also fully rented, providing added income potential. Som e units include private outdoor balconies or patios, perfect for relaxing or entertaining. The property also offers on-site parking for up to 3 standard cars or 2 SUVs a rare and valuable amenity in the city. Located in the heart of SOMA, this property is just steps away from Trendy cafes, nightlife, artisan breweries, and major tech offices. Easy access to BART, Muni, and freeways makes commuting a breeze. With strong rental income and surrounded by some of the city's most dynamic amenities, 1608 Folsom is a smart addition to any investment portfolio.
-
2025-10-02price $2,075,000
-
2025-07-23$2,095,000 Active
ⓘ Source: listings_history table (triggers on properties + properties_extension) + one-shot
backfill from property_details.listing_events for pre-trigger history.
Climate risk First Street
- Flood 4/10 Moderate FEMA zone X (unshaded) · 22% chance over 30 yrs
- Wildfire 1/10 Low
- Heat 2/10 Low 8 d/yr ≥78°F today · 17 d/yr by 30 yrs out
- Wind 1/10 Low
- Air quality 8/10 Severe 15 unhealthy d/yr today · 15 by 30 yrs out
Nearby sold comps map
Loading sold comps map…
Walkable amenities ~0.75 mi
Loading nearby amenities…
Taxation est. · year 1
- Rental income
- $252,084
- − Mortgage interest
- −$116,232
- − Property taxes
- −$31,125
- − Insurance
- −$10,375
- − Repairs & maintenance
- −$20,167
- − Management
- −$20,167
- − Depreciation
- −$60,364
- Taxable loss
- −$6,345
- Est. tax savings @ 24.0%
- +$1,523
- After-tax cash flow
- $28,591/yr
For passive investors: Depreciation is non-cash, so a rental often shows a tax loss while cash-flowing — sheltering income. Rental losses are passive: they offset passive income freely, and up to $25,000/yr can offset ordinary (W-2) income if you actively participate and your MAGI is under $100k (phasing out to $0 by $150k); unused losses carry forward. On sale, claimed depreciation is recaptured at up to 25%, and gains may owe capital-gains tax (a 1031 exchange can defer both). Figures are a year-1 estimate at your 24.0% rate — not tax advice; consult a CPA.
Condition & rehab AI · 12 photos
This multi-family property is in good condition with minor repairs needed. It offers a good investment opportunity with potential for rental or resale value increases through cosmetic updates.
Repairs flagged
- Minor kitchen countertops — Visible wear on countertops.
- Minor bathroom tiles — Visible wear on bathroom tiles.
- Minor kitchen cabinets — Visible wear on kitchen cabinets.
- Minor common area flooring — Visible wear on common area flooring.
Value-add opportunities
- Both Paint interior walls — Fresh paint can improve the overall appearance and value of the property.
- Both Replace kitchen countertops — New countertops can improve functionality and aesthetics.
- Both Replace bathroom tiles — New tiles can improve functionality and aesthetics.
- Both Replace kitchen cabinets — New cabinets can improve functionality and aesthetics.
- Both Replace common area flooring — New flooring can improve functionality and aesthetics.
Renovation cost estimate screening
| Repair item | Severity | Est. cost |
|---|---|---|
| kitchen countertops · Visible wear on countertops. | Minor | $500–3,000 |
| bathroom tiles · Visible wear on bathroom tiles. | Minor | $500–3,000 |
| kitchen cabinets · Visible wear on kitchen cabinets. | Minor | $500–3,000 |
| common area flooring · Visible wear on common area flooring. | Minor | $500–3,000 |
| Total estimated repair cost · 4 items | $2,000–12,000 |
Value-add ROI direction
- Both Paint interior walls — Fresh paint can improve the overall appearance and value of the property. ↑
- Both Replace kitchen countertops — New countertops can improve functionality and aesthetics. ↑
- Both Replace bathroom tiles — New tiles can improve functionality and aesthetics. ↑
- Both Replace kitchen cabinets — New cabinets can improve functionality and aesthetics. ↑
- Both Replace common area flooring — New flooring can improve functionality and aesthetics. ↑
ⓘ Cost ranges are severity-bucket heuristics (US national rule-of-thumb). Get contractor quotes + a written scope before underwriting a rehab budget.
Schools (NCES district)
- District
- San Francisco Unified
- NCES district ID
- 0634410
- Math proficiency
- 50% ▬ 0.00%
- Reading proficiency
- 56% ▲ 1.00%
- Median HH income
- $81,249
- Composite
- 50.14/100
- National rank
- #4088
- State rank
- #322 of 1400 in CA
Livability — San Francisco
- Score
- 76/100
- State rank
- #90
- US rank
- #3143
Category grades
Schools grade is shown separately in the Schools card above.
Census & demographics
- Census place
- San Francisco, CA
- County
- San Francisco County · 827,552 people
- City population
- 827,552
- Metro
- San Francisco-Oakland-Berkeley, CA
- Population (ZIP)
- 34,964
- Household income
- $116,438
- Rent vs Own
- Severe rent burden
- 2666.0
Population outlook (San Francisco County) Hauer SSP2
- Today (2025)
- 1,030,936 people
- By 2030
- 1,110,409 · +7.7%
- By 2040
- 1,270,010 · +23.2%
- By 2050
- 1,435,001 · +39.2%
- By 2075
- 1,779,074 · +72.6%
- By 2100
- 1,966,767 · +90.8%
Race, ethnicity, and origin ACS 2023
- Neighborhood character
- Highly diverse neighborhood (Simpson 0.75)
- Race & ethnicity
- White 32% Asian 31% Hispanic / Latino 20% Two or more races 11% Black 10% Native American 2%
- Hispanic origin (detail)
- Mexican 11%
- Common ancestry
- Lithuanian 2% Slovak 2% Romanian 2%
- Foreign-born
- 36% · Canada, China, Vietnam
- Languages at home
- 56% English-only · Spanish 16% Chinese 9% Tagalog/Filipino 6%
Political lean MEDSL · San Francisco
- 2024 margin
- Solid D (+64.8) · D 80.3% · R 15.5% · Other 4.1%
- 2008→2024 swing
- -5.7pp toward R · 2008: 70.5pp · 2024: 64.8pp
- All cycles
- 2024: D+64.8 2020: D+72.5 2016: D+76.1 2012: D+70.2 2008: D+70.5
Not yet ingested
- Civics
- —
Market trends
- HPI YoY
- ▲ 4.96%
- Current HPI
- 175.4945
- Rent YoY
- ▲ 15.50%
- Metro
- San Francisco-Oakland-Berkeley, CA
- State GDP YoY
- ▲ 3.21%
- F500 in state
- 116
Industry mix (Fortune 500 HQ in CA)
| Industry | F500 HQs | Revenue |
|---|---|---|
| Technology | 27 | $1,492B |
|
||
| Financial Services | 3 | $174B |
|
||
| Retail | 3 | $44B |
|
||
| Insurance | 3 | $26B |
|
||
| Media / Entertainment | 2 | $115B |
|
||
| Pharmaceuticals / Biotech | 2 | $62B |
|
||
Price history
-1.0% since first listed3 events — show timeline
- 2026-04-01 Listed $2,075,000 San Francisco MLS
- 2025-10-02 Price Changed $2,075,000 San Francisco MLS
- 2025-07-23 Listed $2,095,000 San Francisco MLS
Cash-flow waterfall
monthlySold comps — $/sqft
last 12 mo · ≤1 miLoading sold comps…