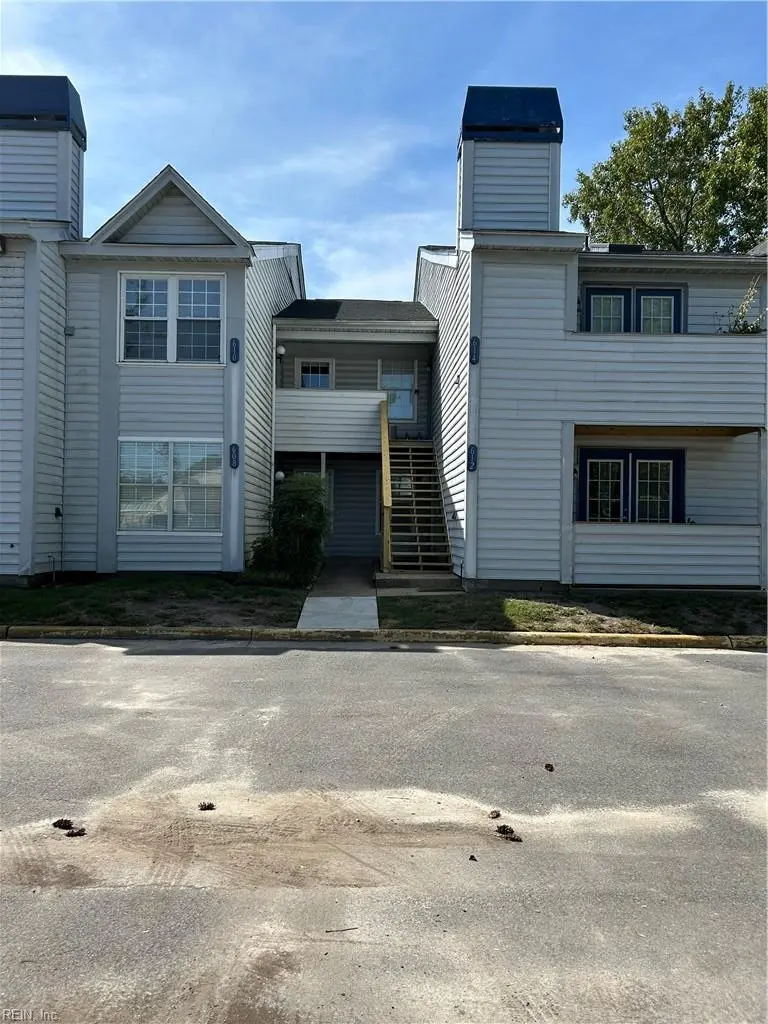
610 Waters Dr · Virginia Beach, VA
Flood risk No data
- FEMA flood zone
- —
- Chance of flooding over 30 yrs
- —
- Est. flood insurance / yr
- —
Fire risk No data
- Est. fire insurance / yr
- —
Heat risk No data
- Hot days now (above threshold)
- —
- Hot days in 30 yrs
- —
Wind risk No data
- Chance of severe wind over 30 yrs
- —
Air-quality risk No data
- Unhealthy air days now
- —
- Unhealthy air days in 30 yrs
- —
Risk factors via First Street. Map © Google.
Why this score? — see what drove the C+ grade
The composite is a weighted blend of 9 inputs, each scored 0–100. Each bar is that input's sub-score; the figure is the points it added to the 100-point composite (weight × sub-score).
- Cash flow +21.2/30.0
- 1% rule +8.5/10.0
- ARV discount +7.5/15.0
- DSCR +6.8/10.0
- Schools +6.4/10.0
- Livability +4.2/5.0
- Rent growth +3.9/5.0
- Condition / age +2.5/5.0
- Appreciation +0.0/10.0
$145,000
🖨 Deal sheet 📄 Offer letter ✓ Due diligence
Listing remarks MLS
Spacious two bedroom, sought after upstairs unit in Holland Mews. Both bedrooms have en suite bathrooms. Plenty of natural sunlight pouring in from skylights. Centrally located to bases, hospitals, colleges, and many attractions in the Virginia Beach area. Condo is part of a rental portfolio and was being rented for 1450 monthly. Condo is being sold as is and is under market value.
Key facts
- Easy access
- Quick closing
- Private bathroom
Tags
Property features AI
Finance
- HOA & community: HOA present (Holland Mews Condominium Association, Inc.); Condo association provides ground maintenance and trash pickup; Monthly association fee
Exterior
- Parking: One assigned/reserved parking space in lot
- Utilities: City/County water; City/County sewer; Electric water heater
- Home design: Attached condo; Low-rise style; Condo unit on level 2; Single-story within the building
- Construction: Slab foundation
- Exterior features: Vinyl siding; Asphalt shingle roof
Interior
- Kitchen: Dishwasher; Disposal; Microwave; Electric range; Refrigerator
- Bedrooms: Two bedrooms with en-suite bathrooms
- Flooring: Laminate
- Bathrooms: Two full bathrooms
- Heating & cooling: Electric heating; Central air conditioning
- Interior features: One fireplace; Laminate flooring; Bedroom with full bathroom on the first floor; Four rooms total
- Laundry & utility: Washer; Dryer
Neighborhood map
What this means for you Summary
Snapshot
- This is a 2-bed/2.0-bath condo listed at $145k.
Deal economics
- At list price, monthly cash flow is $210 ($3k/yr) — positive.
- The deal already cash-flows at list — no discount required.
- Meets the 1% rule at list price ($2k rent vs $145k).
- Cap rate 8.0% vs local median 3.5% in Virginia Beach — top-decile yield for the area; either an underpriced asset or a hidden risk that comps aren't pricing in. Stress-test before assuming the spread holds.
Location & tenants
- Location reads 83/100 on livability (#38 in VA, #880 nationally) — a professional / high-income tenant draw. Strengths: amenities A+, employment A+, housing A+; Watch: cost of living C-, commute F.
- Va Beach City Public School District (urban): math 69% / reading 78% proficiency, ranked #10 of 131 in VA (top 8%) — strong family-tenant draw, lease renewals of 3-5y typical.
- Zoned schools: Kempsville Elementary (math 67% / reading 77%, grade A-, #273 of 1,108 statewide, top 27%, 469 students, 42% FRL); Green Run High (math 64% / reading 69%, grade B, #195 of 319 statewide, top 62%, 1,517 students, 69% FRL) — zoned schools average 55% FRL vs 28% district-wide (27 pts higher); higher-poverty schools than district average — tighter screening recommended.
- Market conditions: Rents rising fast (+5.6%/yr); 220 active listings in the ZIP; 18 comparable units currently listed for rent nearby; rentals leasing fast (median 11d on market — plan ~1-2 weeks tenant-placement turnaround); 666 units permitted in Virginia Beach city in 2024 (347 in 5+ unit buildings).
- This rent runs 34% of the median local income ($69k/yr) — at the standard rent-burdened threshold; future hikes will face affordability resistance.
Forward outlook
- Local home prices are declining (-3.0%/yr); year-one equity from $1k of loan paydown is wiped out by about $4k of value loss. Plan a longer hold.
- Virginia Beach County population projected at +6% by 2050 — modest demand growth; plan on rents tracking national, not racing it.
- At projected returns (-3.0% appreciation + 5.6% rent growth), your $41k cash investment doubles in ~10 years — after that, you're playing with house money.
Negotiation context
- Only 12 days on market — expect competitive offers; lowballing is unlikely to land.
- 7 sale attempts since 7y ago with the ask held roughly flat each time — persistent listings suggest the price (not the market) is what's stuck; bring a comps-based counter.
- Current owner paid $83k; list at $145k implies a 75% gain — meaningful room to come down on a strong offer.
Risks & watch-outs
- Watch-outs: HOA is 20% of rent.
Questions for the listing agent
- What does the HOA fee cover, when was the last increase, and are there any pending special assessments or reserve-fund shortfalls?
- Any open or pending special assessments — roof, HVAC, plumbing, elevator, façade? What's the per-unit balance and payoff schedule, and is the seller paying it off at close or rolling it to the buyer?
- Is there a deadline driving the sale (1031 exchange, divorce, estate, relocation)? That informs how much negotiation room exists.
- Schools are A-rated — typically a magnet for longer-tenancy family renters. What's the average tenant stay here, and is there a school-zone premium baked into asking?
- What's the average days-on-market for RENTAL listings here right now (not sales)? A rising rental-DOM trend means longer vacancies and softer asking-rent achievability than the comps imply.
- What's the recent tenant-quality profile in this submarket — average credit score on applications, eviction rate, late-payment / NSF rate, and stable-employment percentage? A property-management company in the area should have these aggregated.
- How much new apartment / multifamily construction is in the pipeline within 1–3 miles? Heavy new supply (>2% of stock underway) typically softens rents 12–24 months out; light construction supports rent growth.
Investment metrics
- 1% rule
- 1.35% ✓
- Cap rate
- 8.03%
- Cash-on-cash
- 6.20%
- DSCR
- 1.28
- GRM
- 6.2
CMA / ARV
No comps found within radius.
Projected returns pro-forma
-3.0% appreciation · 5.61% rent growth · sell at horizon
- IRR
- -2.9%
- Equity multiple
- 0.89×
- Total profit
- $-4,613
- Equity at exit
- $21,620
- IRR
- 10.2%
- Equity multiple
- 1.91×
- Total profit
- $37,044
- Equity at exit
- $12,537
Cash invested: $40,600 (down + closing). Projections, not guarantees.
Landlord ↔ Tenant lean methodology
- Overall (STATE)
- 55 Moderately Landlord-Leaning
- State Virginia
- 55 Moderately Landlord-Leaning · D+2
- County
- — inherits STATE
- City
- — inherits STATE
ZIP-level market 23462
- Rents YoY
- 5.6%
- Active inventory
- 220
- Price-to-rent
- 6.2×
Monthly cashflow live
- Estimated rent
- $1,963 high interval (Pro) →
- Mortgage (P&I)
- −$760
- Tax from tax record
- −$120 /mo · $1,441/yr
- Insurance
- −$60
- HOA
- −$400
- Vacancy / Maint / Mgmt
- −$412
- Net cashflow
- $210
Break-even live
UW: 25.0% down · 7.5% · 30yr · 1.5% tax · 5.0% vac · 8.0% maint · 8.0% mgmt
Financing live
Cash to close
- Down payment
- $36,250
- Closing costs
- $4,350
- Reserves months
- —
- Total cash needed
- —
Loan-product check · same deal, 3 products live
Conventional
25% down · 7.5% · 30yr
- Down + closing
- —
- Monthly P&I
- —
- Monthly cashflow
- —
- DSCR
- —
- Eligible?
- —
Personal DTI + credit; lowest rate.
DSCR
20% down · 8.5% · 30yr
- Down + closing
- —
- Monthly P&I
- —
- Monthly cashflow
- —
- DSCR
- —
- Eligible?
- —
No personal income docs; deal must DSCR.
Hard money
10% down · 12.0% · 12mo
- Down + closing
- —
- Monthly P&I
- —
- Monthly cashflow
- —
- DSCR
- —
- Eligible?
- —
Short-term bridge; refi at stabilization.
Rent comps 18 comps
| Address | Beds | Baths | Sqft | Rent | $/sqft | DOM | Units | Dist |
|---|---|---|---|---|---|---|---|---|
| 3923 Lake Front Cir Virginia Beach, VA | 1.0–2.0 | 1.0 | 918 | $1,845 | $2.01 | 10d | 1 | 0.23mi |
| 3955 Marina Lake Rd Virginia Beach, VA | 1.0–2.0 | 1.0–2.0 | 870 | $1,960 | $2.25 | 10d | 1 | 0.28mi |
| 3816 Banyan Grove Ln Virginia Beach, VA | 1.0–3.0 | 1.0–2.0 | 945 | $2,298 | $2.43 | 1d | 15 | 0.44mi |
| 1500 Chase Arbor Cmn Virginia Beach, VA | 1.0–2.0 | 1.0–2.0 | 895 | $2,178 | $2.43 | 2d | 24 | 0.53mi |
| 4133 Shoreline Cir Virginia Beach, VA | 1.0–2.0 | 1.0–2.0 | 964 | $2,000 | $2.07 | 10d | 1 | 0.53mi |
| 3700 Snowdrift Cir Virginia Beach, VA | 1.0–3.0 | 1.0–2.0 | 887 | $2,164 | $2.44 | 23d | 1 | 0.56mi |
| 807 Foxmoore Ct Virginia Beach, VA | 2.0 | 2.5 | 1125 | $2,000 | $1.78 | 2d | 1 | 0.70mi |
| 1012 Grassland Ct Virginia Beach, VA | 3.0 | 2.0 | 1021 | $2,050 | $2.01 | 23d | 1 | 0.74mi |
| 726 Hayes Ave Virginia Beach, VA | 2.0 | 1.5 | 1008 | $1,700 | $1.69 | 23d | 1 | 0.92mi |
| 713 Willow Lake Cir Virginia Beach, VA | 1.0–2.0 | 1.0–2.0 | 1041 | $2,475 | $2.38 | 23d | 1 | 1.19mi |
| 3560 Windmill Dr Virginia Beach, VA | 3.0 | 1.5 | 1080 | $2,100 | $1.94 | 23d | 1 | 1.27mi |
| 176 S Kentucky Ave Virginia Beach, VA | 2.0 | 1.0 | 874 | $1,350 | $1.54 | 4d | 1 | 1.29mi |
| 3416 Hollygreen Dr Virginia Beach, VA | 2.0 | 1.0 | 960 | $1,754 | $1.83 | 23d | 5 | 1.32mi |
| 3638 Windmill Dr Virginia Beach, VA | 2.0 | 1.0 | 934 | $1,695 | $1.81 | 10d | 1 | 1.38mi |
| 100 Runaway Bay Dr Virginia Beach, VA | 1.0–2.0 | 1.0–2.0 | 807 | $1,985 | $2.46 | 1d | 44 | 1.38mi |
| 3745 Edenberry Ct Virginia Beach, VA | 2.0 | 2.0 | 1044 | $1,899 | $1.82 | 4d | 1 | 1.39mi |
| 3745 Edenberry Ct Virginia Beach, VA | 1.0 | 1.0 | 920 | $1,699 | $1.85 | 1d | 1 | 1.39mi |
| 149 S Budding Ave Virginia Beach, VA | 1.0–3.0 | 1.0–2.0 | 1100 | $1,849 | $1.68 | 1d | 30 | 1.40mi |
HOA detail condo
- Monthly dues
- $400 · $4,800/yr
- Assessments
- None detected in remarks — confirm with the listing agent.
Listing history 19 events
-
2026-06-02status $145,000 Under Contract 12 DOM
-
2026-06-01days on market $145,000 Active 12 DOM
-
2026-05-31days on market $145,000 Active 11 DOM
-
2026-05-20$145,000 Active
-
2026-05-03$145,000 Active 384-char remark
Show marketing remark (384 chars)
Spacious two bedroom, sought after upstairs unit in Holland Mews. Both bedrooms have en suite bathrooms. Plenty of natural sunlight pouring in from skylights. Centrally located to bases, hospitals, colleges, and many attractions in the Virginia Beach area. Condo is part of a rental portfolio and was being rented for 1450 monthly. Condo is being sold as is and is under market value.
-
2026-03-22historical
-
2026-01-01$150,000 Active
-
2025-12-31historical
-
2025-12-13price $150,000
-
2025-12-13status Active
-
2025-12-10historical Active Under Contract
-
2025-10-23price $155,000
-
2025-09-22$165,000 Active
-
2021-06-30soldstatus $83,000
-
2019-02-19historical
-
2019-02-15status Active
-
2019-01-15status Under Contract
-
2019-01-11$92,500 Active
-
2008-08-12soldstatus $125,000
ⓘ Source: listings_history table (triggers on properties + properties_extension) + one-shot
backfill from property_details.listing_events for pre-trigger history.
Tax reassessment forecast VA · Resets to sale price
- Current annual tax
- $1,441 · $120/mo
- Projected year-2 tax
- $1,441 · $120/mo
- Expected delta
- $0/yr ($0/mo · 0.0%)
ⓘ Screening estimate from a state-policy table — verify with the county assessor before closing.
Nearby sold comps map
Loading sold comps map…
Walkable amenities ~0.75 mi
Loading nearby amenities…
Taxation est. · year 1
- Rental income
- $23,554
- − Mortgage interest
- −$8,122
- − Property taxes
- −$1,441
- − Insurance
- −$725
- − Repairs & maintenance
- −$1,884
- − Management
- −$1,884
- − HOA
- −$4,800
- − Depreciation
- −$4,218
- Taxable income
- $478
- Est. tax owed @ 24.0%
- −$115
- After-tax cash flow
- $2,402/yr
For passive investors: Depreciation is non-cash, so a rental often shows a tax loss while cash-flowing — sheltering income. Rental losses are passive: they offset passive income freely, and up to $25,000/yr can offset ordinary (W-2) income if you actively participate and your MAGI is under $100k (phasing out to $0 by $150k); unused losses carry forward. On sale, claimed depreciation is recaptured at up to 25%, and gains may owe capital-gains tax (a 1031 exchange can defer both). Figures are a year-1 estimate at your 24.0% rate — not tax advice; consult a CPA.
Schools (NCES district)
- District
- Va Beach City Public School District
- NCES district ID
- 5103840
- Math proficiency
- 69% ▼ -19.00%
- Reading proficiency
- 78% ▼ -7.00%
- Median HH income
- $66,452
- Composite
- 63.81/100
- National rank
- #594
- State rank
- #10 of 131 in VA
Livability — Virginia Beach
- Score
- 83/100
- State rank
- #38
- US rank
- #880
Category grades
Schools grade is shown separately in the Schools card above.
Census & demographics
- Census place
- Virginia Beach, VA
- County
- Virginia Beach City · 448,227 people
- City population
- 448,227
- Metro
- Virginia Beach-Norfolk-Newport News, VA-NC
- Population (ZIP)
- 66,151
- Household income
- $69,040
- Rent vs Own
- Severe rent burden
- 3906.0
Population outlook (Virginia Beach County) Hauer SSP2
- Today (2025)
- 480,401 people
- By 2030
- 491,221 · +2.3%
- By 2040
- 504,882 · +5.1%
- By 2050
- 508,847 · +5.9%
- By 2075
- 504,831 · +5.1%
- By 2100
- 465,867 · -3.0%
Race, ethnicity, and origin ACS 2023
- Neighborhood character
- Diverse neighborhood (Simpson 0.68)
- Race & ethnicity
- White 45% Black 32% Hispanic / Latino 12% Two or more races 10% Asian 5%
- Hispanic origin (detail)
- Mexican 4% Puerto Rican 3%
- Common ancestry
- Romanian 2% Italian 1% Slovak 1%
- Foreign-born
- 9% · Canada, China, Vietnam
- Languages at home
- 87% English-only · Spanish 6% Tagalog/Filipino 2% Other Asian/Pacific 1%
Political lean MEDSL · Virginia Beach
- 2024 margin
- Toss-up / Even · D 50.7% · R 48.0% · Other 1.3%
- 2008→2024 swing
- +3.4pp toward D · 2008: -0.7pp · 2024: 2.6pp
- All cycles
- 2024: D+2.6 2020: D+5.4 2016: R+4.5 2012: R+2.5 2008: R+0.7
Not yet ingested
- Civics
- —
Market trends
- HPI YoY
- ▼ -269.19%
- Current HPI
- 333.1908
- Rent YoY
- ▲ 5.61%
- Metro
- Virginia Beach-Norfolk-Newport News, VA-NC
- State GDP YoY
- ▲ 2.40%
- F500 in state
- 50
Industry mix (Fortune 500 HQ in VA)
| Industry | F500 HQs | Revenue |
|---|---|---|
| Aerospace / Defense | 4 | $236B |
|
||
| Technology / Defense | 3 | $32B |
|
||
| Financial Services | 2 | $176B |
|
||
| Utilities | 2 | $27B |
|
||
| Insurance | 2 | $25B |
|
||
| Technology | 2 | $15B |
|
||
Price history
+16.0% since first listed16 events — show timeline
- 2026-05-20 Listed $145,000 REINMLS
- 2026-05-03 Listed $145,000 FSBO.com
- 2026-03-22 Listing Removed — REINMLS
- 2026-01-01 Listed $150,000 REINMLS
- 2025-12-31 Listing Removed — REINMLS
- 2025-12-13 Price Changed $150,000 REINMLS
- 2025-12-13 Relisted — REINMLS
- 2025-12-10 Contingent — REINMLS
- 2025-10-23 Price Changed $155,000 REINMLS
- 2025-09-22 Listed $165,000 REINMLS
- 2021-06-30 Sold (Public Records) $83,000 Public Records
- 2019-02-19 Listing Removed — REINMLS
- 2019-02-15 Relisted — REINMLS
- 2019-01-15 Pending — REINMLS
- 2019-01-11 Listed $92,500 REINMLS
- 2008-08-12 Sold (Public Records) $125,000 Public Records
Property tax history
+2.5%/yrLatest (2025): $1,441 · +10.8% YoY. Source: county tax records.
Cash-flow waterfall
monthlySold comps — $/sqft
last 12 mo · ≤1 miLoading sold comps…