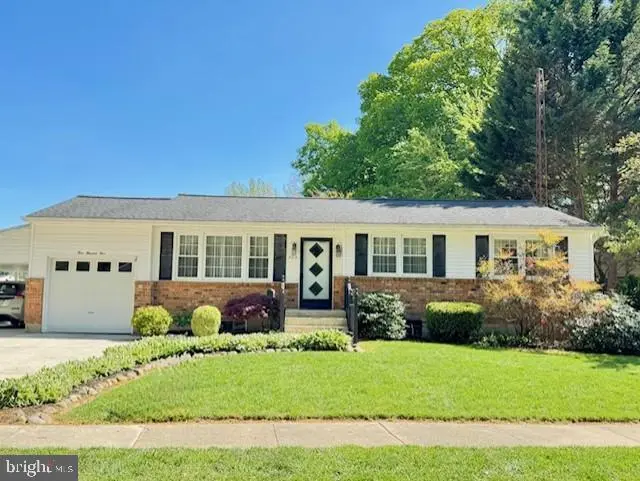
309 Cambridge Dr · Camden, DE
Flood risk 1/10 · Minimal
- FEMA flood zone
- X (unshaded)
- Chance of flooding over 30 yrs
- 0.0%
- Est. flood insurance / yr
- $507 – $1,088
Fire risk 1/10 · Minimal
- Est. fire insurance / yr
- $476 – $884
Heat risk 8/10 · Major
- Hot days now (above 102°F)
- 7 days/yr
- Hot days in 30 yrs
- 16 days/yr
Wind risk 7/10 · Major
- Chance of severe wind over 30 yrs
- 78.0%
Air-quality risk 2/10 · Minimal
- Unhealthy air days now
- 1 days/yr
- Unhealthy air days in 30 yrs
- 2 days/yr
Risk factors via First Street. Map © Google.
Why this score? — see what drove the D- grade
The composite is a weighted blend of 9 inputs, each scored 0–100. Each bar is that input's sub-score; the figure is the points it added to the 100-point composite (weight × sub-score).
- ARV discount +12.2/15.0
- Cash flow +8.4/30.0
- Schools +3.3/10.0
- Livability +3.2/5.0
- Rent growth +2.5/5.0
- Condition / age +2.5/5.0
- DSCR +2.3/10.0
- 1% rule +1.3/10.0
- Appreciation +0.0/10.0
$315,000
🖨 Deal sheet (PDF) 📄 Offer letter ✓ Due diligence
Listing remarks
Welcome to this charming, ranch-style home, lovingly maintained by its original owner and ideally located in the heart of Camden, DE. This inviting single-story residence offers three bedrooms and two full bathrooms, combining comfort with timeless appeal. Step inside to discover a traditional floor plan that blends functionality with classic style. The remodeled kitchen is a standout feature, offering abundant cabinetry, a dedicated pantry, gas cooking, an enameled sink, and a breakfast bar with seating—perfect for everyday living and entertaining. Just beyond, a bright breakfast room/sunroom addition features a vaulted ceiling and a stunning Palladian window that fills the space wit
Key facts
- Remodeled kitchen
- Finished basement
- Enclosed porch
Tags
Property features AI
Exterior
- Parking: Attached garage (front entry) and attached carport; Total of 4 parking spaces; Driveway with space for 2 vehicles
- Utilities: Public water; Public sewer; Cable TV available; 150 amp electrical service
- Home design: Detached single-family home; Architectural shingle roof; Brick front with vinyl siding and stick-built construction; Block foundation; Above- and below-grade living areas; Partially finished basement
- Construction: Estimated year built; Brick front, stick-built, vinyl siding; Architectural shingle roof; Block foundation
- Exterior features: Patio(s); Enclosed porch(es); Gutter system; Sidewalks; Street lights; Vinyl fencing; Landscaped yard; Located on a cul-de-sac; Not in a federal flood zone
Interior
- Kitchen: Built-in range; Electric oven/range; Microwave; Dishwasher; Disposal; Extra refrigerator/freezer; Refrigerator
- Bedrooms: Three main-level bedrooms (Master Bedroom, Bedroom 2, Bedroom 3)
- Flooring: Hardwood floors; Carpeted and partially carpeted areas; Wood floors
- Bathrooms: Two full bathrooms (one on main level, one on lower level)
- Heating & cooling: Forced air heating (natural gas); Central air conditioning (electric, 150 amp service)
- Interior features: Bar; Tub/shower; Cedar closets; Ceiling fans; Traditional floor plan; Pantry; Recessed lighting; Window treatments; Dry wall and paneled walls; Vaulted ceilings; Storm door
- Laundry & utility: Washer and dryer; Laundry in basement; Electric water heater; Humidifier; Exhaust fan
Neighborhood map
What this means for you Summary
Snapshot
- This is a 3-bed/1.5-bath single-family listed at $315k.
Deal economics
- At list price, monthly cash flow is $-280 ($-3k/yr) — negative.
- To cash-flow at today's rent, offer at most $266k (15.7% below list).
- To meet the 1% rule (rent ≥ 1% of price), the offer needs to be $197k (37.4% below list).
- Recommended offer: $197k (37.4% below list) — sets the bar for 1% rule.
- Cap rate 5.2% vs local median 3.5% in Camden — top-decile yield for the area; either an underpriced asset or a hidden risk that comps aren't pricing in. Stress-test before assuming the spread holds.
Location & tenants
- Location reads 64/100 on livability (#47 in DE) — a middle-class / working-renter tenant base. Strengths: housing A+, employment A, cost of living A-; Watch: crime F, amenities F, commute F.
- Caesar Rodney School District (suburban): math 26% / reading 49% proficiency, ranked #9 of 26 in DE (top 35%) — families likely to look elsewhere, expect single-tenant / working-renter base with shorter leases.
- Zoned schools: W. B. Simpson Elementary School (math 25% / reading 44%, grade F, #34 of 105 statewide, top 37%, 571 students, 0% FRL); Fred Fifer Iii Middle School (math 25% / reading 51%, grade F, #8 of 36 statewide, top 20%, 679 students, 0% FRL); Caesar Rodney High School (math 31% / reading 61%, grade D-, #7 of 40 statewide, top 15%, 2,257 students, 0% FRL) — zoned schools average 0% FRL vs 35% district-wide (35 pts lower); this property's tenant base skews higher-income than the district average.
- Market conditions: 93 active listings in the ZIP; 5 comparable units currently listed for rent nearby; rentals lingering (median 46d on market — plan ~5-8 weeks vacancy on turnover, expect pricing pressure); 100% of comp listings sitting > 30 days — soft ceiling on asking rent; 1,201 units permitted in Kent County in 2024 (116 in 5+ unit buildings).
Forward outlook
- Local home prices are declining (-3.0%/yr); year-one equity from $2k of loan paydown is wiped out by about $9k of value loss. Plan a longer hold.
- Kent County population projected at +22% by 2050 — long-run rental-demand tailwind backs the buy-and-hold thesis.
Negotiation context
- Only 8 days on market — expect competitive offers; lowballing is unlikely to land.
Risks & watch-outs
- Climate carrying-cost: major wind risk, 78% chance of damaging wind over 30y; extreme-heat days projected 7→16/yr by 2055 (HVAC capex compounding) — expect insurance premiums to compound above CPI over the hold.
Questions for the listing agent
- What do current leases actually rent for vs. the listed asking? Can we see a recent rent roll and the last 12 months of T-12 income?
- Built in 1970 — when were the roof, HVAC, electrical panel, plumbing, and water heater last replaced?
- Is there a deadline driving the sale (1031 exchange, divorce, estate, relocation)? That informs how much negotiation room exists.
- Crime grade is F in this area — have there been break-ins, vandalism, or insurance claims at this property in the last 3 years? What carrier currently insures it and at what premium?
- The area grade is low — what's the realistic commute time and amenity access for the typical tenant pool here? Any planned neighborhood developments (good or bad) we should know about?
- What's the average days-on-market for RENTAL listings here right now (not sales)? A rising rental-DOM trend means longer vacancies and softer asking-rent achievability than the comps imply.
- What's the recent tenant-quality profile in this submarket — average credit score on applications, eviction rate, late-payment / NSF rate, and stable-employment percentage? A property-management company in the area should have these aggregated.
- How much new for-sale + rental construction is in the pipeline within 1–3 miles? Heavy new supply typically softens prices + rents 12–24 months out; constrained supply supports both.
Investment metrics
- 1% rule
- 0.63% ✗
- Cap rate
- 5.23%
- Cash-on-cash
- -3.81%
- DSCR
- 0.83
- GRM
- 13.3
CMA / ARV
- ARV (median comp)
- $351,967
- List price
- $315,000
- Delta
- -10.50%
- Verdict
- UNDERPRICED
- Comps
- 20 within 1.0 mi
Show comp detail 11 sales within ~0.75 mi
| Address | Dist | Beds/Ba | Sqft | Sold | Price | $/sf | Match |
|---|---|---|---|---|---|---|---|
| 709 Millet Ln | 0.54mi | 3/2.0 | 1,308 (0%) | 10mo | $350,000 | $268 | 64 |
| 22 Howell St | 0.44mi | 2/2.0 (-1) | 1,224 (-6%) | 1mo | $282,500 | $231 | 61 |
| 201 Cambridge Rd | 0.17mi | 3/2.0 | 1,203 (-8%) | 19mo | $255,000 | $212 | 61 |
| 19 S Main | 0.60mi | 2/1.0 (-1) | 1,360 (+4%) | 5mo | $262,000 | $193 | 54 |
| 91 Stevens St | 0.47mi | 3/1.0 | 1,116 (-15%) | 1mo | $235,000 | $211 | 51 |
| 30 Old North | 0.50mi | 3/2.0 | 1,259 (-4%) | 21mo | $255,000 | $203 | 51 |
| 100 N Caesar Rodney Ave | 0.69mi | 2/1.5 (-1) | 1,249 (-4%) | 12mo | $287,500 | $230 | 46 |
| 127 Chapel Dr | 0.20mi | 4/2.0 (+1) | 1,498 (+14%) | 17mo | $329,000 | $220 | 45 |
| 1566 John Clark Rd | 0.47mi | 3/2.0 | 1,152 (-12%) | 15mo | $271,000 | $235 | 44 |
| 53 Asbury Ave | 0.53mi | 3/1.0 | 1,152 (-12%) | 21mo | $210,000 | $182 | 36 |
| 310 David Hall Rd | 0.62mi | 4/1.0 (+1) | 1,152 (-12%) | 12mo | $265,000 | $230 | 34 |
Match score weights: distance 35% · size 25% · config 20% · recency 20%. Top-matched comps best support the ARV.
Projected returns pro-forma
-3.0% appreciation · 3.0% rent growth · sell at horizon
- IRR
- -22.8%
- Equity multiple
- 0.22×
- Total profit
- $-69,054
- Equity at exit
- $46,968
- IRR
- -17.4%
- Equity multiple
- 0.05×
- Total profit
- $-83,816
- Equity at exit
- $27,235
Cash invested: $88,200 (down + closing). Projections, not guarantees.
Landlord ↔ Tenant lean methodology
- Overall (STATE)
- 70 Landlord-Friendly
- State Delaware
- 70 Landlord-Friendly · D+7
- County
- — inherits STATE
- City
- — inherits STATE
ZIP-level market 19934
- Home prices YoY
- -25.1%
- Active inventory
- 93
- Price-to-rent
- 13.3×
Monthly cashflow live
- Estimated rent
- $1,973 high interval (Pro) →
- Mortgage (P&I)
- −$1,652
- Tax from tax record
- −$56 /mo · $670/yr
- Insurance
- −$131
- HOA
- −$0
- Vacancy / Maint / Mgmt
- −$414
- Net cashflow
- $-280
Break-even live
Sensitivity live
| Price | -10% $-102 | -5% $-191 | +0% $-280 | +5% $-369 | +10% $-836 |
|---|---|---|---|---|---|
| Rent | -10% $-436 | -5% $-358 | +0% $-280 | +5% $-202 | +10% $-124 |
| Rate | -1.0pp $-121 | -0.5pp $-200 | base $-280 | +0.5pp $-362 | +1.0pp $-445 |
UW: 25.0% down · 7.5% · 30yr · 1.5% tax · 5.0% vac · 8.0% maint · 8.0% mgmt
Financing live
Cash to close
- Down payment
- $78,750
- Closing costs
- $9,450
- Reserves months
- —
- Total cash needed
- —
Loan-product check · same deal, 3 products live
Conventional
25% down · 7.5% · 30yr
- Down + closing
- —
- Monthly P&I
- —
- Monthly cashflow
- —
- DSCR
- —
- Eligible?
- —
Personal DTI + credit; lowest rate.
DSCR
20% down · 8.5% · 30yr
- Down + closing
- —
- Monthly P&I
- —
- Monthly cashflow
- —
- DSCR
- —
- Eligible?
- —
No personal income docs; deal must DSCR.
Hard money
10% down · 12.0% · 12mo
- Down + closing
- —
- Monthly P&I
- —
- Monthly cashflow
- —
- DSCR
- —
- Eligible?
- —
Short-term bridge; refi at stabilization.
Rent comps 5 comps
| Address | Beds | Baths | Sqft | Rent | $/sqft | DOM | Units | Dist |
|---|---|---|---|---|---|---|---|---|
| 128 E Camden Wyoming Ave Unit A Camden, DE | 2.0 | 2.0 | 900 | $1,350 | $1.50 | 45d | 1 | 0.57mi |
| 300 East St Camden, DE | 1.0–3.0 | 1.0–2.0 | 1272 | $2,695 | $2.12 | 45d | 1 | 0.79mi |
| 4 Carolee Dr Dover, DE | 3.0 | 1.0 | 1008 | $2,100 | $2.08 | 45d | 1 | 0.92mi |
| 104 Southern Blvd Wyoming, DE | 3.0 | 1.0 | 1656 | $2,000 | $1.21 | 45d | 1 | 0.96mi |
| 51 Webbs Ln Dover, DE | 2.0 | 1.0–1.5 | 787 | $1,525 | $1.94 | 45d | 11 | 1.04mi |
Listing history 2 events
-
2026-05-05status Pending 2056-char remark
-
2026-04-27$315,000 Active 2056-char remark
ⓘ Source: listings_history table (triggers on properties + properties_extension) + one-shot
backfill from property_details.listing_events for pre-trigger history.
Tax reassessment forecast DE · Partial reset (capped growth)
- Current annual tax
- $670 · $56/mo
- Projected year-2 tax
- $1,249 · $104/mo
- Expected delta
- +$578/yr (+$48/mo · 86.2%)
ⓘ Screening estimate from a state-policy table — verify with the county assessor before closing.
Climate risk First Street
- Flood 1/10 Low FEMA zone X (unshaded) · 0% chance over 30 yrs
- Wildfire 1/10 Low
- Heat 8/10 Severe 7 d/yr ≥102°F today · 16 d/yr by 30 yrs out
- Wind 7/10 Severe 78% chance of damaging wind over 30 yrs
- Air quality 2/10 Low 1 unhealthy d/yr today · 2 by 30 yrs out
Nearby sold comps map
Loading sold comps map…
Walkable amenities ~0.75 mi
Loading nearby amenities…
Taxation est. · year 1
- Rental income
- $23,681
- − Mortgage interest
- −$17,645
- − Property taxes
- −$670
- − Insurance
- −$1,575
- − Repairs & maintenance
- −$1,895
- − Management
- −$1,895
- − Depreciation
- −$9,164
- Taxable loss
- −$9,162
- Est. tax savings @ 24.0%
- +$2,199
- After-tax cash flow
- $-1,161/yr
For passive investors: Depreciation is non-cash, so a rental often shows a tax loss while cash-flowing — sheltering income. Rental losses are passive: they offset passive income freely, and up to $25,000/yr can offset ordinary (W-2) income if you actively participate and your MAGI is under $100k (phasing out to $0 by $150k); unused losses carry forward. On sale, claimed depreciation is recaptured at up to 25%, and gains may owe capital-gains tax (a 1031 exchange can defer both). Figures are a year-1 estimate at your 24.0% rate — not tax advice; consult a CPA.
Schools (NCES district)
- District
- Caesar Rodney School District
- NCES district ID
- 1000180
- Math proficiency
- 26% ▼ -21.00%
- Reading proficiency
- 49% ▼ -14.00%
- Median HH income
- $61,187
- Composite
- 33.4/100
- National rank
- #5475
- State rank
- #9 of 26 in DE
Livability — Camden
- Score
- 64/100
- State rank
- #47
- US rank
- #13717
Category grades
Schools grade is shown separately in the Schools card above.
Census & demographics
- Census place
- Camden, DE
- Population (ZIP)
- 13,579
Population outlook (Kent County) Hauer SSP2
- Today (2025)
- 194,477 people
- By 2030
- 204,351 · +5.1%
- By 2040
- 222,135 · +14.2%
- By 2050
- 236,483 · +21.6%
- By 2075
- 266,327 · +36.9%
- By 2100
- 275,335 · +41.6%
Race, ethnicity, and origin ACS 2023
- Neighborhood character
- Majority White (63%)
- Race & ethnicity
- White 63% Black 24% Two or more races 8% Hispanic / Latino 6% Asian 2%
- Hispanic origin (detail)
- Mexican 3% Puerto Rican 1%
- Common ancestry
- Romanian 3% Lithuanian 2% Slovak 2%
- Foreign-born
- 11% · Canada, Vietnam
- Languages at home
- 84% English-only · Spanish 4% German/W. Germanic 4% French/Haitian/Cajun 1%
Political lean MEDSL · Kent
- 2024 margin
- Toss-up / Even · D 50.2% · R 48.2% · Other 1.7%
- 2008→2024 swing
- -7.8pp toward R · 2008: 9.8pp · 2024: 2.0pp
- All cycles
- 2024: D+2.0 2020: D+4.1 2016: R+4.9 2012: D+4.9 2008: D+9.8
Not yet ingested
- Civics
- —
Market trends
- HPI YoY
- ▼ -62.19%
- Current HPI
- 185.0938
- Rent YoY
- —
- Metro
- —
- State GDP YoY
- —
- F500 in state
- 0
Price history
+3.5% since first listed4 events — show timeline
- 2026-06-04 Sold (Public Records) $326,000 Public Records
- 2026-06-01 Sold (MLS) $326,000 BRIGHT MLS
- 2026-05-05 Pending — BRIGHT MLS
- 2026-04-27 Listed $315,000 BRIGHT MLS
Property tax history
+0.7%/yrLatest (2025): $670 · +0.7% YoY. Source: county tax records.
Cash-flow waterfall
monthlySold comps — $/sqft
last 12 mo · ≤1 miLoading sold comps…