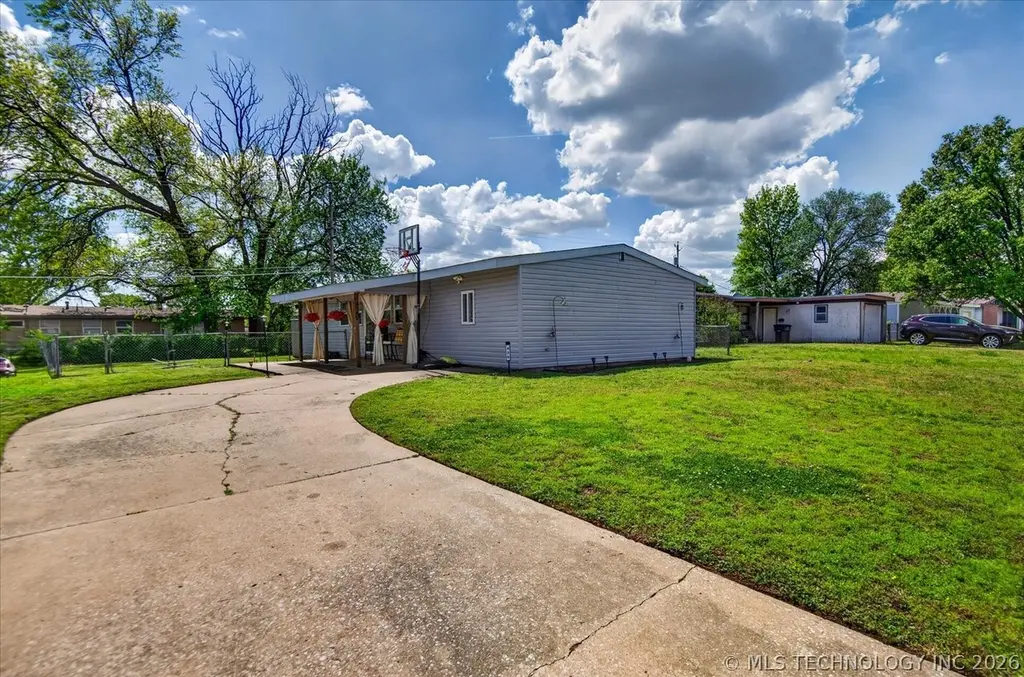
420 NW Lahoma Dr · Bartlesville, OK
Flood risk 1/10 · Minimal
- FEMA flood zone
- X (unshaded)
- Chance of flooding over 30 yrs
- 0.0%
- Est. flood insurance / yr
- $507 – $1,088
Fire risk 8/10 · Major
- Est. fire insurance / yr
- $2,463 – $4,575
Heat risk 6/10 · Moderate
- Hot days now (above 113°F)
- 7 days/yr
- Hot days in 30 yrs
- 19 days/yr
Wind risk 2/10 · Minimal
- Chance of severe wind over 30 yrs
- 3.0%
Air-quality risk 2/10 · Minimal
- Unhealthy air days now
- 1 days/yr
- Unhealthy air days in 30 yrs
- 3 days/yr
Risk factors via First Street. Map © Google.
Why this score? — see what drove the A- grade
The composite is a weighted blend of 9 inputs, each scored 0–100. Each bar is that input's sub-score; the figure is the points it added to the 100-point composite (weight × sub-score).
- Cash flow +30.0/30.0
- ARV discount +14.5/15.0
- DSCR +10.0/10.0
- Appreciation +10.0/10.0
- 1% rule +8.1/10.0
- Livability +3.2/5.0
- Schools +2.6/10.0
- Rent growth +2.5/5.0
- Condition / age +2.5/5.0
$99,500
🖨 Deal sheet 📄 Offer letter ✓ Due diligence
Listing remarks MLS
Looking for spacious like new everything?This is the home for you!4BR, 1BA w/ office that cld be 5th BR. Beautiful screened front porch for entertaining. CHA, plumbing, elec, roof updates in '13.Too much to list. Seller finance & lease purchase option available
Key facts
- Plumbing updates
- Fenced yard
- Driveway
Tags
Neighborhood map
What this means for you Summary
Snapshot
- This is a 4-bed/1.0-bath single-family listed at $100k.
Deal economics
- At list price, monthly cash flow is $396 ($5k/yr) — positive.
- The deal already cash-flows at list — no discount required.
- Meets the 1% rule at list price ($1k rent vs $100k).
- Cap rate 11.1% vs local median 4.7% in Bartlesville — top-decile yield for the area; either an underpriced asset or a hidden risk that comps aren't pricing in. Stress-test before assuming the spread holds.
Location & tenants
- Location reads 64/100 on livability (#175 in OK) — a middle-class / working-renter tenant base. Strengths: cost of living A+, housing A+; Watch: employment C-, schools D+, crime D+.
- Bartlesville (town): math 30% / reading 29% proficiency, ranked #59 of 270 in OK (top 22%) — low school quality limits family demand, transient renter base, plan for 1-2y turnover.
- Market conditions: 137 active listings in the ZIP; 46 units permitted in Washington County in 2024 (0 in 5+ unit buildings).
- This rent runs 33% of the median local income ($47k/yr) — at the standard rent-burdened threshold; future hikes will face affordability resistance.
Forward outlook
- In year one you build about $11k of equity ($688 loan paydown + $10k appreciation (10.0% local appreciation)).
- Washington County population projected at +12% by 2050 — modest demand growth; plan on rents tracking national, not racing it.
- At projected returns (10.0% appreciation + 3.0% rent growth), your $28k cash investment doubles in ~2 years — after that, you're playing with house money.
- By year 4, paydown + projected appreciation supports a ~$38k cash-out refi (75% LTV) — recoverable capital for the next deal without selling this one.
Negotiation context
- Only 14 days on market — expect competitive offers; lowballing is unlikely to land.
- 2 sale attempts since 13y ago with the ask held roughly flat each time — persistent listings suggest the price (not the market) is what's stuck; bring a comps-based counter.
- Current owner paid $63k; list at $100k implies a 58% gain — meaningful room to come down on a strong offer.
Risks & watch-outs
- Watch-outs: built in 1957 — expect roof / HVAC / electrical / plumbing capex.
- Climate carrying-cost: severe wildfire risk; extreme-heat days projected 7→19/yr by 2055 (HVAC capex compounding) — expect insurance premiums to compound above CPI over the hold.
Questions for the listing agent
- Built in 1957 — when were the roof, HVAC, electrical panel, plumbing, and water heater last replaced?
- Is there a deadline driving the sale (1031 exchange, divorce, estate, relocation)? That informs how much negotiation room exists.
- Schools are D-rated, which usually means shorter tenancies and higher turnover. Who's the typical renter profile here, and what's been the actual vacancy rate?
- Crime grade is D in this area — have there been break-ins, vandalism, or insurance claims at this property in the last 3 years? What carrier currently insures it and at what premium?
- What's the average days-on-market for RENTAL listings here right now (not sales)? A rising rental-DOM trend means longer vacancies and softer asking-rent achievability than the comps imply.
- What's the recent tenant-quality profile in this submarket — average credit score on applications, eviction rate, late-payment / NSF rate, and stable-employment percentage? A property-management company in the area should have these aggregated.
- How much new for-sale + rental construction is in the pipeline within 1–3 miles? Heavy new supply typically softens prices + rents 12–24 months out; constrained supply supports both.
Investment metrics
- 1% rule
- 1.31% ✓
- Cap rate
- 11.07%
- Cash-on-cash
- 17.06%
- DSCR
- 1.76
- GRM
- 6.4
CMA / ARV
- ARV (on-the-fly)
- $117,925
- Comps found
- 12
Show comp detail 12 sales within ~0.75 mi
| Address | Dist | Beds/Ba | Sqft | Sold | Price | $/sf | Match |
|---|---|---|---|---|---|---|---|
| 420 NW Lahoma Dr | 0.00mi | 4/1.0 | 1,417 (+7%) | 0mo | $100,400 | $71 | 88 |
| 402 Lahoma | 0.10mi | 3/1.5 (-1) | 1,233 (-7%) | 1mo | $107,500 | $87 | 76 |
| 421 NW Oak Park Rd | 0.07mi | 3/2.0 (-1) | 1,222 (-8%) | 2mo | $115,000 | $94 | 73 |
| 114 Ramblewood | 0.28mi | 3/2.0 (-1) | 1,414 (+7%) | 0mo | $145,000 | $103 | 66 |
| 521 Oak Park Rd | 0.30mi | 3/2.0 (-1) | 1,291 (-3%) | 8mo | $115,000 | $89 | 66 |
| 521 Lahoma | 0.20mi | 3/1.0 (-1) | 1,175 (-11%) | 7mo | $132,000 | $112 | 61 |
| 504 Highland Dr | 0.22mi | 3/1.5 (-1) | 1,154 (-13%) | 1mo | $60,000 | $52 | 61 |
| 430 NW Highland | 0.14mi | 3/1.0 (-1) | 1,138 (-14%) | 6mo | $100,000 | $88 | 60 |
| 507 Highland Dr | 0.24mi | 3/1.5 (-1) | 1,162 (-12%) | 2mo | $83,000 | $71 | 60 |
| 520 Highland Dr | 0.31mi | 4/1.5 | 1,149 (-13%) | 4mo | $135,000 | $117 | 58 |
| 518 Carol Rd | 0.40mi | 3/2.0 (-1) | 1,456 (+10%) | 2mo | $86,305 | $59 | 54 |
| 705 Palmetto Rd | 0.36mi | 3/2.0 (-1) | 1,144 (-14%) | 5mo | $120,000 | $105 | 47 |
Match score weights: distance 35% · size 25% · config 20% · recency 20%. Top-matched comps best support the ARV.
Projected returns pro-forma
10.0% appreciation · 3.0% rent growth · sell at horizon
- IRR
- 36.9%
- Equity multiple
- 3.85×
- Total profit
- $79,402
- Equity at exit
- $89,637
- IRR
- 31.8%
- Equity multiple
- 8.68×
- Total profit
- $213,964
- Equity at exit
- $193,307
Cash invested: $27,860 (down + closing). Projections, not guarantees.
Landlord ↔ Tenant lean methodology
- Overall (STATE)
- 83 Strongly Landlord-Friendly
- State Oklahoma
- 83 Strongly Landlord-Friendly · R+20
- County
- — inherits STATE
- City
- — inherits STATE
ZIP-level market 74003
- Home prices YoY
- 5.0%
- Active inventory
- 137
- Price-to-rent
- 6.4×
Monthly cashflow live
- Estimated rent
- $1,305 medium interval (Pro) →
- Mortgage (P&I)
- −$522
- Tax from tax record
- −$71 /mo · $856/yr
- Insurance
- −$41
- HOA
- −$0
- Vacancy / Maint / Mgmt
- −$274
- Net cashflow
- $396
Break-even live
UW: 25.0% down · 7.5% · 30yr · 1.5% tax · 5.0% vac · 8.0% maint · 8.0% mgmt
Financing live
Cash to close
- Down payment
- $24,875
- Closing costs
- $2,985
- Reserves months
- —
- Total cash needed
- —
Loan-product check · same deal, 3 products live
Conventional
25% down · 7.5% · 30yr
- Down + closing
- —
- Monthly P&I
- —
- Monthly cashflow
- —
- DSCR
- —
- Eligible?
- —
Personal DTI + credit; lowest rate.
DSCR
20% down · 8.5% · 30yr
- Down + closing
- —
- Monthly P&I
- —
- Monthly cashflow
- —
- DSCR
- —
- Eligible?
- —
No personal income docs; deal must DSCR.
Hard money
10% down · 12.0% · 12mo
- Down + closing
- —
- Monthly P&I
- —
- Monthly cashflow
- —
- DSCR
- —
- Eligible?
- —
Short-term bridge; refi at stabilization.
Listing history 6 events
-
2026-04-27status Pending
-
2026-04-14$99,500 Active
-
2013-11-18soldstatus $63,000
-
2013-11-14soldstatus $63,000 267-char remark
Show marketing remark (267 chars)
Looking for spacious like new everything?This is the home for you!4BR, 1BA w/ office that cld be 5th BR. Beautiful screened front porch for entertaining. CHA, plumbing, elec, roof updates in '13.Too much to list. Seller finance & lease purchase option available
-
2013-10-10historical 267-char remark
Show marketing remark (267 chars)
Looking for spacious like new everything?This is the home for you!4BR, 1BA w/ office that cld be 5th BR. Beautiful screened front porch for entertaining. CHA, plumbing, elec, roof updates in '13.Too much to list. Seller finance & lease purchase option available
-
2013-10-01$62,000 267-char remark
Show marketing remark (267 chars)
Looking for spacious like new everything?This is the home for you!4BR, 1BA w/ office that cld be 5th BR. Beautiful screened front porch for entertaining. CHA, plumbing, elec, roof updates in '13.Too much to list. Seller finance & lease purchase option available
ⓘ Source: listings_history table (triggers on properties + properties_extension) + one-shot
backfill from property_details.listing_events for pre-trigger history.
Tax reassessment forecast OK · Resets to sale price
- Current annual tax
- $856 · $71/mo
- Projected year-2 tax
- $895 · $75/mo
- Expected delta
- +$39/yr (+$3/mo · 4.6%)
ⓘ Screening estimate from a state-policy table — verify with the county assessor before closing.
Climate risk First Street
- Flood 1/10 Low FEMA zone X (unshaded) · 0% chance over 30 yrs
- Wildfire 8/10 Severe
- Heat 6/10 Major 7 d/yr ≥113°F today · 19 d/yr by 30 yrs out
- Wind 2/10 Low 3% chance of damaging wind over 30 yrs
- Air quality 2/10 Low 1 unhealthy d/yr today · 3 by 30 yrs out
Nearby sold comps map
Loading sold comps map…
Walkable amenities ~0.75 mi
Loading nearby amenities…
Taxation est. · year 1
- Rental income
- $15,655
- − Mortgage interest
- −$5,574
- − Property taxes
- −$856
- − Insurance
- −$498
- − Repairs & maintenance
- −$1,252
- − Management
- −$1,252
- − Depreciation
- −$2,895
- Taxable income
- $3,329
- Est. tax owed @ 24.0%
- −$799
- After-tax cash flow
- $3,954/yr
For passive investors: Depreciation is non-cash, so a rental often shows a tax loss while cash-flowing — sheltering income. Rental losses are passive: they offset passive income freely, and up to $25,000/yr can offset ordinary (W-2) income if you actively participate and your MAGI is under $100k (phasing out to $0 by $150k); unused losses carry forward. On sale, claimed depreciation is recaptured at up to 25%, and gains may owe capital-gains tax (a 1031 exchange can defer both). Figures are a year-1 estimate at your 24.0% rate — not tax advice; consult a CPA.
Schools (NCES district)
- District
- Bartlesville
- NCES district ID
- 4003630
- Math proficiency
- 30% ▼ -13.00%
- Reading proficiency
- 29% ▼ -10.00%
- Median HH income
- $48,889
- Composite
- 25.69/100
- National rank
- #7389
- State rank
- #59 of 270 in OK
Livability — Bartlesville
- Score
- 64/100
- State rank
- #175
- US rank
- #13940
Category grades
Schools grade is shown separately in the Schools card above.
Census & demographics
- Census place
- Bartlesville, OK
- County
- Washington County · 41,935 people
- City population
- 41,935
- Metro
- Bartlesville, OK
- Population (ZIP)
- 14,024
- Household income
- $47,168
- Rent vs Own
- Severe rent burden
- 395.0
Population outlook (Washington County) Hauer SSP2
- Today (2025)
- 54,946 people
- By 2030
- 56,249 · +2.4%
- By 2040
- 58,867 · +7.1%
- By 2050
- 61,600 · +12.1%
- By 2075
- 69,355 · +26.2%
- By 2100
- 73,067 · +33.0%
Race, ethnicity, and origin ACS 2023
- Neighborhood character
- Predominantly White (69%)
- Race & ethnicity
- White 69% Two or more races 14% Hispanic / Latino 7% Native American 7% Black 4%
- Hispanic origin (detail)
- Mexican 6%
- Common ancestry
- Slovak 2% Lithuanian 2% Italian 2%
- Foreign-born
- 2% · Canada
- Languages at home
- 96% English-only · Spanish 4%
Political lean MEDSL · Washington
- 2024 margin
- Solid R (+47.6) · D 25.0% · R 72.7% · Other 2.4%
- 2008→2024 swing
- -3.1pp toward R · 2008: -44.6pp · 2024: -47.6pp
- All cycles
- 2024: R+47.6 2020: R+48.0 2016: R+48.5 2012: R+47.8 2008: R+44.6
Not yet ingested
- Civics
- —
Market trends
- HPI YoY
- ▲ 14.78%
- Current HPI
- 309.9534
- Rent YoY
- —
- Metro
- Bartlesville, OK
- State GDP YoY
- ▲ 1.55%
- F500 in state
- 6
Industry mix (Fortune 500 HQ in OK)
| Industry | F500 HQs | Revenue |
|---|---|---|
| Energy | 3 | $48B |
|
||
Price history
+60.5% since first listed6 events — show timeline
- 2026-04-27 Pending — MLS Technology, Inc.
- 2026-04-14 Listed $99,500 MLS Technology, Inc.
- 2013-11-18 Sold (Public Records) $63,000 Public Records
- 2013-11-14 Sold (MLS) $63,000 MLS Technology, Inc.
- 2013-10-10 Listing Removed — MLS Technology, Inc.
- 2013-10-01 Listed $62,000 MLS Technology, Inc.
Property tax history
+1.1%/yrLatest (2025): $856 · +0.4% YoY. Source: county tax records.
Cash-flow waterfall
monthlySold comps — $/sqft
last 12 mo · ≤1 miLoading sold comps…