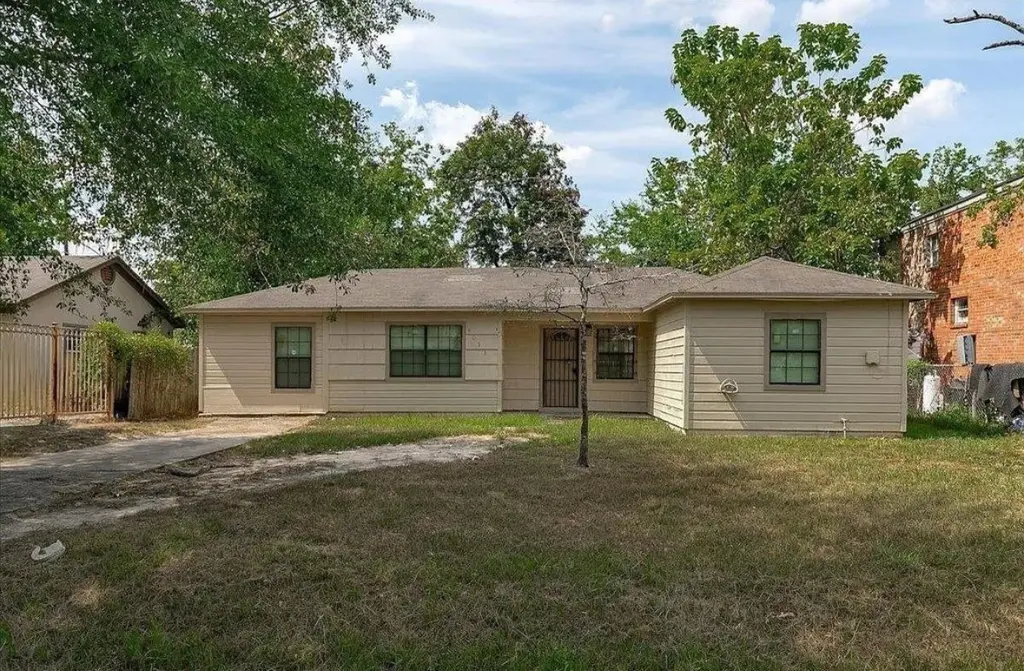
9033 Oak Knoll Ln · Houston, TX
Flood risk 1/10 · Minimal
- FEMA flood zone
- X (unshaded)
- Chance of flooding over 30 yrs
- 0.0%
- Est. flood insurance / yr
- $507 – $1,088
Fire risk 3/10 · Minor
- Est. fire insurance / yr
- $1,222 – $2,270
Heat risk 9/10 · Severe
- Hot days now (above 110°F)
- 7 days/yr
- Hot days in 30 yrs
- 25 days/yr
Wind risk 9/10 · Severe
- Chance of severe wind over 30 yrs
- 99.0%
Air-quality risk 3/10 · Minor
- Unhealthy air days now
- 2 days/yr
- Unhealthy air days in 30 yrs
- 3 days/yr
Risk factors via First Street. Map © Google.
Why this score? — see what drove the D+ grade
The composite is a weighted blend of 9 inputs, each scored 0–100. Each bar is that input's sub-score; the figure is the points it added to the 100-point composite (weight × sub-score).
- Cash flow +16.3/30.0
- Appreciation +6.2/10.0
- ARV discount +5.9/15.0
- DSCR +5.0/10.0
- 1% rule +4.6/10.0
- Livability +3.7/5.0
- Schools +2.7/10.0
- Rent growth +2.5/5.0
- Condition / age +2.5/5.0
$170,000
🖨 Deal sheet (PDF) 📄 Offer letter ✓ Due diligence
Listing remarks
Cozy and well-located home offering comfortable living in a quiet neighborhood with easy access to major highways, shopping, and dining. Ideal for those seeking convenience and a welcoming residential setting.
Key facts
- 7,318 sq ft lot
- Built 1953
- Listed 26 days
Property features AI
Finance
- Financial info: Lease considered
Exterior
- Utilities: Public water; Public sewer
- Home design: Residential property; Built in 1953; Entry level: First floor
- Construction: Slab foundation; Composition roof
- Exterior features: Located in a subdivision
Interior
- Kitchen: Gas cooktop; Gas oven
- Bedrooms: Primary bedroom on the first floor; Bedroom on the second floor; Bedroom on the third floor; Three total rooms
- Bathrooms: 1 full bathroom
- Heating & cooling: Central heating (electric); Central air conditioning (electric)
- Interior features: Washer and dryer hookups (electric and gas); Gas cooktop, Gas oven
- Laundry & utility: Washer hookup; Electric dryer hookup; Gas dryer hookup
Neighborhood map
What this means for you Summary
Snapshot
- This is a 3-bed/1.0-bath single-family listed at $170k.
Deal economics
- At list price, monthly cash flow is $93 ($1k/yr) — positive.
- The deal already cash-flows at list — no discount required.
- To meet the 1% rule (rent ≥ 1% of price), the offer needs to be $162k (4.4% below list).
- Recommended offer: $162k (4.4% below list) — sets the bar for 1% rule.
Location & tenants
- Location reads 74/100 on livability (#184 in TX, #4,771 nationally) — a middle-class / working-renter tenant base. Strengths: amenities A+, cost of living A+, housing A+; Watch: crime F.
- Houston ISD (urban): math 27% / reading 35% proficiency, ranked #593 of 826 in TX (top 72%) — families likely to look elsewhere, expect single-tenant / working-renter base with shorter leases; 71% free/reduced lunch — lower-income household profile, screen leases tightly.
- Zoned schools: Elmore El (math 12% / reading 14%, grade F, #4,152 of 4,322 statewide, top 96%, 532 students, 99% FRL); Key Middle (math 10% / reading 20%, grade F, #1,569 of 1,662 statewide, top 95%, 615 students, 100% FRL); Kashmere H S (math 14% / reading 22%, grade F, #1,445 of 1,632 statewide, top 89%, 725 students, 96% FRL) — zoned schools average 98% FRL vs 71% district-wide (27 pts higher); higher-poverty schools than district average — tighter screening recommended.
- Zoned-school proficiency averages 15% at this address vs 31% district-wide (-16 pts) — the specific schools serving this property underperform the Houston ISD average; the district grade overstates school quality for this exact location.
- Market conditions: 131 active listings in the ZIP; 30 comparable units currently listed for rent nearby; rentals lingering (median 45d on market — plan ~5-8 weeks vacancy on turnover, expect pricing pressure); 53% of comp listings sitting > 30 days — soft ceiling on asking rent; lower-income renter base — watch delinquency; 29,883 units permitted in Harris County in 2024 (8,621 in 5+ unit buildings).
Forward outlook
- In year one you build about $5k of equity ($1k loan paydown + $4k appreciation (2.5% local appreciation)).
- Harris County population projected at +47% by 2050 — long-run rental-demand tailwind backs the buy-and-hold thesis.
- At projected returns (2.5% appreciation + 3.0% rent growth), your $48k cash investment doubles in ~6 years — after that, you're playing with house money.
- By year 7, paydown + projected appreciation supports a ~$34k cash-out refi (75% LTV) — recoverable capital for the next deal without selling this one.
Negotiation context
- It's been on market 26 days — a 2% lower offer ($167k) is reasonable based on typical stale-listing flexibility.
- 12 sale attempts since 11y ago; this cycle's ask has dropped $15k (8%) from the opening price — seller is motivated, your offer sets the floor, not the list.
- Current owner paid $14k; list at $170k implies a 1114% gain — meaningful room to come down on a strong offer.
Risks & watch-outs
- Watch-outs: built in 1953 — expect roof / HVAC / electrical / plumbing capex.
Questions for the listing agent
- Built in 1953 — when were the roof, HVAC, electrical panel, plumbing, and water heater last replaced?
- Is there a deadline driving the sale (1031 exchange, divorce, estate, relocation)? That informs how much negotiation room exists.
- Schools are D-rated, which usually means shorter tenancies and higher turnover. Who's the typical renter profile here, and what's been the actual vacancy rate?
- Crime grade is F in this area — have there been break-ins, vandalism, or insurance claims at this property in the last 3 years? What carrier currently insures it and at what premium?
- The area grade is low — what's the realistic commute time and amenity access for the typical tenant pool here? Any planned neighborhood developments (good or bad) we should know about?
- What's the average days-on-market for RENTAL listings here right now (not sales)? A rising rental-DOM trend means longer vacancies and softer asking-rent achievability than the comps imply.
- What's the recent tenant-quality profile in this submarket — average credit score on applications, eviction rate, late-payment / NSF rate, and stable-employment percentage? A property-management company in the area should have these aggregated.
- How much new for-sale + rental construction is in the pipeline within 1–3 miles? Heavy new supply typically softens prices + rents 12–24 months out; constrained supply supports both.
Investment metrics
- 1% rule
- 0.96% ✗
- Cap rate
- 6.95%
- Cash-on-cash
- 2.35%
- DSCR
- 1.10
- GRM
- 8.7
CMA / ARV
- ARV (on-the-fly)
- $164,082
- Comps found
- 12
Show comp detail 12 sales within ~0.75 mi
| Address | Dist | Beds/Ba | Sqft | Sold | Price | $/sf | Match |
|---|---|---|---|---|---|---|---|
| 8901 Woodlyn Rd | 0.24mi | 3/1.0 | 1,228 (+3%) | 2mo | $155,000 | $126 | 82 |
| 8913 Linda Vista Rd | 0.18mi | 3/1.0 | 1,266 (+6%) | 4mo | $175,000 | $138 | 78 |
| 9037 Linda Vista Rd | 0.06mi | 3/2.0 | 1,092 (-8%) | 6mo | $189,000 | $173 | 74 |
| 9219 Linda Vista Rd | 0.28mi | 3/1.5 | 1,335 (+12%) | 1mo | $210,000 | $157 | 64 |
| 9306 Woodlyn Rd | 0.44mi | 3/1.0 | 1,139 (-4%) | 12mo | $143,800 | $126 | 63 |
| 9203 Richland Dr | 0.25mi | 3/1.5 | 1,060 (-11%) | 12mo | $143,000 | $135 | 59 |
| 9011 Parkette Dr | 0.62mi | 3/1.0 | 1,226 (+3%) | 9mo | $135,000 | $110 | 58 |
| 9334 Laura Koppe Rd | 0.52mi | 3/2.0 | 1,080 (-9%) | 3mo | $189,900 | $176 | 54 |
| 8546 Talton St | 0.62mi | 3/1.0 | 1,120 (-6%) | 10mo | $129,900 | $116 | 53 |
| 9319 Richland Dr | 0.49mi | 3/1.5 | 1,036 (-13%) | 12mo | $145,000 | $140 | 44 |
| 9415 Balsam Ln | 0.64mi | 4/1.0 (+1) | 1,308 (+10%) | 8mo | $150,000 | $115 | 41 |
| 9327 Richland Dr | 0.51mi | 3/1.5 | 1,018 (-14%) | 13mo | $140,000 | $138 | 39 |
Match score weights: distance 35% · size 25% · config 20% · recency 20%. Top-matched comps best support the ARV.
Projected returns pro-forma
2.5% appreciation · 3.0% rent growth · sell at horizon
- IRR
- 8.3%
- Equity multiple
- 1.46×
- Total profit
- $21,979
- Equity at exit
- $71,671
- IRR
- 11.2%
- Equity multiple
- 2.59×
- Total profit
- $75,671
- Equity at exit
- $106,881
Cash invested: $47,600 (down + closing). Projections, not guarantees.
Landlord ↔ Tenant lean methodology
- Overall (STATE)
- 87 Strongly Landlord-Friendly
- State Texas
- 87 Strongly Landlord-Friendly · R+5
- County
- — inherits STATE
- City
- — inherits STATE
ZIP-level market 77078
- Home prices YoY
- 0.8%
- Active inventory
- 131
- Price-to-rent
- 8.7×
Monthly cashflow live
- Estimated rent
- $1,625 high interval (Pro) →
- Mortgage (P&I)
- −$891
- Tax from tax record
- −$228 /mo · $2,736/yr
- Insurance
- −$71
- HOA
- −$0
- Vacancy / Maint / Mgmt
- −$341
- Net cashflow
- $93
Break-even live
Sensitivity live
| Price | -10% $190 | -5% $142 | +0% $93 | +5% $45 | +10% $-3 |
|---|---|---|---|---|---|
| Rent | -10% $-35 | -5% $29 | +0% $93 | +5% $158 | +10% $222 |
| Rate | -1.0pp $179 | -0.5pp $137 | base $93 | +0.5pp $49 | +1.0pp $5 |
UW: 25.0% down · 7.5% · 30yr · 1.5% tax · 5.0% vac · 8.0% maint · 8.0% mgmt
Financing live
Cash to close
- Down payment
- $42,500
- Closing costs
- $5,100
- Reserves months
- —
- Total cash needed
- —
Loan-product check · same deal, 3 products live
Conventional
25% down · 7.5% · 30yr
- Down + closing
- —
- Monthly P&I
- —
- Monthly cashflow
- —
- DSCR
- —
- Eligible?
- —
Personal DTI + credit; lowest rate.
DSCR
20% down · 8.5% · 30yr
- Down + closing
- —
- Monthly P&I
- —
- Monthly cashflow
- —
- DSCR
- —
- Eligible?
- —
No personal income docs; deal must DSCR.
Hard money
10% down · 12.0% · 12mo
- Down + closing
- —
- Monthly P&I
- —
- Monthly cashflow
- —
- DSCR
- —
- Eligible?
- —
Short-term bridge; refi at stabilization.
Rent comps 30 comps
| Address | Beds | Baths | Sqft | Rent | $/sqft | DOM | Units | Dist |
|---|---|---|---|---|---|---|---|---|
| 9133 Woodlyn Rd Houston, TX | 3.0 | 1.0 | 1073 | $1,495 | $1.39 | 4d | 1 | 0.17mi |
| 9026 Lake Forest Blvd Houston, TX | 3.0 | 1.0 | 977 | $1,397 | $1.43 | 0d | 1 | 0.32mi |
| 8631 Homewood Ln Unit A Houston, TX | 3.0 | 2.5 | 1500 | $1,850 | $1.23 | 45d | 1 | 0.49mi |
| 8631 Homewood Ln Unit B Houston, TX | 3.0 | 3.0 | 1500 | $1,850 | $1.23 | 45d | 1 | 0.49mi |
| 8627 Homewood Ln Unit B Houston, TX | 3.0 | 2.5 | 1500 | $1,850 | $1.23 | 45d | 1 | 0.50mi |
| 8625 Homewood Ln Unit B Houston, TX | 3.0 | 3.0 | 1500 | $1,850 | $1.23 | 45d | 1 | 0.51mi |
| 8602 Wilkins Oaks Dr Houston, TX | 3.0 | 2.0 | 1307 | $1,775 | $1.36 | 45d | 1 | 0.52mi |
| 8623 Homewood Ln Unit B Houston, TX | 3.0 | 2.5 | 1150 | $1,850 | $1.61 | 20d | 1 | 0.52mi |
| 8623 Homewood Unit A Houston, TX | 3.0 | 2.5 | 1150 | $1,850 | $1.61 | 45d | 1 | 0.52mi |
| 8711 Southwark St Unit A Houston, TX | 3.0 | 2.0 | 1150 | $1,750 | $1.52 | 45d | 1 | 0.62mi |
| 9110 Tidwell Rd Houston, TX | 2.0 | 2.0 | 987 | $1,185 | $1.20 | 45d | 1 | 0.65mi |
| 9110 Tidwell Rd Houston, TX | 2.0 | 2.0 | 987 | $1,200 | $1.22 | 25d | 1 | 0.65mi |
| 9222 Hillis St Houston, TX | 3.0 | 2.0 | 1498 | $1,850 | $1.23 | 45d | 1 | 0.82mi |
| 9399 Tidwell Rd Houston, TX | 2.0 | 2.0 | 862 | $982 | $1.14 | 45d | 1 | 0.87mi |
| 9399 Tidwell Rd Houston, TX | 2.0 | 2.0 | 862 | $982 | $1.14 | 22d | 1 | 0.87mi |
| 9399 Tidwell Rd Houston, TX | 3.0 | 2.0 | 1031 | $1,107 | $1.07 | 25d | 1 | 0.87mi |
| 7600 E Houston Rd Houston, TX | 1.0–3.0 | 1.0–2.0 | 1017 | $1,436 | $1.41 | 15d | 8 | 0.90mi |
| 9393 Tidwell Rd Houston, TX | 2.0–4.0 | 2.0 | 1050 | $1,264 | $1.20 | 0d | 11 | 0.97mi |
| 9700 Mesa Dr Houston, TX | 1.0–3.0 | 1.0–2.0 | 784 | $989 | $1.26 | 0d | 9 | 1.03mi |
| 8309 Carolwood Dr Houston, TX | 3.0 | 1.0 | 938 | $1,350 | $1.44 | 45d | 1 | 1.09mi |
| 8350 Tidwell Rd Unit A Houston, TX | 3.0 | 2.0 | 980 | $975 | $0.99 | 45d | 1 | 1.12mi |
| 8346 Tidwell Rd Unit B Houston, TX | 3.0 | 2.0 | 980 | $1,000 | $1.02 | 45d | 1 | 1.13mi |
| 8600 Sterlingshire St Houston, TX | 1.0–2.0 | 1.0 | 732 | $1,050 | $1.43 | 25d | 2 | 1.14mi |
| 8213 Linda Vista Rd Houston, TX | 3.0 | 2.0 | 1298 | $1,625 | $1.25 | 25d | 1 | 1.16mi |
| 9943 Valley Wind Dr Houston, TX | 3.0 | 2.0 | 1319 | $1,575 | $1.19 | 0d | 1 | 1.16mi |
| 8216 Richland Dr Unit B Houston, TX | 3.0 | 2.0 | 1150 | $1,750 | $1.52 | 45d | 1 | 1.16mi |
| 8113 Denton St Houston, TX | 3.0 | 2.0 | 1150 | $1,750 | $1.52 | 45d | 1 | 1.24mi |
| 9405 Caddo Rd Houston, TX | 3.0 | 2.0 | 1298 | $1,675 | $1.29 | 0d | 1 | 1.24mi |
| 8523 Brock Park Blvd Unit 1 Houston, TX | 3.0 | 1.5 | 1130 | $1,375 | $1.22 | 6d | 1 | 1.25mi |
| 9930 Valley Lake Dr Houston, TX | 4.0 | 2.0 | 1385 | $1,795 | $1.30 | 45d | 1 | 1.44mi |
Listing history 13 events
-
2026-06-21days on market $170,000 Active 26 DOM
-
2026-06-18days on market $170,000 Active 23 DOM
-
2026-06-17days on market $170,000 Active 22 DOM
-
2026-06-16days on market $170,000 Active 21 DOM
-
2026-06-15days on market $170,000 Active 20 DOM
-
2026-06-13days on market $170,000 Active 18 DOM
-
2026-06-09days on market $170,000 Active 14 DOM
-
2026-06-08days on market $170,000 Active 13 DOM
-
2026-06-07days on market $170,000 Active 12 DOM
-
2026-06-04days on market $170,000 Active 9 DOM
-
2026-06-03days on market $170,000 Active 8 DOM
-
2026-06-02remarks 209-char remark
-
2026-06-02$170,000 Active 7 DOM
ⓘ Source: listings_history table (triggers on properties + properties_extension) + one-shot
backfill from property_details.listing_events for pre-trigger history.
Tax reassessment forecast TX · Resets to sale price
- Current annual tax
- $2,736 · $228/mo
- Projected year-2 tax
- $3,111 · $259/mo
- Expected delta
- +$375/yr (+$31/mo · 13.7%)
ⓘ Screening estimate from a state-policy table — verify with the county assessor before closing.
Climate risk First Street
- Flood 1/10 Low FEMA zone X (unshaded) · 0% chance over 30 yrs
- Wildfire 3/10 Moderate
- Heat 9/10 Extreme 7 d/yr ≥110°F today · 25 d/yr by 30 yrs out
- Wind 9/10 Extreme 99% chance of damaging wind over 30 yrs
- Air quality 3/10 Moderate 2 unhealthy d/yr today · 3 by 30 yrs out
Nearby sold comps map
Loading sold comps map…
Walkable amenities ~0.75 mi
Loading nearby amenities…
Taxation est. · year 1
- Rental income
- $19,500
- − Mortgage interest
- −$9,523
- − Property taxes
- −$2,736
- − Insurance
- −$850
- − Repairs & maintenance
- −$1,560
- − Management
- −$1,560
- − Depreciation
- −$4,945
- Taxable loss
- −$1,674
- Est. tax savings @ 24.0%
- +$402
- After-tax cash flow
- $1,523/yr
For passive investors: Depreciation is non-cash, so a rental often shows a tax loss while cash-flowing — sheltering income. Rental losses are passive: they offset passive income freely, and up to $25,000/yr can offset ordinary (W-2) income if you actively participate and your MAGI is under $100k (phasing out to $0 by $150k); unused losses carry forward. On sale, claimed depreciation is recaptured at up to 25%, and gains may owe capital-gains tax (a 1031 exchange can defer both). Figures are a year-1 estimate at your 24.0% rate — not tax advice; consult a CPA.
Schools (NCES district)
- District
- Houston ISD
- NCES district ID
- 4823640
- Math proficiency
- 27% ▼ -18.00%
- Reading proficiency
- 35% ▼ -6.00%
- Median HH income
- $46,054
- Composite
- 26.63/100
- National rank
- #7173
- State rank
- #593 of 826 in TX
Livability — Houston
- Score
- 74/100
- State rank
- #184
- US rank
- #4771
Category grades
Schools grade is shown separately in the Schools card above.
Census & demographics
- Census place
- Houston, TX
- County
- Harris County · 4,702,590 people
- City population
- 3,226,434
- Metro
- Houston-The Woodlands-Sugar Land, TX
- Population (ZIP)
- 14,247
- Household income
- $39,093
- Rent vs Own
- Severe rent burden
- 780.0
Population outlook (Harris County) Hauer SSP2
- Today (2025)
- 5,571,493 people
- By 2030
- 6,089,821 · +9.3%
- By 2040
- 7,142,806 · +28.2%
- By 2050
- 8,185,864 · +46.9%
- By 2075
- 10,574,329 · +89.8%
- By 2100
- 12,109,958 · +117.4%
Race, ethnicity, and origin ACS 2023
- Race & ethnicity
- Black 49% Hispanic / Latino 46% Two or more races 15% White 5%
- Hispanic origin (detail)
- Mexican 36% Cuban 1%
- Common ancestry
- Italian 1% Hispanic 1%
- Foreign-born
- 24% · Canada
- Languages at home
- 59% English-only · Spanish 41%
Political lean MEDSL · Harris
- 2024 margin
- Lean D (+5.5) · D 52.0% · R 46.4% · Other 1.6%
- 2008→2024 swing
- +3.9pp toward D · 2008: 1.6pp · 2024: 5.5pp
- All cycles
- 2024: D+5.5 2020: D+13.3 2016: D+12.4 2012: D+0.1 2008: D+1.6
Not yet ingested
- Civics
- —
Market trends
- HPI YoY
- ▲ 2.50%
- Current HPI
- 307.0842
- Rent YoY
- —
- Metro
- Houston-The Woodlands-Sugar Land, TX
- State GDP YoY
- ▲ 3.95%
- F500 in state
- 110
Industry mix (Fortune 500 HQ in TX)
| Industry | F500 HQs | Revenue |
|---|---|---|
| Energy | 16 | $1,198B |
|
||
| Technology | 5 | $198B |
|
||
| Engineering / Construction | 4 | $72B |
|
||
| Energy Services | 3 | $60B |
|
||
| Utilities | 3 | $41B |
|
||
| Healthcare | 2 | $330B |
|
||
Price history
+1114.3% since first listed32 events — show timeline
- 2026-06-02 Relisted — HARMLS
- 2026-06-02 Price Changed $170,000 HARMLS
- 2026-04-14 Listing Removed — HARMLS
- 2026-04-10 Rental Removed $1,500 HARMLS
- 2026-04-07 Listing Removed — HARMLS
- 2026-04-07 Listed $185,000 HARMLS
- 2026-03-31 Price Changed $185,000 HARMLS
- 2026-02-27 Listed $195,000 HARMLS
- 2026-02-14 Listed for Rent $1,500 HARMLS
- 2026-02-11 Rental Removed $1,500 HARMLS
- 2026-01-22 Listed for Rent $1,500 HARMLS
- 2026-01-22 Rental Removed $1,550 HARMLS
- 2026-01-10 Listed for Rent $1,550 HARMLS
- 2025-12-21 Rental Removed $1,550 HARMLS
- 2025-12-18 Listed for Rent $1,550 HARMLS
- 2025-12-11 Rental Removed $1,550 HARMLS
- 2025-11-14 Listed for Rent $1,550 HARMLS
- 2024-11-14 Rental Removed $1,550 HARMLS
- 2024-10-22 Listed for Rent $1,550 HARMLS
- 2024-10-21 Listed $1,550 HARMLS
- 2024-10-21 Listing Removed — HARMLS
- 2022-11-29 Listing Removed — HARMLS
- 2022-08-09 Listed $180,000 HARMLS
- 2018-08-14 Sold (Public Records) — Public Records
- 2016-08-31 Sold (Public Records) — Public Records
- 2016-08-08 Sold (Public Records) — Public Records
- 2015-05-01 Listing Removed — HARMLS
- 2015-01-28 Price Changed $64,900 HARMLS
- 2015-01-02 Listed $70,000 HARMLS
- 2014-12-11 Sold (Public Records) — Public Records
- 2000-08-01 Sold (Public Records) — Public Records
- 1992-01-01 Sold (Public Records) $14,000 Public Records
Property tax history
+3.9%/yrLatest (2025): $2,736 · +4.6% YoY. Source: county tax records.
Cash-flow waterfall
monthlySold comps — $/sqft
last 12 mo · ≤1 miLoading sold comps…