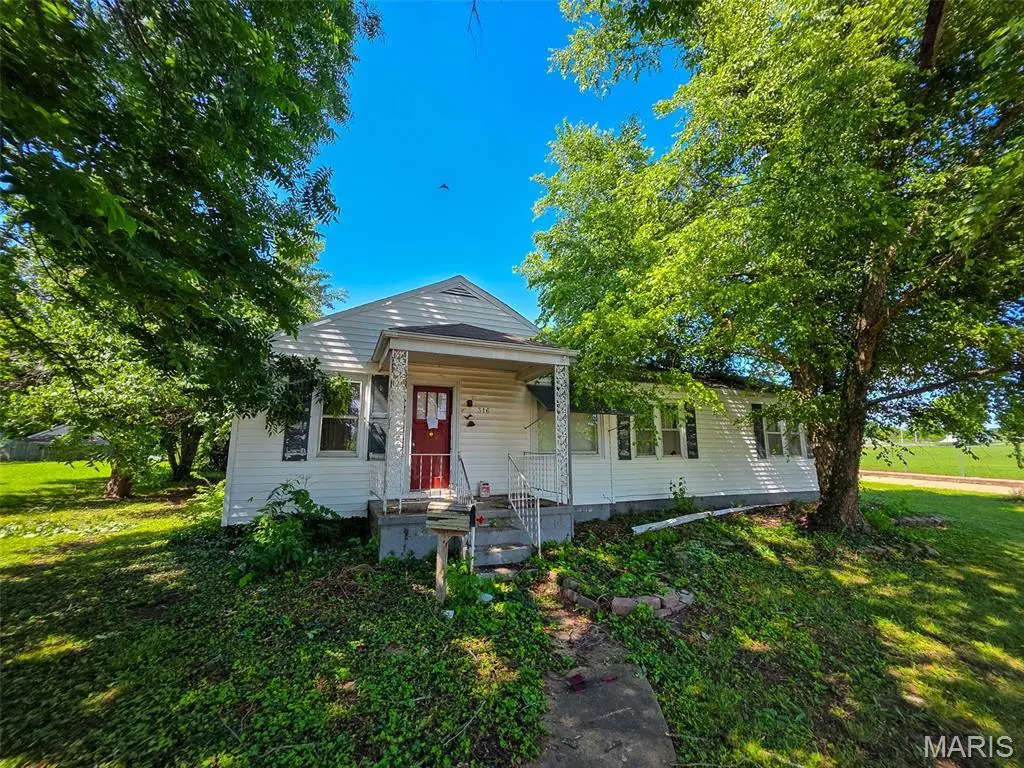
316 Albert St · Fredericktown, MO
Flood risk 1/10 · Minimal
- FEMA flood zone
- X (unshaded)
- Chance of flooding over 30 yrs
- 0.0%
- Est. flood insurance / yr
- $507 – $1,088
Fire risk 4/10 · Minor
- Est. fire insurance / yr
- $1,054 – $1,958
Heat risk 5/10 · Moderate
- Hot days now (above 104°F)
- 7 days/yr
- Hot days in 30 yrs
- 22 days/yr
Wind risk 2/10 · Minimal
- Chance of severe wind over 30 yrs
- 2.0%
Air-quality risk 2/10 · Minimal
- Unhealthy air days now
- 0 days/yr
- Unhealthy air days in 30 yrs
- 1 days/yr
Risk factors via First Street. Map © Google.
Why this score? — see what drove the D grade
The composite is a weighted blend of 9 inputs, each scored 0–100. Each bar is that input's sub-score; the figure is the points it added to the 100-point composite (weight × sub-score).
- Cash flow +15.0/30.0
- ARV discount +7.5/15.0
- 1% rule +5.0/10.0
- DSCR +5.0/10.0
- Schools +3.3/10.0
- Livability +3.0/5.0
- Rent growth +2.5/5.0
- Condition / age +2.5/5.0
- Appreciation +0.0/10.0
$25,000
🖨 Deal sheet (PDF) 📄 Offer letter ✓ Due diligence
Listing remarks
Opportunity awaits with this corner-lot property in a desirable location within walking distance to the elementary school. The property features a spacious yard shaded by mature trees, offering excellent curb appeal and a great setting for future improvements. The home features a basement and detached garage but is currently not habitable and will require substantial repairs and renovations. For many buyers, this property may present an ideal opportunity to remove the existing structure and build new. However, for those with the vision, skills, and resources to take on a major renovation project, there is significant potential to create value and build instant sweat equity. Whether you're a
Key facts
- Spacious yard
- Corner-lot property
- Mature trees
Tags
Property features AI
Finance
- Other: Property type listed as Residential, single family residence
- Financial info: Not specified
- HOA & community: Not specified
Exterior
- Parking: Detached or attached garage with room for 1 car (approx. 12 x 20)
- Security: Not specified
- Utilities: Public water; Public sewer; Single-phase electric; Cable available; Electricity connected; Natural gas available
- Home design: Single-family residence; One level
- Construction: Vinyl siding construction; Living area reported as 1,840 (source: assessor)
- Exterior features: Corner lot; Lot dimensions approximately 100 x 130
Interior
- Kitchen: No appliances specified
- Bedrooms: 2 bedrooms (both on the main level)
- Flooring: Not specified
- Bathrooms: 1 full bathroom; 1 half bathroom
- Heating & cooling: No heating; No cooling
- Interior features: Basement with concrete floor
- Laundry & utility: No laundry appliances specified
Neighborhood map
What this means for you Summary
Snapshot
- This is a 3-bed/1.5-bath other listed at $25k.
Deal economics
- At list price, monthly cash flow is $845 ($10k/yr) — positive.
- The deal already cash-flows at list — no discount required.
- Meets the 1% rule at list price ($1k rent vs $25k).
- Cap rate 46.8% vs local median 5.0% in Fredericktown — top-decile yield for the area; either an underpriced asset or a hidden risk that comps aren't pricing in. Stress-test before assuming the spread holds.
Location & tenants
- Location reads 60/100 on livability (#493 in MO) — a middle-class / working-renter tenant base. Strengths: cost of living A+, housing B+; Watch: amenities F, commute F, employment D-.
- Fredericktown R-I (town): math 35% / reading 45% proficiency, ranked #164 of 324 in MO (top 51%) — families likely to look elsewhere, expect single-tenant / working-renter base with shorter leases.
- Zoned schools: Fredericktown Elem. (411 students, 60% FRL); Fredericktown High (math 32% / reading 47%, grade F, #247 of 521 statewide, top 55%, 588 students, 50% FRL) — zoned schools at 55% FRL track the district average.
- Market conditions: 192 active listings in the ZIP.
Forward outlook
- Local home prices are declining (-3.0%/yr); year-one equity from $173 of loan paydown is wiped out by about $750 of value loss. Plan a longer hold.
- At projected returns (-3.0% appreciation + 3.0% rent growth), your $7k cash investment doubles in ~1 year — after that, you're playing with house money.
Negotiation context
- Only 2 days on market — expect competitive offers; lowballing is unlikely to land.
Risks & watch-outs
- Watch-outs: property tax is 3.7% of price; built in 1947 — expect roof / HVAC / electrical / plumbing capex.
- Climate carrying-cost: extreme-heat days projected 7→22/yr by 2055 (HVAC capex compounding) — expect insurance premiums to compound above CPI over the hold.
Questions for the listing agent
- Built in 1947 — when were the roof, HVAC, electrical panel, plumbing, and water heater last replaced?
- Property tax is high relative to price — has the assessment been appealed recently, and will the sale trigger a re-assessment?
- Is there a deadline driving the sale (1031 exchange, divorce, estate, relocation)? That informs how much negotiation room exists.
- Schools are F-rated, which usually means shorter tenancies and higher turnover. Who's the typical renter profile here, and what's been the actual vacancy rate?
- The area grade is low — what's the realistic commute time and amenity access for the typical tenant pool here? Any planned neighborhood developments (good or bad) we should know about?
- What's the average days-on-market for RENTAL listings here right now (not sales)? A rising rental-DOM trend means longer vacancies and softer asking-rent achievability than the comps imply.
- What's the recent tenant-quality profile in this submarket — average credit score on applications, eviction rate, late-payment / NSF rate, and stable-employment percentage? A property-management company in the area should have these aggregated.
- How much new for-sale + rental construction is in the pipeline within 1–3 miles? Heavy new supply typically softens prices + rents 12–24 months out; constrained supply supports both.
Investment metrics
- 1% rule
- 5.38% ✓
- Cap rate
- 46.83%
- Cash-on-cash
- 144.77%
- DSCR
- 7.44
- GRM
- 1.5
CMA / ARV
No comps found within radius.
Projected returns pro-forma
-3.0% appreciation · 3.0% rent growth · sell at horizon
- IRR
- —
- Equity multiple
- 8.11×
- Total profit
- $49,784
- Equity at exit
- $3,728
- IRR
- —
- Equity multiple
- 17.12×
- Total profit
- $112,807
- Equity at exit
- $2,162
Cash invested: $7,000 (down + closing). Projections, not guarantees.
Landlord ↔ Tenant lean methodology
- Overall (STATE)
- 81 Strongly Landlord-Friendly
- State Missouri
- 81 Strongly Landlord-Friendly · R+10
- County
- — inherits STATE
- City
- — inherits STATE
ZIP-level market 63645
- Home prices YoY
- -8.1%
- Active inventory
- 192
- Price-to-rent
- 1.5×
Monthly cashflow live
- Estimated rent
- $1,346 medium interval (Pro) →
- Mortgage (P&I)
- −$131
- Tax from tax record
- −$77 /mo · $926/yr
- Insurance
- −$10
- HOA
- −$0
- Vacancy / Maint / Mgmt
- −$283
- Net cashflow
- $845
Break-even live
Sensitivity live
| Price | -10% $859 | -5% $852 | +0% $845 | +5% $837 | +10% $830 |
|---|---|---|---|---|---|
| Rent | -10% $738 | -5% $791 | +0% $845 | +5% $898 | +10% $951 |
| Rate | -1.0pp $857 | -0.5pp $851 | base $845 | +0.5pp $838 | +1.0pp $831 |
UW: 25.0% down · 7.5% · 30yr · 1.5% tax · 5.0% vac · 8.0% maint · 8.0% mgmt
Financing live
Cash to close
- Down payment
- $6,250
- Closing costs
- $750
- Reserves months
- —
- Total cash needed
- —
Loan-product check · same deal, 3 products live
Conventional
25% down · 7.5% · 30yr
- Down + closing
- —
- Monthly P&I
- —
- Monthly cashflow
- —
- DSCR
- —
- Eligible?
- —
Personal DTI + credit; lowest rate.
DSCR
20% down · 8.5% · 30yr
- Down + closing
- —
- Monthly P&I
- —
- Monthly cashflow
- —
- DSCR
- —
- Eligible?
- —
No personal income docs; deal must DSCR.
Hard money
10% down · 12.0% · 12mo
- Down + closing
- —
- Monthly P&I
- —
- Monthly cashflow
- —
- DSCR
- —
- Eligible?
- —
Short-term bridge; refi at stabilization.
Listing history 3 events
-
2026-06-07statusdays on market $25,000 Pending 2 DOM
-
2026-06-03remarks 699-char remark
-
2026-06-03$25,000 Active 1 DOM
ⓘ Source: listings_history table (triggers on properties + properties_extension) + one-shot
backfill from property_details.listing_events for pre-trigger history.
Tax reassessment forecast MO · Resets to sale price
- Current annual tax
- $926 · $77/mo
- Projected year-2 tax
- $926 · $77/mo
- Expected delta
- $0/yr ($0/mo · 0.0%)
ⓘ Screening estimate from a state-policy table — verify with the county assessor before closing.
Climate risk First Street
- Flood 1/10 Low FEMA zone X (unshaded) · 0% chance over 30 yrs
- Wildfire 4/10 Moderate
- Heat 5/10 Major 7 d/yr ≥104°F today · 22 d/yr by 30 yrs out
- Wind 2/10 Low 2% chance of damaging wind over 30 yrs
- Air quality 2/10 Low 0 unhealthy d/yr today · 1 by 30 yrs out
Nearby sold comps map
Loading sold comps map…
Walkable amenities ~0.75 mi
Loading nearby amenities…
Taxation est. · year 1
- Rental income
- $16,150
- − Mortgage interest
- −$1,400
- − Property taxes
- −$926
- − Insurance
- −$125
- − Repairs & maintenance
- −$1,292
- − Management
- −$1,292
- − Depreciation
- −$727
- Taxable income
- $10,387
- Est. tax owed @ 24.0%
- −$2,493
- After-tax cash flow
- $7,641/yr
For passive investors: Depreciation is non-cash, so a rental often shows a tax loss while cash-flowing — sheltering income. Rental losses are passive: they offset passive income freely, and up to $25,000/yr can offset ordinary (W-2) income if you actively participate and your MAGI is under $100k (phasing out to $0 by $150k); unused losses carry forward. On sale, claimed depreciation is recaptured at up to 25%, and gains may owe capital-gains tax (a 1031 exchange can defer both). Figures are a year-1 estimate at your 24.0% rate — not tax advice; consult a CPA.
Schools (NCES district)
- District
- Fredericktown R-I
- NCES district ID
- 2912540
- Math proficiency
- 35% ▲ 2.00%
- Reading proficiency
- 45% ▼ -7.00%
- Median HH income
- $36,484
- Composite
- 33.16/100
- National rank
- #5550
- State rank
- #164 of 324 in MO
Livability — Fredericktown
- Score
- 60/100
- State rank
- #493
- US rank
- #19165
Category grades
Schools grade is shown separately in the Schools card above.
Census & demographics
- Census place
- Fredericktown, MO
- Population (ZIP)
- 11,514
Population outlook (Madison County) Hauer SSP2
- Today (2025)
- 12,728 people
- By 2030
- 12,838 · +0.9%
- By 2040
- 12,913 · +1.5%
- By 2050
- 12,744 · +0.1%
- By 2075
- 12,073 · -5.1%
- By 2100
- 10,940 · -14.0%
Race, ethnicity, and origin ACS 2023
- Neighborhood character
- Predominantly White (93%)
- Race & ethnicity
- White 93% Two or more races 4% Hispanic / Latino 3%
- Common ancestry
- Lithuanian 4% Italian 3% Slovak 1%
- Foreign-born
- 1% · Canada
- Languages at home
- 96% English-only · Spanish 2% German/W. Germanic 1%
Political lean MEDSL · Madison
- 2024 margin
- Solid R (+64.9) · D 17.1% · R 82.1%
- 2008→2024 swing
- -47.9pp toward R · 2008: -17.0pp · 2024: -64.9pp
- All cycles
- 2024: R+64.9 2020: R+62.8 2016: R+58.2 2012: R+33.2 2008: R+17.0
Not yet ingested
- Civics
- —
Market trends
- HPI YoY
- ▼ -16.52%
- Current HPI
- 188.2207
- Rent YoY
- —
- Metro
- —
- State GDP YoY
- ▲ 1.84%
- F500 in state
- 20
Industry mix (Fortune 500 HQ in MO)
| Industry | F500 HQs | Revenue |
|---|---|---|
| Healthcare | 1 | $163B |
|
||
| Insurance | 1 | $21B |
|
||
| Industrial Technology | 1 | $17B |
|
||
| Retail | 1 | $16B |
|
||
| Industrial Distribution | 1 | $10B |
|
||
| Utilities | 1 | $9B |
|
||
Price history
1 event — show timeline
- 2026-06-02 Listed $25,000 MARIS as Distributed by MLS Grid
Property tax history
+1.3%/yrLatest (2025): $926 · -0.7% YoY. Source: county tax records.
Cash-flow waterfall
monthlySold comps — $/sqft
last 12 mo · ≤1 miLoading sold comps…