 Duplex
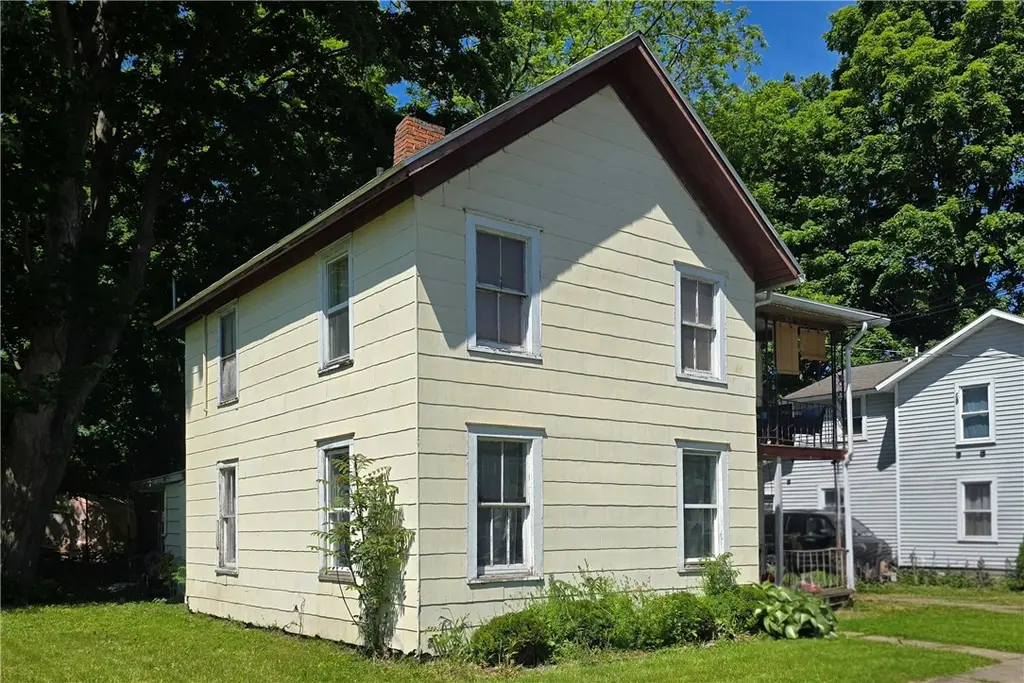
616 Lewis St · Elmira, NY
Flood risk 7/10 · Major
- FEMA flood zone
- X
- Chance of flooding over 30 yrs
- 0.78%
- Est. flood insurance / yr
- $473 – $860
Fire risk 2/10 · Minimal
- Est. fire insurance / yr
- $691 – $1,283
Heat risk 3/10 · Minor
- Hot days now (above 96°F)
- 7 days/yr
- Hot days in 30 yrs
- 16 days/yr
Wind risk 2/10 · Minimal
- Chance of severe wind over 30 yrs
- 1.0%
Air-quality risk 1/10 · Minimal
- Unhealthy air days now
- 0 days/yr
- Unhealthy air days in 30 yrs
- 0 days/yr
Risk factors via First Street. Map © Google.
Why this score? — see what drove the B grade
The composite is a weighted blend of 9 inputs, each scored 0–100. Each bar is that input's sub-score; the figure is the points it added to the 100-point composite (weight × sub-score).
- Cash flow +30.0/30.0
- ARV discount +10.2/15.0
- 1% rule +10.0/10.0
- DSCR +10.0/10.0
- Livability +3.1/5.0
- Rent growth +2.5/5.0
- Condition / age +2.5/5.0
- Schools +2.4/10.0
- Appreciation +0.0/10.0
$75,000
🖨 Deal sheet 📄 Offer letter ✓ Due diligence
Multi-family units
County records classify this as Multi-Family (2-4 Unit). Listing-text estimate: 2 units. confirmed
Listing remarks MLS
2 Unit (up and down) in reasonable condition-looking for investor! Priced to sell fast! As is! Hurry on this one. Exterior is made of asbestos tiles.
Key facts
- Two separate units
- Covered porch area
- On-site laundry
Tags
Property features AI
Finance
- Other: Operating expense details: see remarks
- Financial info: Property contains 2 units; Each unit has separate gas and electric meters; Owner pays all utilities; Rent: Unit 1 currently $890 (month-to-month); Unit 2 currently $1,200 (leased through July 31, 2026)
Exterior
- Parking: One assigned on-street parking space
- Utilities: Public water connected; Sewer connected
- Home design: Two-story multi-family building; Resale property
- Construction: Composite siding; Existing construction
- Exterior features: Rectangular residential lot; City street frontage; Lot dimensions approximately 45 x 100
Interior
- Kitchen: Unit 1: Dining area with kitchen; Unit 2: Eat-in kitchen
- Bedrooms: One 1-bedroom unit; One 2-bedroom unit
- Bathrooms: Two full bathrooms total (each unit has 1 full bath)
- Heating & cooling: Electric baseboard heating
- Interior features: Full basement
- Laundry & utility: Electric water heater
Neighborhood map
What this means for you Summary
Snapshot
- This is a 2 × 3-bed/1.5-bath units multifamily listed at $75k.
Deal economics
- At list price, monthly cash flow is $1k ($12k/yr) — positive. Per door: $520/mo.
- The deal already cash-flows at list — no discount required.
- Meets the 1% rule at list price ($2k rent vs $75k).
- Cap rate 23.8% vs local median 10.1% in Elmira — top-decile yield for the area; either an underpriced asset or a hidden risk that comps aren't pricing in. Stress-test before assuming the spread holds.
Location & tenants
- Location reads 62/100 on livability (#832 in NY) — a middle-class / working-renter tenant base. Strengths: cost of living A+, housing A+, health & safety A+; Watch: schools F, crime F, amenities F.
- Elmira City School District (urban): math 23% / reading 35% proficiency, ranked #580 of 590 in NY (top 98%) — low school quality limits family demand, transient renter base, plan for 1-2y turnover.
- Market conditions: 101 active listings in the ZIP; 10 comparable units currently listed for rent nearby; rentals lingering (median 44d on market — plan ~5-8 weeks vacancy on turnover, expect pricing pressure); 100% of comp listings sitting > 30 days — soft ceiling on asking rent; 91 units permitted in Chemung County in 2024 (63 in 5+ unit buildings).
Forward outlook
- Local home prices are declining (-3.0%/yr); year-one equity from $519 of loan paydown is wiped out by about $2k of value loss. Plan a longer hold.
- Chemung County population projected at -17% by 2050 — secular population decline; favor cash flow + early exit over multi-decade hold.
- At projected returns (-3.0% appreciation + 3.0% rent growth), your $21k cash investment doubles in ~2 years — after that, you're playing with house money.
Negotiation context
- Only 6 days on market — expect competitive offers; lowballing is unlikely to land.
- 3 sale attempts since 21y ago with the ask held roughly flat each time — persistent listings suggest the price (not the market) is what's stuck; bring a comps-based counter.
- Current owner paid $60k; 25% above their basis — modest negotiation headroom, anchor on the comps not their cost.
Risks & watch-outs
- Watch-outs: property tax is 3.5% of price; flood insurance adds $56/mo; built in 1900 — expect roof / HVAC / electrical / plumbing capex.
- Climate carrying-cost: major flood risk — expect insurance premiums to compound above CPI over the hold.
Questions for the listing agent
- Can we see the unit-by-unit rent roll, current vacancy, and any below-market leases? What's the average tenancy length?
- What capital expenditures (roof, boiler, parking lot, exteriors) have been made in the last 5 years, and what's planned in the next 2?
- Built in 1900 — when were the roof, HVAC, electrical panel, plumbing, and water heater last replaced?
- Property tax is high relative to price — has the assessment been appealed recently, and will the sale trigger a re-assessment?
- What's the actual annual flood-insurance premium (NFIP or private), and is the property in a SFHA with mandatory coverage?
- Is there a deadline driving the sale (1031 exchange, divorce, estate, relocation)? That informs how much negotiation room exists.
- Schools are F-rated, which usually means shorter tenancies and higher turnover. Who's the typical renter profile here, and what's been the actual vacancy rate?
- Crime grade is F in this area — have there been break-ins, vandalism, or insurance claims at this property in the last 3 years? What carrier currently insures it and at what premium?
- What's the average days-on-market for RENTAL listings here right now (not sales)? A rising rental-DOM trend means longer vacancies and softer asking-rent achievability than the comps imply.
- What's the recent tenant-quality profile in this submarket — average credit score on applications, eviction rate, late-payment / NSF rate, and stable-employment percentage? A property-management company in the area should have these aggregated.
- How much new apartment / multifamily construction is in the pipeline within 1–3 miles? Heavy new supply (>2% of stock underway) typically softens rents 12–24 months out; light construction supports rent growth.
Investment metrics
- 1% rule
- 2.93% ✓
- Cap rate
- 23.82%
- Cash-on-cash
- 62.60%
- DSCR
- 3.79
- GRM
- 2.8
CMA / ARV
- ARV (on-the-fly)
- $79,704
- Comps found
- 5
Show comp detail 5 sales within ~0.75 mi
| Address | Dist | Beds/Ba | Sqft | Sold | Price | $/sf | Match |
|---|---|---|---|---|---|---|---|
| 458 Beecher St | 0.27mi | 4/2.0 (+1) | 1,546 (+5%) | 16mo | $94,000 | $61 | 61 |
| 230 Allen St | 0.47mi | 4/2.0 (+1) | 1,560 (+6%) | 9mo | $85,000 | $54 | 56 |
| 264 Allen St | 0.63mi | 4/2.0 (+1) | 1,560 (+6%) | 16mo | $80,000 | $51 | 42 |
| 463 Frank St | 0.46mi | 4/2.0 (+1) | 1,664 (+13%) | 20mo | $118,000 | $71 | 36 |
| 455 Frank St | 0.46mi | 4/2.0 (+1) | 1,664 (+13%) | 21mo | $42,000 | $25 | 35 |
Match score weights: distance 35% · size 25% · config 20% · recency 20%. Top-matched comps best support the ARV.
Projected returns pro-forma
-3.0% appreciation · 3.0% rent growth · sell at horizon
- IRR
- 58.2%
- Equity multiple
- 3.58×
- Total profit
- $54,221
- Equity at exit
- $11,183
- IRR
- 63.0%
- Equity multiple
- 7.34×
- Total profit
- $133,082
- Equity at exit
- $6,485
Cash invested: $21,000 (down + closing). Projections, not guarantees.
Landlord ↔ Tenant lean methodology
- Overall (STATE)
- 15 Strongly Tenant-Friendly
- State New York
- 15 Strongly Tenant-Friendly · D+10
- County
- — inherits STATE
- City
- — inherits STATE
ZIP-level market 14904
- Home prices YoY
- -9.6%
- Active inventory
- 101
- Price-to-rent
- 5.7×
Monthly cashflow live
- Estimated rent
- $2,200 medium interval (Pro) →
- Mortgage (P&I)
- −$393
- Tax from tax record
- −$218 /mo · $2,616/yr
- Insurance
- −$31
- Flood insurance flood zone
- −$56 /mo · $666/yr
- HOA
- −$0
- Vacancy / Maint / Mgmt
- −$462
- Net cashflow
- $1,040
Break-even live
2-unit breakdown (identical units grouped — click to expand)
| Units | Beds | Baths | Est. rent |
|---|---|---|---|
| 2× units | 3 | 1.5 | $2,200 |
| #1 | 3 | 1.5 | $1,100 |
| #2 | 3 | 1.5 | $1,100 |
| Total (2 units) | $2,200 | ||
UW: 25.0% down · 7.5% · 30yr · 1.5% tax · 5.0% vac · 8.0% maint · 8.0% mgmt
Financing live
Cash to close
- Down payment
- $18,750
- Closing costs
- $2,250
- Reserves months
- —
- Total cash needed
- —
Loan-product check · same deal, 3 products live
Conventional
25% down · 7.5% · 30yr
- Down + closing
- —
- Monthly P&I
- —
- Monthly cashflow
- —
- DSCR
- —
- Eligible?
- —
Personal DTI + credit; lowest rate.
DSCR
20% down · 8.5% · 30yr
- Down + closing
- —
- Monthly P&I
- —
- Monthly cashflow
- —
- DSCR
- —
- Eligible?
- —
No personal income docs; deal must DSCR.
Hard money
10% down · 12.0% · 12mo
- Down + closing
- —
- Monthly P&I
- —
- Monthly cashflow
- —
- DSCR
- —
- Eligible?
- —
Short-term bridge; refi at stabilization.
Rent comps 10 comps
| Address | Beds | Baths | Sqft | Rent | $/sqft | DOM | Units | Dist |
|---|---|---|---|---|---|---|---|---|
| 419 Jefferson St Unit A Elmira, NY | 2.0 | 2.0 | 1100 | $1,995 | $1.81 | 43d | 1 | 0.36mi |
| 160 Boardman St Unit B Elmira, NY | 2.0 | 1.0 | 1727 | $800 | $0.46 | 43d | 1 | 0.46mi |
| 550 Spruce St Unit 303 Elmira, NY | 2.0 | 2.0 | 1350 | $1,350 | $1.00 | 43d | 1 | 0.83mi |
| 363 W Water St #2 Elmira, NY | 3.0 | 1.0 | 1084 | $1,250 | $1.15 | 43d | 1 | 0.95mi |
| 1254 Charles St Elmira, NY | 2.0 | 1.0 | 1560 | $1,350 | $0.87 | 43d | 1 | 1.14mi |
| 514 W 1st St Unit A Elmira, NY | 4.0 | 1.0 | 1416 | $1,275 | $0.90 | 43d | 1 | 1.23mi |
| 106 W 2nd St Unit A Elmira, NY | 3.0 | 1.0 | 1395 | $1,400 | $1.00 | 43d | 1 | 1.26mi |
| 454 W 2nd St Unit 1 Elmira, NY | 2.0 | 1.0 | 1400 | $1,000 | $0.71 | 43d | 1 | 1.26mi |
| 355 W Clinton St Unit 1 Elmira, NY | 3.0 | 1.5 | 1650 | $1,400 | $0.85 | 43d | 1 | 1.38mi |
| 357 W Clinton St Unit 1 Elmira, NY | 2.0 | 1.5 | 1650 | $1,500 | $0.91 | 43d | 1 | 1.38mi |
Listing history 7 events
-
2026-06-19days on market $75,000 Active 6 DOM
-
2026-06-18days on market $75,000 Active 5 DOM
-
2026-06-17days on market $75,000 Active 4 DOM
-
2026-06-16days on market $75,000 Active 3 DOM
-
2026-06-15days on market $75,000 Active 2 DOM
-
2026-06-14remarks 628-char remark
-
2026-06-14$75,000 Active 1 DOM
ⓘ Source: listings_history table (triggers on properties + properties_extension) + one-shot
backfill from property_details.listing_events for pre-trigger history.
Tax reassessment forecast NY · Partial reset (capped growth)
- Current annual tax
- $2,616 · $218/mo
- Projected year-2 tax
- $2,616 · $218/mo
- Expected delta
- $0/yr ($0/mo · 0.0%)
ⓘ Screening estimate from a state-policy table — verify with the county assessor before closing.
Climate risk First Street
- Flood 7/10 Severe FEMA zone X · 78% chance over 30 yrs
- Wildfire 2/10 Low
- Heat 3/10 Moderate 7 d/yr ≥96°F today · 16 d/yr by 30 yrs out
- Wind 2/10 Low 100% chance of damaging wind over 30 yrs
- Air quality 1/10 Low 0 unhealthy d/yr today · 0 by 30 yrs out
Nearby sold comps map
Loading sold comps map…
Walkable amenities ~0.75 mi
Loading nearby amenities…
Taxation est. · year 1
- Rental income
- $26,400
- − Mortgage interest
- −$4,201
- − Property taxes
- −$2,616
- − Insurance
- −$1,042
- − Repairs & maintenance
- −$2,112
- − Management
- −$2,112
- − Depreciation
- −$2,182
- Taxable income
- $12,135
- Est. tax owed @ 24.0%
- −$2,912
- After-tax cash flow
- $9,566/yr
For passive investors: Depreciation is non-cash, so a rental often shows a tax loss while cash-flowing — sheltering income. Rental losses are passive: they offset passive income freely, and up to $25,000/yr can offset ordinary (W-2) income if you actively participate and your MAGI is under $100k (phasing out to $0 by $150k); unused losses carry forward. On sale, claimed depreciation is recaptured at up to 25%, and gains may owe capital-gains tax (a 1031 exchange can defer both). Figures are a year-1 estimate at your 24.0% rate — not tax advice; consult a CPA.
Schools (NCES district)
- District
- Elmira City School District
- NCES district ID
- 3610560
- Math proficiency
- 23% ▼ -7.00%
- Reading proficiency
- 35% ▲ 7.00%
- Median HH income
- $40,180
- Composite
- 24.39/100
- National rank
- #7688
- State rank
- #580 of 590 in NY
Livability — Elmira
- Score
- 62/100
- State rank
- #832
- US rank
- #16139
Category grades
Schools grade is shown separately in the Schools card above.
Census & demographics
- Census place
- Elmira, NY
- City population
- 14,276
- Population (ZIP)
- 14,276
Population outlook (Chemung County) Hauer SSP2
- Today (2025)
- 82,931 people
- By 2030
- 80,356 · -3.1%
- By 2040
- 74,745 · -9.9%
- By 2050
- 69,012 · -16.8%
- By 2075
- 55,689 · -32.8%
- By 2100
- 41,428 · -50.0%
Race, ethnicity, and origin ACS 2023
- Neighborhood character
- Predominantly White (83%)
- Race & ethnicity
- White 83% Two or more races 7% Black 7% Hispanic / Latino 5% Native American 1%
- Common ancestry
- Romanian 7% Lithuanian 3% Slovak 2%
- Foreign-born
- 2% · Canada, Jamaica, Dominican Republic
- Languages at home
- 97% English-only · Spanish 2%
Political lean MEDSL · Chemung
- 2024 margin
- R (+16.8) · D 41.6% · R 58.4%
- 2008→2024 swing
- -15.6pp toward R · 2008: -1.2pp · 2024: -16.8pp
- All cycles
- 2024: R+16.8 2020: R+13.4 2016: R+20.0 2012: R+2.9 2008: R+1.2
Not yet ingested
- Civics
- —
Market trends
- HPI YoY
- ▼ -23.33%
- Current HPI
- 220.688
- Rent YoY
- —
- Metro
- —
- State GDP YoY
- ▲ 2.60%
- F500 in state
- 92
Industry mix (Fortune 500 HQ in NY)
| Industry | F500 HQs | Revenue |
|---|---|---|
| Financial Services | 10 | $950B |
|
||
| Consumer Goods | 9 | $162B |
|
||
| Insurance | 4 | $225B |
|
||
| Telecommunications | 2 | $144B |
|
||
| Pharmaceuticals | 2 | $112B |
|
||
| Media / Entertainment | 2 | $69B |
|
||
Price history
+172.7% since first listed7 events — show timeline
- 2026-06-14 Listed $75,000 UNYREIS
- 2023-01-05 Sold (Public Records) $60,000 Public Records
- 2018-05-02 Sold (Public Records) $10,000 Public Records
- 2012-02-10 Sold (MLS) $8,000 UNYREIS
- 2012-01-05 Listed $10,000 UNYREIS
- 2008-06-08 Listing Removed — UNYREIS
- 2005-10-03 Listed $27,500 UNYREIS
Property tax history
+8.1%/yrLatest (2025): $2,616 · -9.9% YoY. Source: county tax records.
Cash-flow waterfall
monthlySold comps — $/sqft
last 12 mo · ≤1 miLoading sold comps…