206 Waleto St · Jeffersonville, KY
Flood risk 1/10 · Minimal
- FEMA flood zone
- X (unshaded)
- Chance of flooding over 30 yrs
- 0.0%
- Est. flood insurance / yr
- $473 – $860
Fire risk 7/10 · Major
- Est. fire insurance / yr
- $839 – $1,559
Heat risk 4/10 · Minor
- Hot days now (above 102°F)
- 7 days/yr
- Hot days in 30 yrs
- 19 days/yr
Wind risk 4/10 · Minor
- Chance of severe wind over 30 yrs
- 6.0%
Air-quality risk 1/10 · Minimal
- Unhealthy air days now
- 0 days/yr
- Unhealthy air days in 30 yrs
- 0 days/yr
Risk factors via First Street. Map © Google.
Why this score? — see what drove the A- grade
The composite is a weighted blend of 9 inputs, each scored 0–100. Each bar is that input's sub-score; the figure is the points it added to the 100-point composite (weight × sub-score).
- Cash flow +30.0/30.0
- ARV discount +15.0/15.0
- 1% rule +10.0/10.0
- DSCR +10.0/10.0
- Appreciation +8.3/10.0
- Livability +3.1/5.0
- Schools +2.8/10.0
- Rent growth +2.5/5.0
- Condition / age +2.5/5.0
$79,900
🖨 Deal sheet 📄 Offer letter ✓ Due diligence
Listing remarks
Priced to sell for the first time home owner just getting started or for all the Investors- don't wait, hurry and add this one to your Rental Portfolio. Beautiful level lot with storage building with lean to as well as extra storage in the back. The home has 2 bedrooms, 2 baths. With just a little TLC this would make a great investment for all. Estate sale, being sold as is.
Key facts
- Extra storage
- Storage building
- Level lot
Tags
Property features AI
Exterior
- Parking: Driveway parking
- Utilities: Public water; Septic tank; Electricity connected
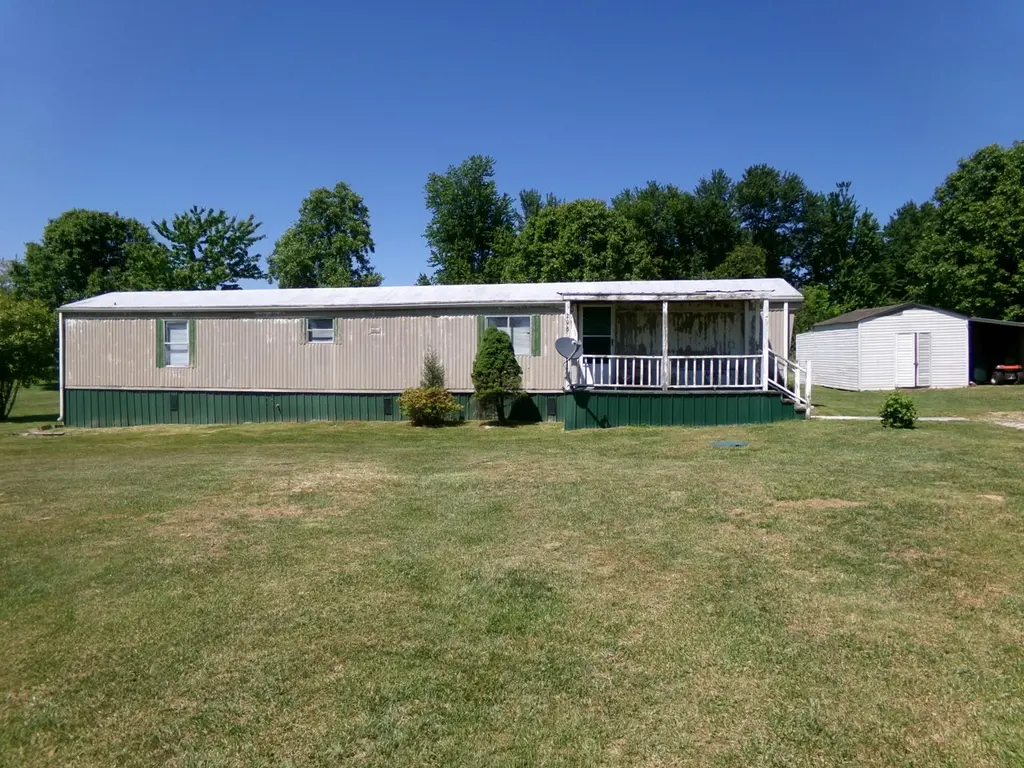
- Home design: Manufactured single-story home
- Construction: Aluminum siding; Metal roof; Pillar/post/pier foundation
- Exterior features: Yard includes shed(s)
Interior
- Flooring: Carpet; Laminate; Vinyl
- Bathrooms: 2 full bathrooms
- Heating & cooling: Electric heating
- Interior features: No built-in appliances included; 6 total rooms; No fireplace
- Laundry & utility: Washer hookup on main level; Electric dryer hookup
Neighborhood map
What this means for you Summary
Snapshot
- This is a 2-bed/2.0-bath manufactured listed at $80k.
Deal economics
- At list price, monthly cash flow is $553 ($7k/yr) — positive.
- The deal already cash-flows at list — no discount required.
- Meets the 1% rule at list price ($1k rent vs $80k).
- Recommended offer: $78k (3.0% below list) — sets the bar for market timing.
- Cap rate 14.6% vs local median 3.3% in Jeffersonville — top-decile yield for the area; either an underpriced asset or a hidden risk that comps aren't pricing in. Stress-test before assuming the spread holds.
Location & tenants
- Location reads 61/100 on livability (#382 in KY) — a middle-class / working-renter tenant base. Strengths: crime A+, cost of living A+, housing B; Watch: health & safety D+, amenities F, commute F.
- Montgomery County (rural): math 24% / reading 44% proficiency, ranked #76 of 165 in KY (top 46%) — families likely to look elsewhere, expect single-tenant / working-renter base with shorter leases.
- Zoned schools: Camargo Elementary School (math 19% / reading 40%, grade F, #393 of 676 statewide, top 63%, 576 students, 64% FRL); Mcnabb Middle School (math 19% / reading 47%, grade F, #112 of 217 statewide, top 53%, 1,018 students, 55% FRL); Montgomery County High School (math 29% / reading 39%, grade F, #89 of 254 statewide, top 36%, 1,279 students, 47% FRL) — zoned schools at 55% FRL track the district average.
- Market conditions: 43 active listings in the ZIP; 56 units permitted in Montgomery County in 2024 (0 in 5+ unit buildings).
Forward outlook
- In year one you build about $6k of equity ($552 loan paydown + $5k appreciation (6.7% local appreciation)).
- Montgomery County population projected at +11% by 2050 — modest demand growth; plan on rents tracking national, not racing it.
- At projected returns (6.7% appreciation + 3.0% rent growth), your $22k cash investment doubles in ~2 years — after that, you're playing with house money.
- By year 6, paydown + projected appreciation supports a ~$33k cash-out refi (75% LTV) — recoverable capital for the next deal without selling this one.
Negotiation context
- It's been on market 45 days — a 3% lower offer ($78k) is reasonable based on typical stale-listing flexibility.
- Current owner paid $38k; list at $80k implies a 108% gain — meaningful room to come down on a strong offer.
Risks & watch-outs
- Climate carrying-cost: major wildfire risk — expect insurance premiums to compound above CPI over the hold.
Questions for the listing agent
- It's been on market 45 days. Have you received any prior offers? Is the seller open to a 3% concession, seller financing, or rate buy-down credit?
- Is there a deadline driving the sale (1031 exchange, divorce, estate, relocation)? That informs how much negotiation room exists.
- Schools are F-rated, which usually means shorter tenancies and higher turnover. Who's the typical renter profile here, and what's been the actual vacancy rate?
- What's the average days-on-market for RENTAL listings here right now (not sales)? A rising rental-DOM trend means longer vacancies and softer asking-rent achievability than the comps imply.
- What's the recent tenant-quality profile in this submarket — average credit score on applications, eviction rate, late-payment / NSF rate, and stable-employment percentage? A property-management company in the area should have these aggregated.
- How much new for-sale + rental construction is in the pipeline within 1–3 miles? Heavy new supply typically softens prices + rents 12–24 months out; constrained supply supports both.
Investment metrics
- 1% rule
- 1.64% ✓
- Cap rate
- 14.60%
- Cash-on-cash
- 29.67%
- DSCR
- 2.32
- GRM
- 5.1
CMA / ARV
- ARV (median comp)
- $158,274
- List price
- $79,900
- Delta
- -49.52%
- Verdict
- UNDERPRICED
- Comps
- 4 within 1.0 mi
Projected returns pro-forma
6.7% appreciation · 3.0% rent growth · sell at horizon
- IRR
- 41.7%
- Equity multiple
- 3.75×
- Total profit
- $61,625
- Equity at exit
- $53,786
- IRR
- 38.2%
- Equity multiple
- 7.83×
- Total profit
- $152,889
- Equity at exit
- $100,766
Cash invested: $22,372 (down + closing). Projections, not guarantees.
Landlord ↔ Tenant lean methodology
- Overall (STATE)
- 83 Strongly Landlord-Friendly
- State Kentucky
- 83 Strongly Landlord-Friendly · R+16
- County
- — inherits STATE
- City
- — inherits STATE
ZIP-level market 40337
- Home prices YoY
- 2.9%
- Active inventory
- 43
- Price-to-rent
- 5.1×
Monthly cashflow live
- Estimated rent
- $1,310 medium interval (Pro) →
- Mortgage (P&I)
- −$419
- Tax from tax record
- −$29 /mo · $348/yr
- Insurance
- −$33
- HOA
- −$0
- Vacancy / Maint / Mgmt
- −$275
- Net cashflow
- $553
Break-even live
UW: 25.0% down · 7.5% · 30yr · 1.5% tax · 5.0% vac · 8.0% maint · 8.0% mgmt
Financing live
Cash to close
- Down payment
- $19,975
- Closing costs
- $2,397
- Reserves months
- —
- Total cash needed
- —
Loan-product check · same deal, 3 products live
Conventional
25% down · 7.5% · 30yr
- Down + closing
- —
- Monthly P&I
- —
- Monthly cashflow
- —
- DSCR
- —
- Eligible?
- —
Personal DTI + credit; lowest rate.
DSCR
20% down · 8.5% · 30yr
- Down + closing
- —
- Monthly P&I
- —
- Monthly cashflow
- —
- DSCR
- —
- Eligible?
- —
No personal income docs; deal must DSCR.
Hard money
10% down · 12.0% · 12mo
- Down + closing
- —
- Monthly P&I
- —
- Monthly cashflow
- —
- DSCR
- —
- Eligible?
- —
Short-term bridge; refi at stabilization.
Listing history 18 events
-
2026-06-18days on market $79,900 Active 45 DOM
-
2026-06-17days on market $79,900 Active 44 DOM
-
2026-06-16days on market $79,900 Active 43 DOM
-
2026-06-15days on market $79,900 Active 42 DOM
-
2026-06-14days on market $79,900 Active 40 DOM
-
2026-06-13days on market $79,900 Active 39 DOM
-
2026-06-10days on market $79,900 Active 37 DOM
-
2026-06-09days on market $79,900 Active 36 DOM
-
2026-06-08days on market $79,900 Active 35 DOM
-
2026-06-07days on market $79,900 Active 34 DOM
-
2026-06-03days on market $79,900 Active 30 DOM
-
2026-06-02days on market $79,900 Active 29 DOM
-
2026-06-01days on market $79,900 Active 28 DOM
-
2026-05-31days on market $79,900 Active 27 DOM
-
2026-05-31days on market $79,900 Active 26 DOM
-
2026-05-12price $84,900 379-char remark
-
2026-05-04$94,500 Active 379-char remark
-
2007-05-24soldstatus $38,500
ⓘ Source: listings_history table (triggers on properties + properties_extension) + one-shot
backfill from property_details.listing_events for pre-trigger history.
Tax reassessment forecast KY · Resets to sale price
- Current annual tax
- $348 · $29/mo
- Projected year-2 tax
- $687 · $57/mo
- Expected delta
- +$339/yr (+$28/mo · 97.6%)
ⓘ Screening estimate from a state-policy table — verify with the county assessor before closing.
Climate risk First Street
- Flood 1/10 Low FEMA zone X (unshaded) · 0% chance over 30 yrs
- Wildfire 7/10 Severe
- Heat 4/10 Moderate 7 d/yr ≥102°F today · 19 d/yr by 30 yrs out
- Wind 4/10 Moderate 6% chance of damaging wind over 30 yrs
- Air quality 1/10 Low 0 unhealthy d/yr today · 0 by 30 yrs out
Nearby sold comps map
Loading sold comps map…
Walkable amenities ~0.75 mi
Loading nearby amenities…
Taxation est. · year 1
- Rental income
- $15,714
- − Mortgage interest
- −$4,476
- − Property taxes
- −$348
- − Insurance
- −$400
- − Repairs & maintenance
- −$1,257
- − Management
- −$1,257
- − Depreciation
- −$2,324
- Taxable income
- $5,653
- Est. tax owed @ 24.0%
- −$1,357
- After-tax cash flow
- $5,282/yr
For passive investors: Depreciation is non-cash, so a rental often shows a tax loss while cash-flowing — sheltering income. Rental losses are passive: they offset passive income freely, and up to $25,000/yr can offset ordinary (W-2) income if you actively participate and your MAGI is under $100k (phasing out to $0 by $150k); unused losses carry forward. On sale, claimed depreciation is recaptured at up to 25%, and gains may owe capital-gains tax (a 1031 exchange can defer both). Figures are a year-1 estimate at your 24.0% rate — not tax advice; consult a CPA.
Schools (NCES district)
- District
- Montgomery County
- NCES district ID
- 2104250
- Math proficiency
- 24% ▼ -21.00%
- Reading proficiency
- 44% ▼ -14.00%
- Median HH income
- $38,262
- Composite
- 28.32/100
- National rank
- #6782
- State rank
- #76 of 165 in KY
Livability — Jeffersonville
- Score
- 61/100
- State rank
- #382
- US rank
- #18158
Category grades
Schools grade is shown separately in the Schools card above.
Census & demographics
- Population (ZIP)
- 5,461
Population outlook (Montgomery County) Hauer SSP2
- Today (2025)
- 29,814 people
- By 2030
- 30,705 · +3.0%
- By 2040
- 32,189 · +8.0%
- By 2050
- 33,131 · +11.1%
- By 2075
- 33,991 · +14.0%
- By 2100
- 32,097 · +7.7%
Race, ethnicity, and origin ACS 2023
- Neighborhood character
- Predominantly White (97%)
- Race & ethnicity
- White 97% Two or more races 2% Hispanic / Latino 1%
- Common ancestry
- Slovak 3% Lithuanian 2% Italian 1%
- Foreign-born
- 1%
- Languages at home
- 98% English-only · Spanish 1% German/W. Germanic 1%
Political lean MEDSL · Montgomery
- 2024 margin
- Solid R (+46.6) · D 26.0% · R 72.6% · Other 1.5%
- 2008→2024 swing
- -30.0pp toward R · 2008: -16.6pp · 2024: -46.6pp
- All cycles
- 2024: R+46.6 2020: R+41.8 2016: R+41.1 2012: R+26.3 2008: R+16.6
Not yet ingested
- Civics
- —
Market trends
- HPI YoY
- ▲ 6.70%
- Current HPI
- 241.3612
- Rent YoY
- —
- Metro
- —
- State GDP YoY
- ▲ 1.81%
- F500 in state
- 4
Industry mix (Fortune 500 HQ in KY)
| Industry | F500 HQs | Revenue |
|---|---|---|
| Healthcare | 1 | $118B |
|
||
| Food / Beverage | 1 | $7B |
|
||
Price history
+107.5% since first listed4 events — show timeline
- 2026-05-20 Price Changed $79,900 ImagineMLS
- 2026-05-12 Price Changed $84,900 ImagineMLS
- 2026-05-04 Listed $94,500 ImagineMLS
- 2007-05-24 Sold (Public Records) $38,500 Public Records
Cash-flow waterfall
monthlySold comps — $/sqft
last 12 mo · ≤1 miLoading sold comps…