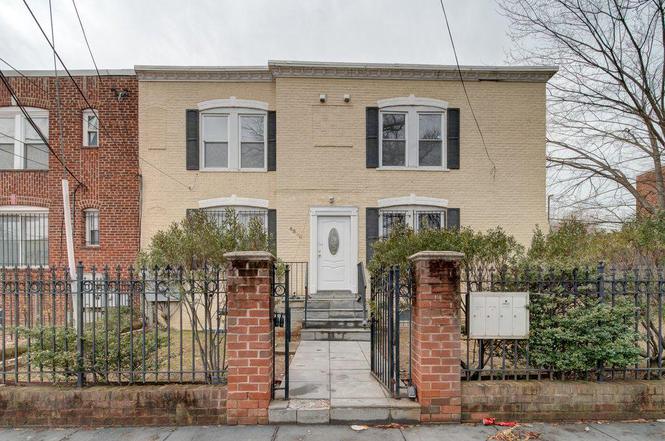
4325 Halley Ter SE #201 · Washington, DC
Flood risk 5/10 · Moderate
- FEMA flood zone
- X (unshaded)
- Chance of flooding over 30 yrs
- 0.66%
- Est. flood insurance / yr
- $507 – $1,088
Fire risk 3/10 · Minor
- Est. fire insurance / yr
- $631 – $1,173
Heat risk 8/10 · Major
- Hot days now (above 104°F)
- 7 days/yr
- Hot days in 30 yrs
- 16 days/yr
Wind risk 4/10 · Minor
- Chance of severe wind over 30 yrs
- 20.0%
Air-quality risk 3/10 · Minor
- Unhealthy air days now
- 2 days/yr
- Unhealthy air days in 30 yrs
- 3 days/yr
Risk factors via First Street. Map © Google.
Why this score? — see what drove the C grade
The composite is a weighted blend of 9 inputs, each scored 0–100. Each bar is that input's sub-score; the figure is the points it added to the 100-point composite (weight × sub-score).
- Cash flow +21.7/30.0
- 1% rule +10.0/10.0
- ARV discount +7.5/15.0
- DSCR +6.9/10.0
- Livability +3.7/5.0
- Schools +3.6/10.0
- Rent growth +3.5/5.0
- Condition / age +2.5/5.0
- Appreciation +0.0/10.0
$89,000
🖨 Deal sheet (PDF) 📄 Offer letter ✓ Due diligence
Listing remarks
Amazing opportunity! 1-bedroom, 1-bath condo located in the heart of Washington, DC, ready for your personal touch. Situated in the Congress Heights Condominium community, this property is perfect for first-time homebuyers or investors. Great location with convenient access to I-295 and just minutes from National Harbor and MGM. Enjoy nearby shopping, dining, and entertainment while still having easy access to major commuter routes. Whether you are looking for a starter home or an investment property, this unit offers great potential. Schedule your showing today — don’t miss this opportunity!
Key facts
- Nearby entertainment
- Nearby dining
- Nearby shopping
Tags
Property features AI
Finance
- Other: Ownership interest: Condominium; Finished above-grade area reported as 537 (source: Assessor); Year built source: Assessor
- HOA & community: Condo fee $333 monthly; Condo fee covers common area maintenance, exterior building maintenance, front/rear/side lawn care, snow removal, and management
Exterior
- Parking: On-street parking
- Utilities: Public water; Public sewer; Electric power
- Home design: Condominium unit (Unit/Flat); Garden-style building (1–4 floors); Entry on level 2; Below average property condition
- Construction: Brick construction
- Exterior features: Above grade and below grade structures noted; Property is within city limits
Interior
- Bedrooms: One bedroom on the main level
- Bathrooms: One full bathroom on the main level
- Heating & cooling: Electric heating; Electric cooling; Electric hot water
- Interior features: No basement; Living area source: Assessor
- Laundry & utility: Washer/dryer hookup in unit
Neighborhood map
What this means for you Summary
Snapshot
- This is a 1-bed/1.0-bath condo listed at $89k.
Deal economics
- At list price, monthly cash flow is $137 ($2k/yr) — positive.
- The deal already cash-flows at list — no discount required.
- Meets the 1% rule at list price ($1k rent vs $89k).
- Recommended offer: $81k (9.0% below list) — sets the bar for market timing.
- Cap rate 8.1% vs local median 2.5% in Washington — top-decile yield for the area; either an underpriced asset or a hidden risk that comps aren't pricing in. Stress-test before assuming the spread holds.
Location & tenants
- Location reads 73/100 on livability (#1 in DC) — a middle-class / working-renter tenant base. Strengths: amenities A+, commute A+, employment A+; Watch: crime F, cost of living F.
- District Of Columbia Public Schools (urban): math 33% / reading 40% proficiency, ranked #8 of 32 in DC (top 25%) — families likely to look elsewhere, expect single-tenant / working-renter base with shorter leases; 65% free/reduced lunch — lower-income household profile, screen leases tightly.
- Zoned schools: Patterson Es (273 students, 0% FRL); Hart Ms (386 students, 0% FRL); Ballou Hs (657 students, 0% FRL) — zoned schools average 0% FRL vs 65% district-wide (65 pts lower); this property's tenant base skews higher-income than the district average.
- Market conditions: Rents rising (+4.0%/yr); 146 active listings in the ZIP; 40 comparable units currently listed for rent nearby; rentals at typical pace (median 27d on market — plan ~3-4 weeks tenant-placement turnaround); 1,737 units permitted in District of Columbia in 2024 (1,506 in 5+ unit buildings).
- This rent runs 34% of the median local income ($49k/yr) — at the standard rent-burdened threshold; future hikes will face affordability resistance.
Forward outlook
- Local home prices are declining (-3.0%/yr); year-one equity from $615 of loan paydown is wiped out by about $3k of value loss. Plan a longer hold.
- District of Columbia County population projected at +50% by 2050 — long-run rental-demand tailwind backs the buy-and-hold thesis.
Negotiation context
- It's been on market 103 days — a 9% lower offer ($81k) is reasonable based on typical stale-listing flexibility.
- 6 sale attempts since 20y ago; this cycle's ask has dropped $44k (33%) from the opening price — seller is motivated, your offer sets the floor, not the list.
Risks & watch-outs
- Watch-outs: HOA is 24% of rent; built in 1942 — expect roof / HVAC / electrical / plumbing capex.
- Climate carrying-cost: moderate flood risk; extreme-heat days projected 7→16/yr by 2055 (HVAC capex compounding) — expect insurance premiums to compound above CPI over the hold.
Questions for the listing agent
- It's been on market 103 days. Have you received any prior offers? Is the seller open to a 9% concession, seller financing, or rate buy-down credit?
- Built in 1942 — when were the roof, HVAC, electrical panel, plumbing, and water heater last replaced?
- What does the HOA fee cover, when was the last increase, and are there any pending special assessments or reserve-fund shortfalls?
- Any open or pending special assessments — roof, HVAC, plumbing, elevator, façade? What's the per-unit balance and payoff schedule, and is the seller paying it off at close or rolling it to the buyer?
- Why hasn't it sold? Are there any deal-killer items the seller is aware of (foundation, flood, title, zoning, code violations)?
- Is there a deadline driving the sale (1031 exchange, divorce, estate, relocation)? That informs how much negotiation room exists.
- Crime grade is F in this area — have there been break-ins, vandalism, or insurance claims at this property in the last 3 years? What carrier currently insures it and at what premium?
- What's the average days-on-market for RENTAL listings here right now (not sales)? A rising rental-DOM trend means longer vacancies and softer asking-rent achievability than the comps imply.
- What's the recent tenant-quality profile in this submarket — average credit score on applications, eviction rate, late-payment / NSF rate, and stable-employment percentage? A property-management company in the area should have these aggregated.
- How much new apartment / multifamily construction is in the pipeline within 1–3 miles? Heavy new supply (>2% of stock underway) typically softens rents 12–24 months out; light construction supports rent growth.
Investment metrics
- 1% rule
- 1.56% ✓
- Cap rate
- 8.14%
- Cash-on-cash
- 6.59%
- DSCR
- 1.29
- GRM
- 5.3
CMA / ARV
No comps found within radius.
Projected returns pro-forma
-3.0% appreciation · 3.96% rent growth · sell at horizon
- IRR
- -4.4%
- Equity multiple
- 0.83×
- Total profit
- $-4,126
- Equity at exit
- $13,270
- IRR
- 7.1%
- Equity multiple
- 1.57×
- Total profit
- $14,228
- Equity at exit
- $7,695
Cash invested: $24,920 (down + closing). Projections, not guarantees.
Landlord ↔ Tenant lean methodology
- Overall (CITY)
- 0 Strongly Tenant-Friendly
- State District of Columbia
- 12 Strongly Tenant-Friendly · D+43
- County
- — inherits STATE
- City Washington
- 0 Strongly Tenant-Friendly · D+43
ZIP-level market 20032
- Home prices YoY
- -15.6%
- Rents YoY
- 4.0%
- Active inventory
- 146
- Price-to-rent
- 5.3×
Monthly cashflow live
- Estimated rent
- $1,387 high interval (Pro) →
- Mortgage (P&I)
- −$467
- Tax from tax record
- −$122 /mo · $1,467/yr
- Insurance
- −$37
- HOA
- −$333
- Vacancy / Maint / Mgmt
- −$291
- Net cashflow
- $137
Break-even live
Sensitivity live
| Price | -10% $187 | -5% $162 | +0% $137 | +5% $112 | +10% $86 |
|---|---|---|---|---|---|
| Rent | -10% $27 | -5% $82 | +0% $137 | +5% $192 | +10% $246 |
| Rate | -1.0pp $182 | -0.5pp $159 | base $137 | +0.5pp $114 | +1.0pp $90 |
UW: 25.0% down · 7.5% · 30yr · 1.5% tax · 5.0% vac · 8.0% maint · 8.0% mgmt
Financing live
Cash to close
- Down payment
- $22,250
- Closing costs
- $2,670
- Reserves months
- —
- Total cash needed
- —
Loan-product check · same deal, 3 products live
Conventional
25% down · 7.5% · 30yr
- Down + closing
- —
- Monthly P&I
- —
- Monthly cashflow
- —
- DSCR
- —
- Eligible?
- —
Personal DTI + credit; lowest rate.
DSCR
20% down · 8.5% · 30yr
- Down + closing
- —
- Monthly P&I
- —
- Monthly cashflow
- —
- DSCR
- —
- Eligible?
- —
No personal income docs; deal must DSCR.
Hard money
10% down · 12.0% · 12mo
- Down + closing
- —
- Monthly P&I
- —
- Monthly cashflow
- —
- DSCR
- —
- Eligible?
- —
Short-term bridge; refi at stabilization.
Rent comps 40 comps
| Address | Beds | Baths | Sqft | Rent | $/sqft | DOM | Units | Dist |
|---|---|---|---|---|---|---|---|---|
| 2 Elmira St SE Washington, DC | 1.0 | 1.0 | 710 | $1,342 | $1.89 | 26d | 1 | 0.04mi |
| 21 Chesapeake St SE Washington, DC | 2.0 | 1.0 | 670 | $1,250 | $1.87 | 22d | 1 | 0.14mi |
| 61 Forrester St SW Unit 104 Washington, DC | 2.0 | 1.0 | 639 | $1,700 | $2.66 | 26d | 1 | 0.15mi |
| 19 Galveston Pl SW #202 Washington, DC | 1.0 | 1.0 | 700 | $1,400 | $2.00 | 26d | 1 | 0.19mi |
| 6 Galveston St SW #303 Washington, DC | 2.0 | 1.0 | 708 | $1,700 | $2.40 | 26d | 1 | 0.23mi |
| 57 Galveston St SW Washington, DC | 1.0–2.0 | 1.0 | 650 | $1,199 | $1.84 | 6d | 5 | 0.24mi |
| 4721 1st St SW #203 Washington, DC | 2.0 | 1.0 | 741 | $1,600 | $2.16 | 26d | 1 | 0.28mi |
| 4725 1st St SW #102 Washington, DC | 2.0 | 1.0 | 580 | $1,850 | $3.19 | 26d | 1 | 0.29mi |
| 4001 S Capitol St SW Washington, DC | 3.0 | 1.0–2.0 | 782 | $1,392 | $1.78 | 16d | 1 | 0.30mi |
| 141 Galveston Pl SW Washington, DC | 1.0 | 1.0 | 650 | $1,100 | $1.69 | 26d | 1 | 0.30mi |
| 118 Galveston St SW Washington, DC | 1.0–3.0 | 1.0–2.0 | 951 | $1,249 | $1.31 | 1d | 11 | 0.31mi |
| 4729 1st St SW #202 Washington, DC | 2.0 | 1.0 | 589 | $1,650 | $2.80 | 26d | 1 | 0.32mi |
| 205 Elmira St SW Washington, DC | 1.0–2.0 | 1.0 | 705 | $1,235 | $1.75 | 26d | 5 | 0.34mi |
| 4660 Martin Luther King Jr Ave SW Washington, DC | 1.0–2.0 | 1.0–2.0 | 827 | $1,399 | $1.69 | 5d | 11 | 0.36mi |
| 4632 Livingston Rd SE Washington, DC | 1.0–2.0 | 1.0 | 755 | $1,199 | $1.59 | 1d | 9 | 0.41mi |
| 3865 Halley Ter SE Washington, DC | 1.0 | 1.0 | 650 | $1,210 | $1.86 | 26d | 1 | 0.41mi |
| 310 Atlantic St SE Washington, DC | 1.0–2.0 | 1.0 | 754 | $1,300 | $1.72 | 6d | 2 | 0.42mi |
| 4641 6th St SE Washington, DC | 1.0 | 1.0 | 650 | $1,275 | $1.96 | 26d | 1 | 0.49mi |
| 207 Mississippi Ave SE Washington, DC | 1.0–2.0 | 1.0–1.5 | 656 | $1,299 | $1.98 | 26d | 10 | 0.61mi |
| 701 Brandywine St SE #201 Washington, DC | 2.0 | 1.0 | 706 | $1,400 | $1.98 | 20d | 1 | 0.62mi |
| 705 Brandywine St SE #303 Washington, DC | 2.0 | 1.0 | 655 | $1,550 | $2.37 | 6d | 1 | 0.63mi |
| 3730 Martin Luther King Jr Ave SE Washington, DC | 2.0 | 1.0 | 650 | $1,295 | $1.99 | 1d | 1 | 0.65mi |
| 713 Brandywine St SE Washington, DC | 2.0 | 1.0 | 707 | $1,650 | $2.33 | 26d | 1 | 0.65mi |
| 730 Brandywine St SE #104 Washington, DC | 2.0 | 1.0 | 683 | $1,350 | $1.98 | 26d | 1 | 0.70mi |
| 811 Barnaby St SE Washington, DC | 1.0 | 1.0 | 650 | $1,275 | $1.96 | 26d | 1 | 0.71mi |
| 811 Barnaby St SE Apt 101 Washington, DC | 2.0 | 1.0 | 750 | $1,449 | $1.93 | 26d | 1 | 0.71mi |
| 742 Brandywine St SE Washington, DC | 1.0 | 1.0 | 599 | $1,095 | $1.83 | 6d | 1 | 0.72mi |
| 820 Southern Ave SE Washington, DC | 2.0–3.0 | 1.0–1.5 | 840 | $1,450 | $1.73 | 0d | 63 | 0.74mi |
| 808 Chesapeake St SE Washington, DC | 2.0 | 1.0 | 700 | $1,700 | $2.43 | 26d | 1 | 0.75mi |
| 852 Barnaby St SE Washington, DC | 2.0–3.0 | 1.0–1.5 | 761 | $1,400 | $1.84 | 17d | 10 | 0.92mi |
| 3429 5th St SE #42 Washington, DC | 1.0 | 1.0 | 702 | $1,395 | $1.99 | 16d | 1 | 0.93mi |
| 3868 9th St SE Washington, DC | 2.0 | 1.0 | 740 | $1,450 | $1.96 | 26d | 1 | 0.96mi |
| 1002 Kennebec St Oxon Hill, MD | 1.0–2.0 | 1.0–1.5 | 871 | $1,395 | $1.60 | 0d | 12 | 0.98mi |
| 3320 6th St SE Washington, DC | 2.0 | 1.0 | 690 | $1,274 | $1.85 | 5d | 25 | 1.05mi |
| 1311 Southview Dr Oxon Hill, MD | 2.0 | 1.0 | 628 | $1,412 | $2.25 | 0d | 53 | 1.11mi |
| 327 Parkland Pl SE Washington, DC | 1.0 | 1.0 | 650 | $1,199 | $1.84 | 26d | 1 | 1.26mi |
| 447 Orange St SE #3 Washington, DC | 2.0 | 1.0 | 700 | $1,500 | $2.14 | 6d | 1 | 1.32mi |
| 562 Malcolm X Ave SE Unit 4 Washington, DC | 2.0 | 1.0 | 550 | $1,600 | $2.91 | 14d | 1 | 1.33mi |
| 3320 11th Pl SE Washington, DC | 1.0 | 1.0 | 750 | $1,198 | $1.60 | 26d | 1 | 1.34mi |
| 2942 2nd St SE Washington, DC | 1.0–2.0 | 1.0–2.0 | 762 | $1,299 | $1.70 | 1d | 10 | 1.37mi |
HOA detail condo
- Monthly dues
- $333 · $3,996/yr
- Assessments
- None detected in remarks — confirm with the listing agent.
Listing history 33 events
-
2026-06-21days on market $89,000 Active 103 DOM
-
2026-06-18days on market $89,000 Active 100 DOM
-
2026-06-17days on market $89,000 Active 99 DOM
-
2026-06-16days on market $89,000 Active 98 DOM
-
2026-06-15days on market $89,000 Active 97 DOM
-
2026-06-13days on market $89,000 Active 95 DOM
-
2026-06-09days on market $89,000 Active 91 DOM
-
2026-06-08days on market $89,000 Active 90 DOM
-
2026-06-07days on market $89,000 Active 89 DOM
-
2026-06-04days on market $89,000 Active 86 DOM
-
2026-06-03days on market $89,000 Active 85 DOM
-
2026-06-02days on market $89,000 Active 84 DOM
-
2026-06-02price $89,000 Active 83 DOM
-
2026-06-01days on market $119,000 Active 83 DOM
-
2026-05-31days on market $119,000 Active 82 DOM
-
2026-05-04price $119,000
-
2026-04-14price $124,500
-
2026-03-10$133,000 Active
-
2021-05-18historical
-
2021-05-18$146,000
-
2020-11-27historical
-
2020-10-19price $146,000
-
2020-08-23price $149,900
-
2020-08-14$155,000 Active
-
2012-12-28historical Withdrawn
-
2012-12-28historical
-
2012-10-23status Contract
-
2012-09-12Active
-
2012-09-12$45,000
-
2006-09-28soldstatus $146,500
-
2006-08-28soldstatus $146,500
-
2006-08-07historical
-
2006-05-21$145,000
ⓘ Source: listings_history table (triggers on properties + properties_extension) + one-shot
backfill from property_details.listing_events for pre-trigger history.
Tax reassessment forecast DC · Partial reset (capped growth)
- Current annual tax
- $1,467 · $122/mo
- Projected year-2 tax
- $1,467 · $122/mo
- Expected delta
- $0/yr ($0/mo · -0.0%)
ⓘ Screening estimate from a state-policy table — verify with the county assessor before closing.
Climate risk First Street
- Flood 5/10 Major FEMA zone X (unshaded) · 66% chance over 30 yrs
- Wildfire 3/10 Moderate
- Heat 8/10 Severe 7 d/yr ≥104°F today · 16 d/yr by 30 yrs out
- Wind 4/10 Moderate 20% chance of damaging wind over 30 yrs
- Air quality 3/10 Moderate 2 unhealthy d/yr today · 3 by 30 yrs out
Nearby sold comps map
Loading sold comps map…
Walkable amenities ~0.75 mi
Loading nearby amenities…
Taxation est. · year 1
- Rental income
- $16,646
- − Mortgage interest
- −$4,985
- − Property taxes
- −$1,467
- − Insurance
- −$445
- − Repairs & maintenance
- −$1,332
- − Management
- −$1,332
- − HOA
- −$3,996
- − Depreciation
- −$2,589
- Taxable income
- $500
- Est. tax owed @ 24.0%
- −$120
- After-tax cash flow
- $1,521/yr
For passive investors: Depreciation is non-cash, so a rental often shows a tax loss while cash-flowing — sheltering income. Rental losses are passive: they offset passive income freely, and up to $25,000/yr can offset ordinary (W-2) income if you actively participate and your MAGI is under $100k (phasing out to $0 by $150k); unused losses carry forward. On sale, claimed depreciation is recaptured at up to 25%, and gains may owe capital-gains tax (a 1031 exchange can defer both). Figures are a year-1 estimate at your 24.0% rate — not tax advice; consult a CPA.
Schools (NCES district)
- District
- District Of Columbia Public Schools
- NCES district ID
- 1100030
- Math proficiency
- 33% ▲ 3.00%
- Reading proficiency
- 40% ▲ 5.00%
- Median HH income
- $67,671
- Composite
- 35.84/100
- National rank
- #9606
- State rank
- #8 of 32 in DC
Livability — Washington
- Score
- 73/100
- State rank
- #1
- US rank
- #5327
Category grades
Schools grade is shown separately in the Schools card above.
Census & demographics
- Census place
- Washington, DC
- County
- District of Columbia · 671,873 people
- City population
- 671,873
- Metro
- Washington-Arlington-Alexandria, DC-VA-MD-WV
- Population (ZIP)
- 40,920
- Household income
- $49,139
- Rent vs Own
- Severe rent burden
- 4530.0
Population outlook (District of Columbia County) Hauer SSP2
- Today (2025)
- 821,926 people
- By 2030
- 899,517 · +9.4%
- By 2040
- 1,061,162 · +29.1%
- By 2050
- 1,231,493 · +49.8%
- By 2075
- 1,603,312 · +95.1%
- By 2100
- 1,847,141 · +124.7%
Race, ethnicity, and origin ACS 2023
- Neighborhood character
- Predominantly Black (80%)
- Race & ethnicity
- Black 80% White 8% Two or more races 7% Hispanic / Latino 5%
- Foreign-born
- 4% · Canada
- Languages at home
- 95% English-only · Spanish 3%
Political lean MEDSL · District of Columbia
- 2024 margin
- Solid D (+86.1) · D 91.2% · R 5.1% · Other 3.8%
- 2008→2024 swing
- +0.1pp no change · 2008: 85.9pp · 2024: 86.1pp
- All cycles
- 2024: D+86.1 2020: D+86.8 2016: D+88.7 2012: D+84.2 2008: D+85.9
Not yet ingested
- Civics
- —
Market trends
- HPI YoY
- ▼ -60.34%
- Current HPI
- 326.4077
- Rent YoY
- ▲ 3.96%
- Metro
- Washington-Arlington-Alexandria, DC-VA-MD-WV
- State GDP YoY
- ▲ 1.33%
- F500 in state
- 6
Industry mix (Fortune 500 HQ in DC)
| Industry | F500 HQs | Revenue |
|---|---|---|
| Financial Services | 1 | $153B |
|
||
| Life Sciences / Industrials | 1 | $25B |
|
||
| Industrial Machinery | 1 | $8B |
|
||
Price history
-17.9% since first listed18 events — show timeline
- 2026-05-04 Price Changed $119,000 BRIGHT MLS
- 2026-04-14 Price Changed $124,500 BRIGHT MLS
- 2026-03-10 Listed $133,000 BRIGHT MLS
- 2021-05-18 Listed $146,000 BRIGHT MLS
- 2021-05-18 Listing Removed — BRIGHT MLS
- 2020-11-27 Listing Removed — BRIGHT MLS
- 2020-10-19 Price Changed $146,000 BRIGHT MLS
- 2020-08-23 Price Changed $149,900 BRIGHT MLS
- 2020-08-14 Listed $155,000 BRIGHT MLS
- 2012-12-28 Delisted — MRIS
- 2012-12-28 Listing Removed — BRIGHT MLS
- 2012-10-23 Pending — MRIS
- 2012-09-12 Listed — MRIS
- 2012-09-12 Listed $45,000 BRIGHT MLS
- 2006-09-28 Sold (Public Records) $146,500 Public Records
- 2006-08-28 Sold (MLS) $146,500 MRIS
- 2006-08-07 Delisted — MRIS
- 2006-05-21 Listed $145,000 MRIS
Property tax history
+2.0%/yrLatest (2025): $1,467 · -5.2% YoY. Source: county tax records.
Cash-flow waterfall
monthlySold comps — $/sqft
last 12 mo · ≤1 miLoading sold comps…