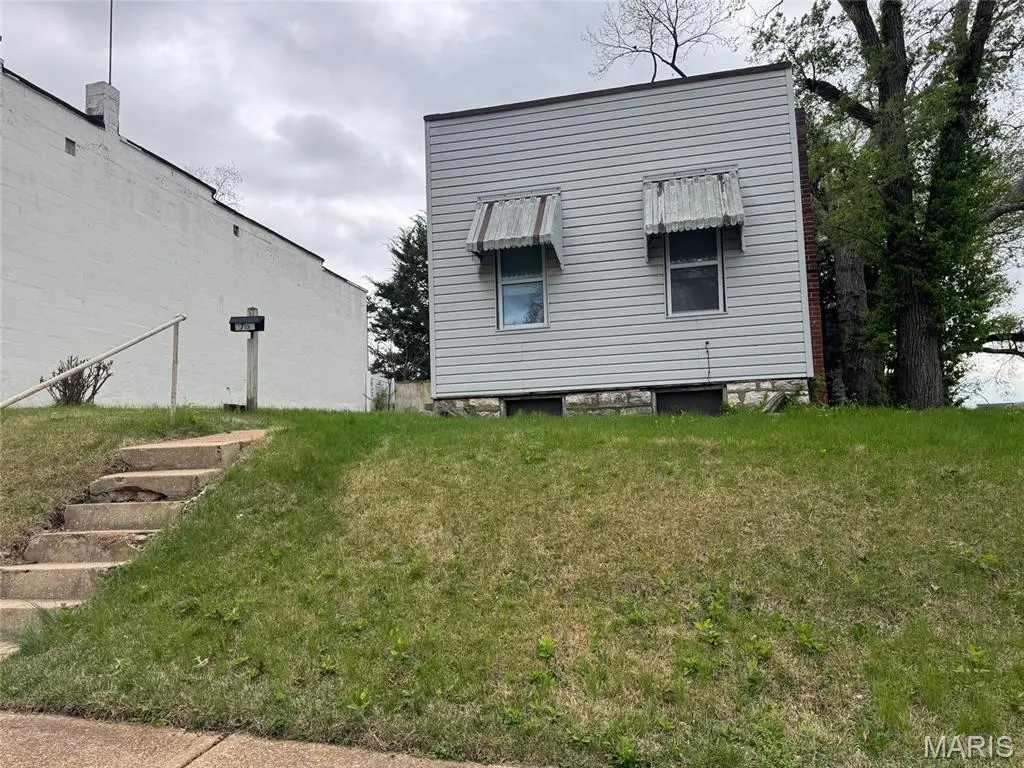
3762 French Ave · St. Louis, MO
Flood risk 1/10 · Minimal
- FEMA flood zone
- X (unshaded)
- Chance of flooding over 30 yrs
- 0.0%
- Est. flood insurance / yr
- $473 – $860
Fire risk 1/10 · Minimal
- Est. fire insurance / yr
- $1,054 – $1,958
Heat risk 5/10 · Moderate
- Hot days now (above 108°F)
- 7 days/yr
- Hot days in 30 yrs
- 21 days/yr
Wind risk 2/10 · Minimal
- Chance of severe wind over 30 yrs
- 1.0%
Air-quality risk 3/10 · Minor
- Unhealthy air days now
- 3 days/yr
- Unhealthy air days in 30 yrs
- 4 days/yr
Risk factors via First Street. Map © Google.
Why this score? — see what drove the C+ grade
The composite is a weighted blend of 9 inputs, each scored 0–100. Each bar is that input's sub-score; the figure is the points it added to the 100-point composite (weight × sub-score).
- Cash flow +25.6/30.0
- ARV discount +15.0/15.0
- DSCR +8.5/10.0
- 1% rule +6.3/10.0
- Rent growth +3.2/5.0
- Livability +2.5/5.0
- Condition / age +2.5/5.0
- Schools +1.2/10.0
- Appreciation +0.0/10.0
$129,900
🖨 Deal sheet (PDF) 📄 Offer letter ✓ Due diligence
Listing remarks MLS
Attention investors and buyers seeking a renovation opportunity! This spacious ranch-style home features high ceilings and generously sized rooms, all within a short walking distance of desirable Carondelet Park. Over the past 12 years, the current owner has made several key updates, including replacement of the furnace, roof, and select windows. The bathroom has been tastefully updated with tiled floors and walls, a whirlpool tub, and modern plumbing fixtures. While the property does require some additional work, it offers excellent potential for equity growth. Property is being sold as-is. Seller will not provide inspections, repairs, or warranties. Special Sale Contract only. Please do not allow cats to escape if present during showings. Showings begin Monday, 04/06/26. Kindly provide at least 3 hours’ advance notice for all showing requests.
Key facts
- 5,998 sq ft lot
- Built 1906
- Listed 71 days
Neighborhood map
What this means for you Summary
Snapshot
- This is a 3-bed/1.0-bath single-family listed at $130k.
Deal economics
- At list price, monthly cash flow is $306 ($4k/yr) — positive.
- The deal already cash-flows at list — no discount required.
- Meets the 1% rule at list price ($1k rent vs $130k).
- Recommended offer: $122k (6.0% below list) — sets the bar for market timing.
- Cap rate 9.1% vs local median 5.0% in St. Louis — top-decile yield for the area; either an underpriced asset or a hidden risk that comps aren't pricing in. Stress-test before assuming the spread holds.
Location & tenants
- Location reads: area grade C — affects rentability + tenant quality, not the cash-flow math above.
- St. Louis City (urban): math 10% / reading 18% proficiency, ranked #312 of 324 in MO (top 96%) — low school quality limits family demand, transient renter base, plan for 1-2y turnover; 80% free/reduced lunch — lower-income household profile, screen leases tightly.
- Zoned schools: Woerner Elem. (math 8% / reading 17%, grade F, #1,007 of 1,115 statewide, top 91%, 362 students, 99% FRL); Gateway Middle (math 0% / reading 8%, grade F, #389 of 391 statewide, top 100%, 506 students, 99% FRL); Roosevelt High (math 2% / reading 8%, grade F, #517 of 521 statewide, top 100%, 460 students, 99% FRL) — zoned schools average 99% FRL vs 80% district-wide (19 pts higher); higher-poverty schools than district average — tighter screening recommended.
- Market conditions: Rents rising (+2.6%/yr); 261 active listings in the ZIP; 40 comparable units currently listed for rent nearby; rentals at typical pace (median 20d on market — plan ~3-4 weeks tenant-placement turnaround); 294 units permitted in St. Louis city in 2024 (227 in 5+ unit buildings).
Forward outlook
- Local home prices are declining (-3.0%/yr); year-one equity from $898 of loan paydown is wiped out by about $4k of value loss. Plan a longer hold.
- St. Louis County population projected to shrink 6% by 2050 — rents likely to lag national; underwrite the cash flow, not the appreciation.
Negotiation context
- It's been on market 71 days — a 6% lower offer ($122k) is reasonable based on typical stale-listing flexibility.
- 2 sale attempts since 14y ago; this cycle's ask has dropped $20k (13%) from the opening price — seller is motivated, your offer sets the floor, not the list.
Risks & watch-outs
- Watch-outs: built in 1906 — expect roof / HVAC / electrical / plumbing capex.
- Climate carrying-cost: extreme-heat days projected 7→21/yr by 2055 (HVAC capex compounding) — expect insurance premiums to compound above CPI over the hold.
Questions for the listing agent
- It's been on market 71 days. Have you received any prior offers? Is the seller open to a 6% concession, seller financing, or rate buy-down credit?
- Built in 1906 — when were the roof, HVAC, electrical panel, plumbing, and water heater last replaced?
- Why hasn't it sold? Are there any deal-killer items the seller is aware of (foundation, flood, title, zoning, code violations)?
- Is there a deadline driving the sale (1031 exchange, divorce, estate, relocation)? That informs how much negotiation room exists.
- What's the average days-on-market for RENTAL listings here right now (not sales)? A rising rental-DOM trend means longer vacancies and softer asking-rent achievability than the comps imply.
- What's the recent tenant-quality profile in this submarket — average credit score on applications, eviction rate, late-payment / NSF rate, and stable-employment percentage? A property-management company in the area should have these aggregated.
- How much new for-sale + rental construction is in the pipeline within 1–3 miles? Heavy new supply typically softens prices + rents 12–24 months out; constrained supply supports both.
Investment metrics
- 1% rule
- 1.13% ✓
- Cap rate
- 9.12%
- Cash-on-cash
- 10.10%
- DSCR
- 1.45
- GRM
- 7.4
CMA / ARV
- ARV (median comp)
- $211,635
- List price
- $129,900
- Delta
- -38.62%
- Verdict
- UNDERPRICED
- Comps
- 20 within 1.0 mi
Show comp detail 12 sales within ~0.75 mi
| Address | Dist | Beds/Ba | Sqft | Sold | Price | $/sf | Match |
|---|---|---|---|---|---|---|---|
| 7005 Trainor Ct | 0.16mi | 3/2.0 | 1,256 (-3%) | 4mo | $250,000 | $199 | 80 |
| 4050 Quincy St | 0.39mi | 3/2.0 | 1,312 (+1%) | 2mo | $334,900 | $255 | 74 |
| 4033 Blow St | 0.37mi | 3/1.0 | 1,224 (-6%) | 4mo | $275,000 | $225 | 70 |
| 7313 Yates St | 0.46mi | 3/2.0 | 1,240 (-5%) | 2mo | $255,000 | $206 | 66 |
| 3832 Louis St | 0.34mi | 3/1.0 | 1,434 (+10%) | 3mo | $249,900 | $174 | 64 |
| 7413 Ray Ave | 0.65mi | 3/2.0 | 1,317 (+1%) | 1mo | $219,000 | $166 | 63 |
| 3633 Fillmore St | 0.67mi | 3/1.0 | 1,196 (-8%) | 2mo | $135,000 | $113 | 54 |
| 8111 Southpark Ct | 0.72mi | 3/2.0 | 1,400 (+8%) | 1mo | $174,900 | $125 | 49 |
| 6610 Alabama Ave | 0.70mi | 2/1.0 (-1) | 1,172 (-10%) | 3mo | $145,000 | $124 | 43 |
| 6156 Louisiana Ave | 0.67mi | 2/1.5 (-1) | 1,455 (+12%) | 1mo | $200,000 | $137 | 41 |
| 6011 S Grand Blvd | 0.71mi | 2/1.5 (-1) | 1,125 (-14%) | 0mo | $215,000 | $191 | 37 |
| 6021 Leona St | 0.72mi | 4/2.0 (+1) | 1,464 (+13%) | 3mo | $295,000 | $202 | 34 |
Match score weights: distance 35% · size 25% · config 20% · recency 20%. Top-matched comps best support the ARV.
Projected returns pro-forma
-3.0% appreciation · 2.62% rent growth · sell at horizon
- IRR
- -1.5%
- Equity multiple
- 0.94×
- Total profit
- $-2,117
- Equity at exit
- $19,369
- IRR
- 7.7%
- Equity multiple
- 1.58×
- Total profit
- $20,966
- Equity at exit
- $11,231
Cash invested: $36,372 (down + closing). Projections, not guarantees.
Landlord ↔ Tenant lean methodology
- Overall (STATE)
- 81 Strongly Landlord-Friendly
- State Missouri
- 81 Strongly Landlord-Friendly · R+10
- County
- — inherits STATE
- City
- — inherits STATE
ZIP-level market 63116
- Rents YoY
- 2.6%
- Active inventory
- 261
- Price-to-rent
- 7.4×
Monthly cashflow live
- Estimated rent
- $1,472 high interval (Pro) →
- Mortgage (P&I)
- −$681
- Tax from tax record
- −$121 /mo · $1,453/yr
- Insurance
- −$54
- HOA
- −$0
- Vacancy / Maint / Mgmt
- −$309
- Net cashflow
- $306
Break-even live
Sensitivity live
| Price | -10% $380 | -5% $343 | +0% $306 | +5% $269 | +10% $233 |
|---|---|---|---|---|---|
| Rent | -10% $190 | -5% $248 | +0% $306 | +5% $364 | +10% $422 |
| Rate | -1.0pp $372 | -0.5pp $339 | base $306 | +0.5pp $272 | +1.0pp $238 |
UW: 25.0% down · 7.5% · 30yr · 1.5% tax · 5.0% vac · 8.0% maint · 8.0% mgmt
Financing live
Cash to close
- Down payment
- $32,475
- Closing costs
- $3,897
- Reserves months
- —
- Total cash needed
- —
Loan-product check · same deal, 3 products live
Conventional
25% down · 7.5% · 30yr
- Down + closing
- —
- Monthly P&I
- —
- Monthly cashflow
- —
- DSCR
- —
- Eligible?
- —
Personal DTI + credit; lowest rate.
DSCR
20% down · 8.5% · 30yr
- Down + closing
- —
- Monthly P&I
- —
- Monthly cashflow
- —
- DSCR
- —
- Eligible?
- —
No personal income docs; deal must DSCR.
Hard money
10% down · 12.0% · 12mo
- Down + closing
- —
- Monthly P&I
- —
- Monthly cashflow
- —
- DSCR
- —
- Eligible?
- —
Short-term bridge; refi at stabilization.
Rent comps 40 comps
| Address | Beds | Baths | Sqft | Rent | $/sqft | DOM | Units | Dist |
|---|---|---|---|---|---|---|---|---|
| 7109 Eugene Ave Saint Louis, MO | 3.0 | 2.0 | 1029 | $1,495 | $1.45 | 0d | 1 | 0.14mi |
| 7109 Eugene Ave Saint Louis, MO | 3.0 | 2.0 | 1029 | $1,495 | $1.45 | 4d | 1 | 0.14mi |
| 3857 Boulevard Heights Ct Saint Louis, MO | 3.0 | 2.5 | 1697 | $2,250 | $1.33 | 3d | 1 | 0.15mi |
| 4114 Alma Ave Saint Louis, MO | 3.0 | 1.5 | 1269 | $2,065 | $1.63 | 0d | 1 | 0.59mi |
| 4114 Alma Ave Saint Louis, MO | 3.0 | 1.5 | 1269 | $2,065 | $1.63 | 3d | 1 | 0.59mi |
| 6915 Alabama Ave Unit 1st Floor St. Louis, MO | 2.0 | 1.0 | 1248 | $1,200 | $0.96 | 45d | 1 | 0.60mi |
| 7417 Vermont Ave Unit 103 St. Louis, MO | 2.0 | 2.0 | 1069 | $1,500 | $1.40 | 16d | 1 | 0.65mi |
| 3945 Crosby Dr Saint Louis, MO | 2.0 | 1.0 | 1100 | $2,083 | $1.89 | 0d | 1 | 0.66mi |
| 7417 Vermont Ave St. Louis, MO | 1.0–2.0 | 1.0–2.0 | 1144 | $1,600 | $1.40 | 0d | 8 | 0.66mi |
| 3668 Wilmington Ave Saint Louis, MO | 2.0 | 1.0 | 1214 | $1,350 | $1.11 | 45d | 1 | 0.68mi |
| 6436 Idaho Ave Saint Louis, MO | 2.0 | 1.0 | 1050 | $995 | $0.95 | 45d | 1 | 0.69mi |
| 3668a Wilmington Ave St. Louis, MO | 2.0 | 1.0 | 1212 | $1,295 | $1.07 | 16d | 1 | 0.69mi |
| 6730 Vermont Ave Saint Louis, MO | 3.0 | 2.0 | 1534 | $1,600 | $1.04 | 16d | 1 | 0.71mi |
| 4075 Bowen St Saint Louis, MO | 2.0 | 1.0 | 1200 | $1,200 | $1.00 | 45d | 1 | 0.72mi |
| 7428 Morganford Rd Saint Louis, MO | 2.0 | 1.0 | 969 | $1,500 | $1.55 | 45d | 1 | 0.72mi |
| 3641 Wilmington Ave Saint Louis, MO | 2.0 | 1.0 | 1175 | $1,050 | $0.89 | 45d | 1 | 0.73mi |
| 6135 Newport Ave Saint Louis, MO | 2.0 | 1.0 | 960 | $1,976 | $2.06 | 0d | 1 | 0.75mi |
| 6800 Virginia Ave Unit 1 St. Louis, MO | 3.0 | 1.0 | 1500 | $1,475 | $0.98 | 19d | 1 | 0.77mi |
| 5707 Dewey Ave Unit 1F St. Louis, MO | 2.0 | 1.0 | 1000 | $1,050 | $1.05 | 16d | 1 | 0.81mi |
| 5707 Dewey Ave Unit 1F St. Louis, MO | 2.0 | 1.0 | 1000 | $1,050 | $1.05 | 0d | 1 | 0.81mi |
| 807 W Courtois St Apt D St. Louis, MO | 2.0 | 1.0 | 900 | $925 | $1.03 | 45d | 1 | 0.83mi |
| 813 W Courtois St Apt C St. Louis, MO | 2.0 | 1.0 | 1000 | $895 | $0.90 | 45d | 1 | 0.83mi |
| 736 Dover Pl Unit 1F St. Louis, MO | 2.0 | 1.0 | 1200 | $1,395 | $1.16 | 45d | 1 | 0.93mi |
| 7024 Pennsylvania Ave Unit F St. Louis, MO | 2.0 | 1.0 | 1081 | $930 | $0.86 | 18d | 1 | 0.94mi |
| 711 Wilmington Ave Unit NA St. Louis, MO | 2.0 | 1.0 | 1051 | $1,300 | $1.24 | 45d | 1 | 0.94mi |
| 7924 Michigan Ave Unit 2F St. Louis, MO | 3.0 | 2.0 | 1250 | $1,195 | $0.96 | 4d | 1 | 0.96mi |
| 712 Dover Pl Unit 1FL St. Louis, MO | 2.0 | 1.0 | 1100 | $1,000 | $0.91 | 45d | 1 | 0.97mi |
| 712 Dover Pl Saint Louis, MO | 2.0 | 1.0 | 1100 | $900 | $0.82 | 45d | 1 | 0.97mi |
| 128 Haven St Unit 2F St. Louis, MO | 2.0 | 1.0 | 900 | $950 | $1.06 | 12d | 1 | 0.97mi |
| 3824 Eiler St Saint Louis, MO | 2.0 | 1.0 | 1000 | $1,050 | $1.05 | 25d | 1 | 0.99mi |
| 8125 Michigan Ave St. Louis, MO | 1.0–2.0 | 1.0–2.0 | 797 | $1,150 | $1.44 | 16d | 1 | 1.01mi |
| 4000 Schiller Pl Saint Louis, MO | 2.0 | 2.5 | 1448 | $1,600 | $1.10 | 0d | 1 | 1.07mi |
| 5970 Wanda Ave Saint Louis, MO | 4.0 | 2.0 | 1282 | $1,995 | $1.56 | 19d | 1 | 1.11mi |
| 5836 Goener Ave Unit 2F St. Louis, MO | 3.0 | 1.0 | 1250 | $1,500 | $1.20 | 45d | 1 | 1.14mi |
| 4177 Schiller Pl Saint Louis, MO | 2.0 | 1.0 | 1200 | $1,150 | $0.96 | 25d | 1 | 1.21mi |
| 5033 Ulena Ave Saint Louis, MO | 2.0 | 1.0 | 960 | $1,575 | $1.64 | 45d | 1 | 1.21mi |
| 4933 Loughborough Ave Saint Louis, MO | 2.0 | 1.0 | 945 | $1,550 | $1.64 | 0d | 1 | 1.23mi |
| 4933 Loughborough Ave Saint Louis, MO | 2.0 | 1.0 | 945 | $1,550 | $1.64 | 3d | 1 | 1.23mi |
| 6445 S Kingshighway Blvd Saint Louis, MO | 2.0 | 1.0 | 972 | $1,600 | $1.65 | 45d | 1 | 1.27mi |
| 3717 Delor St Unit 37172-F St. Louis, MO | 2.0 | 1.5 | 900 | $1,115 | $1.24 | 25d | 1 | 1.27mi |
Listing history 19 events
-
2026-06-16status $129,900 Pending 71 DOM
-
2026-06-15days on market $129,900 Active 71 DOM
-
2026-06-13days on market $129,900 Active 69 DOM
-
2026-06-09days on market $129,900 Active 65 DOM
-
2026-06-08days on market $129,900 Active 64 DOM
-
2026-06-08days on market $129,900 Active 63 DOM
-
2026-06-05days on market $129,900 Active 60 DOM
-
2026-06-03days on market $129,900 Active 59 DOM
-
2026-06-02days on market $129,900 Active 58 DOM
-
2026-06-01days on market $129,900 Active 57 DOM
-
2026-06-01price $129,900 Active 56 DOM
-
2026-05-31days on market $134,900 Active 56 DOM
-
2026-05-18price $134,900 863-char remark
Show marketing remark (863 chars)
Attention investors and buyers seeking a renovation opportunity! This spacious ranch-style home features high ceilings and generously sized rooms, all within a short walking distance of desirable Carondelet Park. Over the past 12 years, the current owner has made several key updates, including replacement of the furnace, roof, and select windows. The bathroom has been tastefully updated with tiled floors and walls, a whirlpool tub, and modern plumbing fixtures. While the property does require some additional work, it offers excellent potential for equity growth. Property is being sold as-is. Seller will not provide inspections, repairs, or warranties. Special Sale Contract only. Please do not allow cats to escape if present during showings. Showings begin Monday, 04/06/26. Kindly provide at least 3 hours’ advance notice for all showing requests.
-
2026-04-27price $139,900 863-char remark
Show marketing remark (863 chars)
Attention investors and buyers seeking a renovation opportunity! This spacious ranch-style home features high ceilings and generously sized rooms, all within a short walking distance of desirable Carondelet Park. Over the past 12 years, the current owner has made several key updates, including replacement of the furnace, roof, and select windows. The bathroom has been tastefully updated with tiled floors and walls, a whirlpool tub, and modern plumbing fixtures. While the property does require some additional work, it offers excellent potential for equity growth. Property is being sold as-is. Seller will not provide inspections, repairs, or warranties. Special Sale Contract only. Please do not allow cats to escape if present during showings. Showings begin Monday, 04/06/26. Kindly provide at least 3 hours’ advance notice for all showing requests.
-
2026-04-06$149,900 Active 863-char remark
Show marketing remark (863 chars)
Attention investors and buyers seeking a renovation opportunity! This spacious ranch-style home features high ceilings and generously sized rooms, all within a short walking distance of desirable Carondelet Park. Over the past 12 years, the current owner has made several key updates, including replacement of the furnace, roof, and select windows. The bathroom has been tastefully updated with tiled floors and walls, a whirlpool tub, and modern plumbing fixtures. While the property does require some additional work, it offers excellent potential for equity growth. Property is being sold as-is. Seller will not provide inspections, repairs, or warranties. Special Sale Contract only. Please do not allow cats to escape if present during showings. Showings begin Monday, 04/06/26. Kindly provide at least 3 hours’ advance notice for all showing requests.
-
2026-04-05historical $149,900 863-char remark
Show marketing remark (863 chars)
Attention investors and buyers seeking a renovation opportunity! This spacious ranch-style home features high ceilings and generously sized rooms, all within a short walking distance of desirable Carondelet Park. Over the past 12 years, the current owner has made several key updates, including replacement of the furnace, roof, and select windows. The bathroom has been tastefully updated with tiled floors and walls, a whirlpool tub, and modern plumbing fixtures. While the property does require some additional work, it offers excellent potential for equity growth. Property is being sold as-is. Seller will not provide inspections, repairs, or warranties. Special Sale Contract only. Please do not allow cats to escape if present during showings. Showings begin Monday, 04/06/26. Kindly provide at least 3 hours’ advance notice for all showing requests.
-
2012-04-11soldstatus
-
2012-04-04soldstatus 600-char remark
Show marketing remark (600 chars)
This property being sold As Is by Public Administrator of the City of St. Louis. All offers are to be submitted on Special Sale Contract form. All cash no contingencies. With Sale Contract buyer to submit executed Notice to Buyer Regarding Sales Subject to Probate Court Approval. $4,500 MINIMUM BID. $1,000 earnest money with Sale Contract in certified funds to Insight Title Company (where Seller closes). No Seller disclosure. Possession upon receipt of sale proceeds by Seller. Availability of funds letter to be submitted with Sale Contrct. Please allow 21 days for acceptance of offer.
-
2012-02-17$6,000 600-char remark
Show marketing remark (600 chars)
This property being sold As Is by Public Administrator of the City of St. Louis. All offers are to be submitted on Special Sale Contract form. All cash no contingencies. With Sale Contract buyer to submit executed Notice to Buyer Regarding Sales Subject to Probate Court Approval. $4,500 MINIMUM BID. $1,000 earnest money with Sale Contract in certified funds to Insight Title Company (where Seller closes). No Seller disclosure. Possession upon receipt of sale proceeds by Seller. Availability of funds letter to be submitted with Sale Contrct. Please allow 21 days for acceptance of offer.
ⓘ Source: listings_history table (triggers on properties + properties_extension) + one-shot
backfill from property_details.listing_events for pre-trigger history.
Tax reassessment forecast MO · Resets to sale price
- Current annual tax
- $1,453 · $121/mo
- Projected year-2 tax
- $1,453 · $121/mo
- Expected delta
- $0/yr ($0/mo · 0.0%)
ⓘ Screening estimate from a state-policy table — verify with the county assessor before closing.
Climate risk First Street
- Flood 1/10 Low FEMA zone X (unshaded) · 0% chance over 30 yrs
- Wildfire 1/10 Low
- Heat 5/10 Major 7 d/yr ≥108°F today · 21 d/yr by 30 yrs out
- Wind 2/10 Low 100% chance of damaging wind over 30 yrs
- Air quality 3/10 Moderate 3 unhealthy d/yr today · 4 by 30 yrs out
Nearby sold comps map
Loading sold comps map…
Walkable amenities ~0.75 mi
Loading nearby amenities…
Taxation est. · year 1
- Rental income
- $17,658
- − Mortgage interest
- −$7,276
- − Property taxes
- −$1,453
- − Insurance
- −$650
- − Repairs & maintenance
- −$1,413
- − Management
- −$1,413
- − Depreciation
- −$3,779
- Taxable income
- $1,675
- Est. tax owed @ 24.0%
- −$402
- After-tax cash flow
- $3,271/yr
For passive investors: Depreciation is non-cash, so a rental often shows a tax loss while cash-flowing — sheltering income. Rental losses are passive: they offset passive income freely, and up to $25,000/yr can offset ordinary (W-2) income if you actively participate and your MAGI is under $100k (phasing out to $0 by $150k); unused losses carry forward. On sale, claimed depreciation is recaptured at up to 25%, and gains may owe capital-gains tax (a 1031 exchange can defer both). Figures are a year-1 estimate at your 24.0% rate — not tax advice; consult a CPA.
Schools (NCES district)
- District
- St. Louis City
- NCES district ID
- 2929280
- Math proficiency
- 10% ▼ -6.00%
- Reading proficiency
- 18% ▼ -3.00%
- Median HH income
- $35,685
- Composite
- 11.54/100
- National rank
- #9699
- State rank
- #312 of 324 in MO
Livability — St. Louis
No livability data for this city. (Only ~50 U.S. cities are tracked.)
Census & demographics
- Census place
- St. Louis, MO
- County
- Saint Louis City · 254,015 people
- City population
- 283,259
- Metro
- St. Louis, MO-IL
- Population (ZIP)
- 42,170
- Household income
- $61,433
- Rent vs Own
- Severe rent burden
- 1923.0
Population outlook (St. Louis County) Hauer SSP2
- Today (2025)
- 315,737 people
- By 2030
- 313,865 · -0.6%
- By 2040
- 305,439 · -3.3%
- By 2050
- 296,529 · -6.1%
- By 2075
- 271,028 · -14.2%
- By 2100
- 255,359 · -19.1%
Race, ethnicity, and origin ACS 2023
- Neighborhood character
- Diverse neighborhood (Simpson 0.63)
- Race & ethnicity
- White 54% Black 27% Hispanic / Latino 10% Two or more races 8% Asian 5%
- Hispanic origin (detail)
- Mexican 7%
- Common ancestry
- Lithuanian 4% Romanian 2% Italian 2%
- Foreign-born
- 11% · Canada, Vietnam, Philippines
- Languages at home
- 85% English-only · Spanish 6% Vietnamese 2% Arabic 2%
Political lean MEDSL · St. Louis
- 2024 margin
- Solid D (+64.7) · D 81.4% · R 16.7% · Other 2.0%
- 2008→2024 swing
- -3.5pp toward R · 2008: 68.2pp · 2024: 64.7pp
- All cycles
- 2024: D+64.7 2020: D+66.2 2016: D+63.7 2012: D+66.6 2008: D+68.2
Not yet ingested
- Civics
- —
Market trends
- HPI YoY
- ▼ -271.19%
- Current HPI
- 215.7108
- Rent YoY
- ▲ 2.62%
- Metro
- St. Louis, MO-IL
- State GDP YoY
- ▲ 1.84%
- F500 in state
- 20
Industry mix (Fortune 500 HQ in MO)
| Industry | F500 HQs | Revenue |
|---|---|---|
| Healthcare | 1 | $163B |
|
||
| Insurance | 1 | $21B |
|
||
| Industrial Technology | 1 | $17B |
|
||
| Retail | 1 | $16B |
|
||
| Industrial Distribution | 1 | $10B |
|
||
| Utilities | 1 | $9B |
|
||
Price history
+2148.3% since first listed7 events — show timeline
- 2026-05-18 Price Changed $134,900 MARIS as Distributed by MLS Grid
- 2026-04-27 Price Changed $139,900 MARIS as Distributed by MLS Grid
- 2026-04-06 Listed $149,900 MARIS as Distributed by MLS Grid
- 2026-04-05 Coming Soon $149,900 MARIS as Distributed by MLS Grid
- 2012-04-11 Sold (Public Records) — Public Records
- 2012-04-04 Sold (MLS) — MARIS as Distributed by MLS Grid
- 2012-02-17 Listed $6,000 MARIS as Distributed by MLS Grid
Property tax history
+8.5%/yrLatest (2024): $1,453 · +578.0% YoY. Source: county tax records.
Cash-flow waterfall
monthlySold comps — $/sqft
last 12 mo · ≤1 miLoading sold comps…