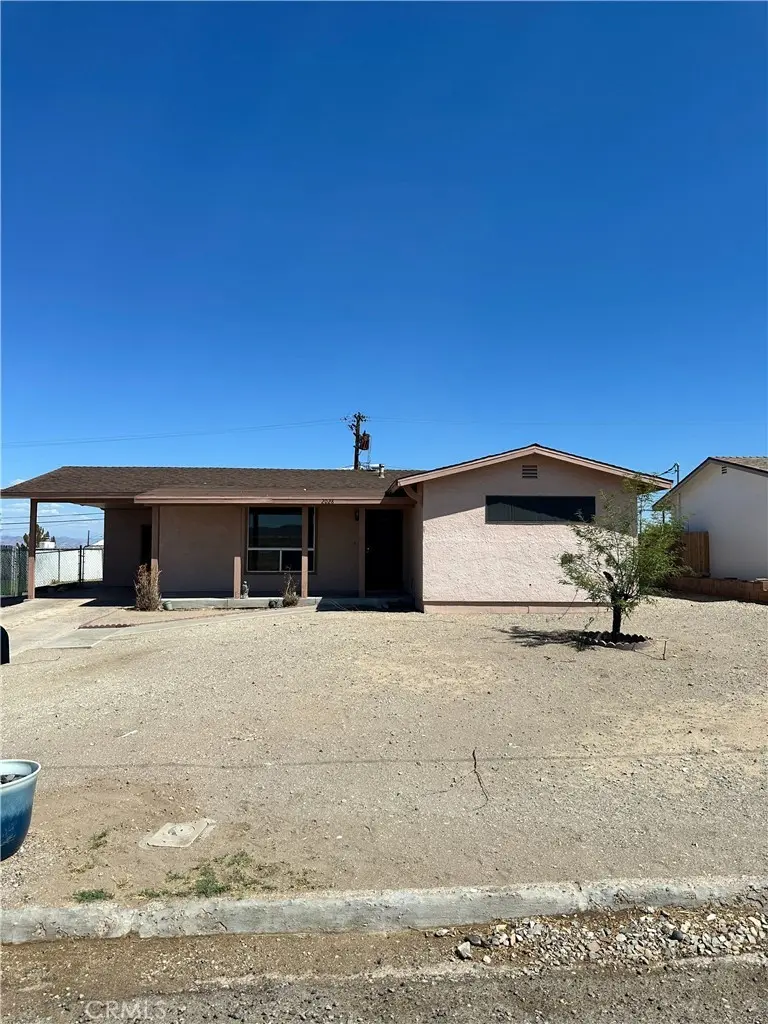
2028 Parkway · Needles, CA
Flood risk 1/10 · Minimal
- FEMA flood zone
- X (unshaded)
- Chance of flooding over 30 yrs
- 0.0%
- Est. flood insurance / yr
- $507 – $1,088
Fire risk 4/10 · Minor
- Est. fire insurance / yr
- $659 – $1,223
Heat risk 9/10 · Severe
- Hot days now (above 116°F)
- 7 days/yr
- Hot days in 30 yrs
- 15 days/yr
Wind risk 1/10 · Minimal
- Chance of severe wind over 30 yrs
- —
Air-quality risk 1/10 · Minimal
- Unhealthy air days now
- 0 days/yr
- Unhealthy air days in 30 yrs
- 0 days/yr
Risk factors via First Street. Map © Google.
Why this score? — see what drove the C grade
The composite is a weighted blend of 9 inputs, each scored 0–100. Each bar is that input's sub-score; the figure is the points it added to the 100-point composite (weight × sub-score).
- Cash flow +18.7/30.0
- ARV discount +12.0/15.0
- DSCR +5.9/10.0
- Appreciation +5.8/10.0
- 1% rule +4.2/10.0
- Livability +3.1/5.0
- Rent growth +2.5/5.0
- Condition / age +2.5/5.0
- Schools +2.3/10.0
$157,000
🖨 Deal sheet (PDF) 📄 Offer letter ✓ Due diligence
Listing remarks MLS
This home greets you with a cute little front porch looking out into the open land/rolling hills across the street. Upon entering the home you have the living room that leads into the dining area with a nice flow into the kitchen. Down the hall you come to the bathroom on your left and the first bedroom straight ahead. Turning down the hall to your right you are greeted with 2 more bedrooms and lots of storage space/cupboards on the dividing wall from the living room. With a unique design at the end of this hallway you wrap back around to the living room by the front door. The backyard is spacious with a porch and a clean slate to make it your own.
Key facts
- Open land
- Lots of storage
- Kitchen
Tags
Neighborhood map
What this means for you Summary
Snapshot
- This is a 3-bed/1.0-bath single-family listed at $157k.
Deal economics
- At list price, monthly cash flow is $155 ($2k/yr) — positive.
- The deal already cash-flows at list — no discount required.
- To meet the 1% rule (rent ≥ 1% of price), the offer needs to be $144k (8.0% below list).
- Recommended offer: $138k (12.0% below list) — sets the bar for market timing.
- Cap rate 7.5% vs local median 5.3% in Needles — top-decile yield for the area; either an underpriced asset or a hidden risk that comps aren't pricing in. Stress-test before assuming the spread holds.
Location & tenants
- Location reads 62/100 on livability (#492 in CA) — a middle-class / working-renter tenant base. Strengths: commute A+, cost of living A+, housing A+; Watch: health & safety C-, crime F, amenities F.
- Needles Unified (town): math 22% / reading 28% proficiency, ranked #1,194 of 1,400 in CA (top 85%) — low school quality limits family demand, transient renter base, plan for 1-2y turnover; 68% free/reduced lunch — lower-income household profile, screen leases tightly.
- Zoned schools: Needles Middle (math 12% / reading 27%, grade F, #419 of 498 statewide, top 85%, 192 students, 80% FRL).
- Market conditions: 161 active listings in the ZIP; 9 comparable units currently listed for rent nearby; rentals at typical pace (median 15d on market — plan ~3-4 weeks tenant-placement turnaround); 5,458 units permitted in San Bernardino County in 2024 (1,500 in 5+ unit buildings).
Forward outlook
- In year one you build about $4k of equity ($1k loan paydown + $3k appreciation (1.6% local appreciation)).
- San Bernardino County population projected at +15% by 2050 — modest demand growth; plan on rents tracking national, not racing it.
- At projected returns (1.6% appreciation + 3.0% rent growth), your $44k cash investment doubles in ~7 years — after that, you're playing with house money.
- By year 9, paydown + projected appreciation supports a ~$32k cash-out refi (75% LTV) — recoverable capital for the next deal without selling this one.
Negotiation context
- It's been on market 145 days — a 12% lower offer ($138k) is reasonable based on typical stale-listing flexibility.
- Current owner paid $40k; list at $157k implies a 292% gain — meaningful room to come down on a strong offer.
Risks & watch-outs
- Watch-outs: built in 1958 — expect roof / HVAC / electrical / plumbing capex.
- Climate carrying-cost: extreme-heat days projected 7→15/yr by 2055 (HVAC capex compounding) — expect insurance premiums to compound above CPI over the hold.
Questions for the listing agent
- It's been on market 145 days. Have you received any prior offers? Is the seller open to a 12% concession, seller financing, or rate buy-down credit?
- Built in 1958 — when were the roof, HVAC, electrical panel, plumbing, and water heater last replaced?
- Why hasn't it sold? Are there any deal-killer items the seller is aware of (foundation, flood, title, zoning, code violations)?
- Is there a deadline driving the sale (1031 exchange, divorce, estate, relocation)? That informs how much negotiation room exists.
- Schools are D-rated, which usually means shorter tenancies and higher turnover. Who's the typical renter profile here, and what's been the actual vacancy rate?
- Crime grade is F in this area — have there been break-ins, vandalism, or insurance claims at this property in the last 3 years? What carrier currently insures it and at what premium?
- What's the average days-on-market for RENTAL listings here right now (not sales)? A rising rental-DOM trend means longer vacancies and softer asking-rent achievability than the comps imply.
- What's the recent tenant-quality profile in this submarket — average credit score on applications, eviction rate, late-payment / NSF rate, and stable-employment percentage? A property-management company in the area should have these aggregated.
- How much new for-sale + rental construction is in the pipeline within 1–3 miles? Heavy new supply typically softens prices + rents 12–24 months out; constrained supply supports both.
Investment metrics
- 1% rule
- 0.92% ✗
- Cap rate
- 7.48%
- Cash-on-cash
- 4.23%
- DSCR
- 1.19
- GRM
- 9.1
CMA / ARV
- ARV (median comp)
- $174,593
- List price
- $157,000
- Delta
- -10.08%
- Verdict
- UNDERPRICED
- Comps
- 20 within 1.0 mi
Show comp detail 7 sales within ~0.75 mi
| Address | Dist | Beds/Ba | Sqft | Sold | Price | $/sf | Match |
|---|---|---|---|---|---|---|---|
| 2004 Cortez St | 0.13mi | 3/1.0 | 1,104 (+6%) | 14mo | $155,000 | $140 | 73 |
| 2025 Rio Vis | 0.10mi | 3/2.0 | 1,200 (+15%) | 8mo | $191,000 | $159 | 60 |
| 1933 Rio | 0.18mi | 3/1.0 | 1,184 (+13%) | 11mo | $170,000 | $144 | 60 |
| 1920 Flora | 0.23mi | 3/1.0 | 1,184 (+13%) | 10mo | $150,000 | $127 | 59 |
| 1621 Collins St | 0.67mi | 2/1.5 (-1) | 1,020 (-2%) | 10mo | $130,000 | $127 | 50 |
| 2032 Luna | 0.17mi | 3/2.0 | 1,200 (+15%) | 19mo | $172,500 | $144 | 47 |
| 1709 Washington St | 0.66mi | 2/1.0 (-1) | 910 (-13%) | 12mo | $123,000 | $135 | 32 |
Match score weights: distance 35% · size 25% · config 20% · recency 20%. Top-matched comps best support the ARV.
Projected returns pro-forma
1.64% appreciation · 3.0% rent growth · sell at horizon
- IRR
- 7.7%
- Equity multiple
- 1.40×
- Total profit
- $17,778
- Equity at exit
- $58,928
- IRR
- 11.2%
- Equity multiple
- 2.45×
- Total profit
- $63,853
- Equity at exit
- $82,613
Cash invested: $43,960 (down + closing). Projections, not guarantees.
Landlord ↔ Tenant lean methodology
- Overall (STATE)
- 18 Strongly Tenant-Friendly
- State California
- 18 Strongly Tenant-Friendly · D+13
- County
- — inherits STATE
- City
- — inherits STATE
ZIP-level market 92363
- Home prices YoY
- 0.6%
- Active inventory
- 161
- Price-to-rent
- 9.1×
Monthly cashflow live
- Estimated rent
- $1,444 high interval (Pro) →
- Mortgage (P&I)
- −$823
- Tax from tax record
- −$97 /mo · $1,164/yr
- Insurance
- −$65
- HOA
- −$0
- Vacancy / Maint / Mgmt
- −$303
- Net cashflow
- $155
Break-even live
Sensitivity live
| Price | -10% $244 | -5% $199 | +0% $155 | +5% $111 | +10% $66 |
|---|---|---|---|---|---|
| Rent | -10% $41 | -5% $98 | +0% $155 | +5% $212 | +10% $269 |
| Rate | -1.0pp $234 | -0.5pp $195 | base $155 | +0.5pp $114 | +1.0pp $73 |
UW: 25.0% down · 7.5% · 30yr · 1.5% tax · 5.0% vac · 8.0% maint · 8.0% mgmt
Financing live
Cash to close
- Down payment
- $39,250
- Closing costs
- $4,710
- Reserves months
- —
- Total cash needed
- —
Loan-product check · same deal, 3 products live
Conventional
25% down · 7.5% · 30yr
- Down + closing
- —
- Monthly P&I
- —
- Monthly cashflow
- —
- DSCR
- —
- Eligible?
- —
Personal DTI + credit; lowest rate.
DSCR
20% down · 8.5% · 30yr
- Down + closing
- —
- Monthly P&I
- —
- Monthly cashflow
- —
- DSCR
- —
- Eligible?
- —
No personal income docs; deal must DSCR.
Hard money
10% down · 12.0% · 12mo
- Down + closing
- —
- Monthly P&I
- —
- Monthly cashflow
- —
- DSCR
- —
- Eligible?
- —
Short-term bridge; refi at stabilization.
Rent comps 9 comps
| Address | Beds | Baths | Sqft | Rent | $/sqft | DOM | Units | Dist |
|---|---|---|---|---|---|---|---|---|
| 1929 Flora Vis Needles, CA | 3.0 | 1.0 | 1184 | $1,700 | $1.44 | 15d | 1 | 0.20mi |
| 1514 4th St Unit 1514 Needles, CA | 3.0 | 1.0 | 968 | $1,375 | $1.42 | 15d | 1 | 0.90mi |
| 110 S L St Needles, CA | 2.0 | 1.0 | 700 | $800 | $1.14 | 45d | 1 | 1.01mi |
| 804 Valley Ave Needles, CA | 3.0 | 1.0 | 840 | $1,300 | $1.55 | 15d | 1 | 1.04mi |
| 512 E St Needles, CA | 3.0 | 1.0 | 895 | $1,300 | $1.45 | 15d | 1 | 1.06mi |
| 503 California Ave Needles, CA | 3.0 | 2.0 | 1428 | $1,500 | $1.05 | 15d | 1 | 1.08mi |
| 412 D St Needles, CA | 2.0 | 1.0 | 1096 | $1,200 | $1.09 | 15d | 1 | 1.13mi |
| 316 Cibola St Unit Frt Needles, CA | 3.0 | 2.0 | 1270 | $1,300 | $1.02 | 22d | 1 | 1.41mi |
| 316 Bazoobuth St Needles, CA | 3.0 | 1.0 | 1100 | $1,250 | $1.14 | 15d | 1 | 1.41mi |
Listing history 14 events
-
2026-06-14days on market $157,000 Active 145 DOM
-
2026-06-13days on market $157,000 Active 144 DOM
-
2026-06-10days on market $157,000 Active 142 DOM
-
2026-06-09days on market $157,000 Active 141 DOM
-
2026-06-08days on market $157,000 Active 140 DOM
-
2026-06-07days on market $157,000 Active 139 DOM
-
2026-06-05days on market $157,000 Active 136 DOM
-
2026-06-02days on market $157,000 Active 134 DOM
-
2026-06-01days on market $157,000 Active 133 DOM
-
2026-06-01remarks 699-char remark
-
2026-05-31days on market $157,000 Active 132 DOM
-
2026-05-30days on market $157,000 Active 131 DOM
-
2026-01-19$157,000 Active 656-char remark
Show marketing remark (656 chars)
This home greets you with a cute little front porch looking out into the open land/rolling hills across the street. Upon entering the home you have the living room that leads into the dining area with a nice flow into the kitchen. Down the hall you come to the bathroom on your left and the first bedroom straight ahead. Turning down the hall to your right you are greeted with 2 more bedrooms and lots of storage space/cupboards on the dividing wall from the living room. With a unique design at the end of this hallway you wrap back around to the living room by the front door. The backyard is spacious with a porch and a clean slate to make it your own.
-
1996-04-23soldstatus $40,000
ⓘ Source: listings_history table (triggers on properties + properties_extension) + one-shot
backfill from property_details.listing_events for pre-trigger history.
Tax reassessment forecast CA · Resets to sale price
- Current annual tax
- $1,164 · $97/mo
- Projected year-2 tax
- $1,193 · $99/mo
- Expected delta
- +$29/yr (+$2/mo · 2.5%)
ⓘ Screening estimate from a state-policy table — verify with the county assessor before closing.
Climate risk First Street
- Flood 1/10 Low FEMA zone X (unshaded) · 0% chance over 30 yrs
- Wildfire 4/10 Moderate
- Heat 9/10 Extreme 7 d/yr ≥116°F today · 15 d/yr by 30 yrs out
- Wind 1/10 Low
- Air quality 1/10 Low 0 unhealthy d/yr today · 0 by 30 yrs out
Nearby sold comps map
Loading sold comps map…
Walkable amenities ~0.75 mi
Loading nearby amenities…
Taxation est. · year 1
- Rental income
- $17,327
- − Mortgage interest
- −$8,794
- − Property taxes
- −$1,164
- − Insurance
- −$785
- − Repairs & maintenance
- −$1,386
- − Management
- −$1,386
- − Depreciation
- −$4,567
- Taxable loss
- −$756
- Est. tax savings @ 24.0%
- +$181
- After-tax cash flow
- $2,041/yr
For passive investors: Depreciation is non-cash, so a rental often shows a tax loss while cash-flowing — sheltering income. Rental losses are passive: they offset passive income freely, and up to $25,000/yr can offset ordinary (W-2) income if you actively participate and your MAGI is under $100k (phasing out to $0 by $150k); unused losses carry forward. On sale, claimed depreciation is recaptured at up to 25%, and gains may owe capital-gains tax (a 1031 exchange can defer both). Figures are a year-1 estimate at your 24.0% rate — not tax advice; consult a CPA.
Schools (NCES district)
- District
- Needles Unified
- NCES district ID
- 0626760
- Math proficiency
- 22% ▼ -2.00%
- Reading proficiency
- 28% ▼ -1.00%
- Median HH income
- $31,795
- Composite
- 23.35/100
- National rank
- #13305
- State rank
- #1194 of 1400 in CA
Livability — Needles
- Score
- 62/100
- State rank
- #492
- US rank
- #16661
Category grades
Schools grade is shown separately in the Schools card above.
Census & demographics
- Census place
- Needles, CA
- Population (ZIP)
- 5,392
Population outlook (San Bernardino County) Hauer SSP2
- Today (2025)
- 2,300,329 people
- By 2030
- 2,378,907 · +3.4%
- By 2040
- 2,523,137 · +9.7%
- By 2050
- 2,642,388 · +14.9%
- By 2075
- 2,880,769 · +25.2%
- By 2100
- 2,909,436 · +26.5%
Race, ethnicity, and origin ACS 2023
- Neighborhood character
- Diverse neighborhood (Simpson 0.63)
- Race & ethnicity
- White 54% Hispanic / Latino 29% Two or more races 16% Native American 11% Black 3%
- Hispanic origin (detail)
- Mexican 24% Puerto Rican 2%
- Common ancestry
- Romanian 3% Iranian 3% Lithuanian 2%
- Foreign-born
- 3% · Canada, China
- Languages at home
- 89% English-only · Spanish 9% Chinese 1%
Political lean MEDSL · San Bernardino
- 2024 margin
- Toss-up / Even · D 47.5% · R 49.7% · Other 2.8%
- 2008→2024 swing
- -8.5pp toward R · 2008: 6.3pp · 2024: -2.1pp
- All cycles
- 2024: R+2.1 2020: D+10.7 2016: D+9.8 2012: D+5.4 2008: D+6.3
Not yet ingested
- Civics
- —
Market trends
- HPI YoY
- ▲ 1.64%
- Current HPI
- 279.7931
- Rent YoY
- —
- Metro
- —
- State GDP YoY
- ▲ 3.21%
- F500 in state
- 116
Industry mix (Fortune 500 HQ in CA)
| Industry | F500 HQs | Revenue |
|---|---|---|
| Technology | 27 | $1,492B |
|
||
| Financial Services | 3 | $174B |
|
||
| Retail | 3 | $44B |
|
||
| Insurance | 3 | $26B |
|
||
| Media / Entertainment | 2 | $115B |
|
||
| Pharmaceuticals / Biotech | 2 | $62B |
|
||
Price history
+292.5% since first listed2 events — show timeline
- 2026-01-19 Listed $157,000 CRMLS
- 1996-04-23 Sold (Public Records) $40,000 Public Records
Property tax history
+2.4%/yrLatest (2025): $1,164 · +1.7% YoY. Source: county tax records.
Cash-flow waterfall
monthlySold comps — $/sqft
last 12 mo · ≤1 miLoading sold comps…