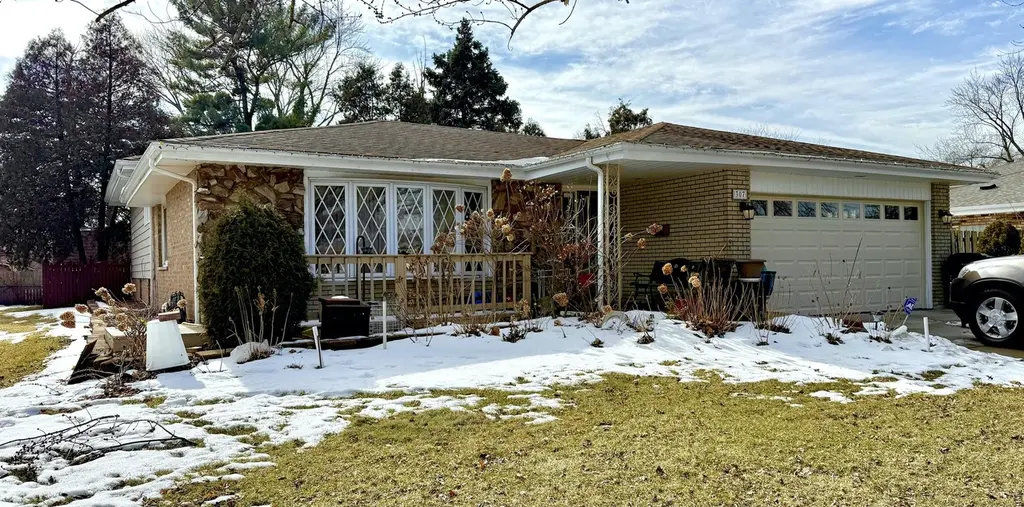
307 E 173rd St · South Holland, IL
Flood risk 1/10 · Minimal
- FEMA flood zone
- X (unshaded)
- Chance of flooding over 30 yrs
- 0.0%
- Est. flood insurance / yr
- $473 – $860
Fire risk 3/10 · Minor
- Est. fire insurance / yr
- $804 – $1,492
Heat risk 3/10 · Minor
- Hot days now (above 102°F)
- 7 days/yr
- Hot days in 30 yrs
- 15 days/yr
Wind risk 2/10 · Minimal
- Chance of severe wind over 30 yrs
- —
Air-quality risk 4/10 · Minor
- Unhealthy air days now
- 4 days/yr
- Unhealthy air days in 30 yrs
- 5 days/yr
Risk factors via First Street. Map © Google.
Why this score? — see what drove the D+ grade
The composite is a weighted blend of 9 inputs, each scored 0–100. Each bar is that input's sub-score; the figure is the points it added to the 100-point composite (weight × sub-score).
- Cash flow +24.9/30.0
- DSCR +8.1/10.0
- 1% rule +7.2/10.0
- Livability +3.9/5.0
- Rent growth +2.5/5.0
- Condition / age +2.5/5.0
- Schools +0.7/10.0
- ARV discount +0.0/15.0
- Appreciation +0.0/10.0
$250,000
🖨 Deal sheet 📄 Offer letter ✓ Due diligence
Listing remarks
Welcome to this lovingly maintained home in the heart of South Holland, proudly owned by the same family since 1994. Nestled on a quiet block at 307 E 173rd St, this residence has been the backdrop for decades of cherished memories - from raising children to hosting holidays and everything in between. Meticulously cared for and thoughtfully updated over the years, the pride of ownership is evident throughout. Every space reflects warmth, comfort, and the kind of attention that only long-term homeowners can provide. Spacious living areas offer the perfect setting for everyday living and entertaining, while the inviting atmosphere makes you feel right at home the moment you walk in. The owner
Key facts
- 1.64 acre lot
- 2 garage spots
- Built 1971
Neighborhood map
What this means for you Summary
Snapshot
- This is a 4-bed/1.5-bath single-family listed at $250k.
Deal economics
- At list price, monthly cash flow is $534 ($6k/yr) — positive.
- The deal already cash-flows at list — no discount required.
- Meets the 1% rule at list price ($3k rent vs $250k).
- Recommended offer: $246k (1.5% below list) — sets the bar for market timing.
Location & tenants
- Location reads 77/100 on livability (#167 in IL, #3,071 nationally) — a middle-class / working-renter tenant base. Strengths: commute A+, housing A+, cost of living A; Watch: crime C-, amenities C-.
- Thornton Twp Hsd 205 (suburban): math 7% / reading 8% proficiency, ranked #594 of 620 in IL (top 96%) — low school quality limits family demand, transient renter base, plan for 1-2y turnover.
- Zoned schools: Thornwood High School (math 8% / reading 9%, grade F, #584 of 693 statewide, top 85%, 1,996 students, 0% FRL).
- Market conditions: 135 active listings in the ZIP; 6,272 units permitted in Cook County in 2024 (4,658 in 5+ unit buildings).
Forward outlook
- Local home prices are declining (-3.0%/yr); year-one equity from $2k of loan paydown is wiped out by about $8k of value loss. Plan a longer hold.
Negotiation context
- It's been on market 15 days — a 2% lower offer ($246k) is reasonable based on typical stale-listing flexibility.
- Current owner paid $120k; list at $250k implies a 108% gain — meaningful room to come down on a strong offer.
Questions for the listing agent
- Built in 1971 — when were the roof, HVAC, electrical panel, plumbing, and water heater last replaced?
- Is there a deadline driving the sale (1031 exchange, divorce, estate, relocation)? That informs how much negotiation room exists.
- Schools are D-rated, which usually means shorter tenancies and higher turnover. Who's the typical renter profile here, and what's been the actual vacancy rate?
- The area grade is low — what's the realistic commute time and amenity access for the typical tenant pool here? Any planned neighborhood developments (good or bad) we should know about?
- What's the average days-on-market for RENTAL listings here right now (not sales)? A rising rental-DOM trend means longer vacancies and softer asking-rent achievability than the comps imply.
- What's the recent tenant-quality profile in this submarket — average credit score on applications, eviction rate, late-payment / NSF rate, and stable-employment percentage? A property-management company in the area should have these aggregated.
- How much new for-sale + rental construction is in the pipeline within 1–3 miles? Heavy new supply typically softens prices + rents 12–24 months out; constrained supply supports both.
Investment metrics
- 1% rule
- 1.22% ✓
- Cap rate
- 8.86%
- Cash-on-cash
- 9.16%
- DSCR
- 1.41
- GRM
- 6.8
CMA / ARV
- ARV (on-the-fly)
- $206,176
- Comps found
- 12
Show comp detail 12 sales within ~0.75 mi
| Address | Dist | Beds/Ba | Sqft | Sold | Price | $/sf | Match |
|---|---|---|---|---|---|---|---|
| 17331 Wausau Ct | 0.04mi | 3/2.0 (-1) | 1,632 (+8%) | 3mo | $259,900 | $159 | 76 |
| 17164 Louis Ave | 0.15mi | 5/2.5 (+1) | 1,438 (-5%) | 2mo | $190,000 | $132 | 74 |
| 255 E 170th St | 0.34mi | 3/2.0 (-1) | 1,504 (-1%) | 4mo | $229,000 | $152 | 72 |
| 920 Sunnyside Ave | 0.20mi | 4/1.0 | 1,393 (-8%) | 4mo | $173,000 | $124 | 72 |
| 59 Indianwood Dr | 0.44mi | 4/2.0 | 1,506 (-1%) | 5mo | $190,000 | $126 | 72 |
| 16712 Elm St | 0.73mi | 3/2.0 (-1) | 1,446 (-5%) | 2mo | $191,000 | $132 | 50 |
| 16850 School St | 0.68mi | 3/2.0 (-1) | 1,614 (+6%) | 3mo | $205,000 | $127 | 48 |
| 16856 School St | 0.67mi | 3/1.5 (-1) | 1,398 (-8%) | 4mo | $217,000 | $155 | 48 |
| 16827 Parkside Ave | 0.69mi | 3/2.5 (-1) | 1,613 (+6%) | 0mo | $220,000 | $136 | 48 |
| 534 E 168th Pl | 0.67mi | 3/2.0 (-1) | 1,613 (+6%) | 5mo | $153,000 | $95 | 47 |
| 17148 Evans Dr | 0.65mi | 3/2.0 (-1) | 1,405 (-7%) | 7mo | $225,000 | $160 | 45 |
| 16927 Langley Ave | 0.66mi | 3/1.5 (-1) | 1,288 (-15%) | 1mo | $179,900 | $140 | 38 |
Match score weights: distance 35% · size 25% · config 20% · recency 20%. Top-matched comps best support the ARV.
Projected returns pro-forma
-3.0% appreciation · 3.0% rent growth · sell at horizon
- IRR
- -2.4%
- Equity multiple
- 0.91×
- Total profit
- $-6,346
- Equity at exit
- $37,276
- IRR
- 7.3%
- Equity multiple
- 1.55×
- Total profit
- $38,848
- Equity at exit
- $21,615
Cash invested: $70,000 (down + closing). Projections, not guarantees.
Landlord ↔ Tenant lean methodology
- Overall (STATE)
- 43 Moderately Tenant-Leaning
- State Illinois
- 43 Moderately Tenant-Leaning · D+7
- County
- — inherits STATE
- City
- — inherits STATE
ZIP-level market 60473
- Active inventory
- 135
- Price-to-rent
- 6.8×
Monthly cashflow live
- Estimated rent
- $3,051 medium interval (Pro) →
- Mortgage (P&I)
- −$1,311
- Tax from tax record
- −$461 /mo · $5,532/yr
- Insurance
- −$104
- HOA
- −$0
- Vacancy / Maint / Mgmt
- −$641
- Net cashflow
- $534
Break-even live
UW: 25.0% down · 7.5% · 30yr · 1.5% tax · 5.0% vac · 8.0% maint · 8.0% mgmt
Financing live
Cash to close
- Down payment
- $62,500
- Closing costs
- $7,500
- Reserves months
- —
- Total cash needed
- —
Loan-product check · same deal, 3 products live
Conventional
25% down · 7.5% · 30yr
- Down + closing
- —
- Monthly P&I
- —
- Monthly cashflow
- —
- DSCR
- —
- Eligible?
- —
Personal DTI + credit; lowest rate.
DSCR
20% down · 8.5% · 30yr
- Down + closing
- —
- Monthly P&I
- —
- Monthly cashflow
- —
- DSCR
- —
- Eligible?
- —
No personal income docs; deal must DSCR.
Hard money
10% down · 12.0% · 12mo
- Down + closing
- —
- Monthly P&I
- —
- Monthly cashflow
- —
- DSCR
- —
- Eligible?
- —
Short-term bridge; refi at stabilization.
Listing history 17 events
-
2026-06-18days on market $250,000 Coming Soon 15 DOM
-
2026-06-17days on market $250,000 Coming Soon 14 DOM
-
2026-06-16days on market $250,000 Coming Soon 13 DOM
-
2026-06-15days on market $250,000 Coming Soon 12 DOM
-
2026-06-13days on market $250,000 Coming Soon 10 DOM
-
2026-06-13days on market $250,000 Coming Soon 9 DOM
-
2026-06-09days on market $250,000 Coming Soon 6 DOM
-
2026-06-08days on market $250,000 Coming Soon 5 DOM
-
2026-06-07days on market $250,000 Coming Soon 4 DOM
-
2026-06-04statusdays on market $250,000 Coming Soon 1 DOM
-
2026-06-03days on market $250,000 Active (Private) 105 DOM
-
2026-06-02days on market $250,000 Active (Private) 104 DOM
-
2026-06-01days on market $250,000 Active (Private) 103 DOM
-
2026-05-31days on market $250,000 Active (Private) 102 DOM
-
2026-05-28price $250,000
-
2026-04-09historical
-
1994-09-28soldstatus $120,000
ⓘ Source: listings_history table (triggers on properties + properties_extension) + one-shot
backfill from property_details.listing_events for pre-trigger history.
Tax reassessment forecast IL · Partial reset (capped growth)
- Current annual tax
- $5,532 · $461/mo
- Projected year-2 tax
- $5,604 · $467/mo
- Expected delta
- +$71/yr (+$6/mo · 1.3%)
ⓘ Screening estimate from a state-policy table — verify with the county assessor before closing.
Climate risk First Street
- Flood 1/10 Low FEMA zone X (unshaded) · 0% chance over 30 yrs
- Wildfire 3/10 Moderate
- Heat 3/10 Moderate 7 d/yr ≥102°F today · 15 d/yr by 30 yrs out
- Wind 2/10 Low
- Air quality 4/10 Moderate 4 unhealthy d/yr today · 5 by 30 yrs out
Nearby sold comps map
Loading sold comps map…
Walkable amenities ~0.75 mi
Loading nearby amenities…
Taxation est. · year 1
- Rental income
- $36,615
- − Mortgage interest
- −$14,004
- − Property taxes
- −$5,532
- − Insurance
- −$1,250
- − Repairs & maintenance
- −$2,929
- − Management
- −$2,929
- − Depreciation
- −$7,273
- Taxable income
- $2,698
- Est. tax owed @ 24.0%
- −$647
- After-tax cash flow
- $5,764/yr
For passive investors: Depreciation is non-cash, so a rental often shows a tax loss while cash-flowing — sheltering income. Rental losses are passive: they offset passive income freely, and up to $25,000/yr can offset ordinary (W-2) income if you actively participate and your MAGI is under $100k (phasing out to $0 by $150k); unused losses carry forward. On sale, claimed depreciation is recaptured at up to 25%, and gains may owe capital-gains tax (a 1031 exchange can defer both). Figures are a year-1 estimate at your 24.0% rate — not tax advice; consult a CPA.
Schools (NCES district)
- District
- Thornton Twp Hsd 205
- NCES district ID
- 1738970
- Math proficiency
- 7% ▬ 0.00%
- Reading proficiency
- 8% ▼ -2.00%
- Median HH income
- $43,392
- Composite
- 6.92/100
- National rank
- #9976
- State rank
- #594 of 620 in IL
Livability — South Holland
- Score
- 77/100
- State rank
- #167
- US rank
- #3071
Category grades
Schools grade is shown separately in the Schools card above.
Census & demographics
- Census place
- South Holland, IL
- City population
- 21,407
- Population (ZIP)
- 21,407
Population outlook (Cook County) Hauer SSP2
- Today (2025)
- 5,347,519 people
- By 2030
- 5,357,703 · +0.2%
- By 2040
- 5,324,924 · -0.4%
- By 2050
- 5,230,762 · -2.2%
- By 2075
- 4,785,735 · -10.5%
- By 2100
- 4,188,836 · -21.7%
Race, ethnicity, and origin ACS 2023
- Neighborhood character
- Predominantly Black (75%)
- Race & ethnicity
- Black 75% White 10% Hispanic / Latino 10% Two or more races 3% Asian 1%
- Hispanic origin (detail)
- Mexican 9% Puerto Rican 1%
- Common ancestry
- Iranian 3% Romanian 2%
- Foreign-born
- 6% · Canada, China
- Languages at home
- 87% English-only · Spanish 8% Other Asian/Pacific 1% Russian/Polish/Slavic 1%
Political lean MEDSL · Cook
- 2024 margin
- Solid D (+42.0) · D 70.4% · R 28.4% · Other 1.2%
- 2008→2024 swing
- -11.4pp toward R · 2008: 53.4pp · 2024: 42.0pp
- All cycles
- 2024: D+42.0 2020: D+50.3 2016: D+53.0 2012: D+49.4 2008: D+53.4
Not yet ingested
- Civics
- —
Market trends
- HPI YoY
- ▼ -114.36%
- Current HPI
- 201.2479
- Rent YoY
- —
- Metro
- —
- State GDP YoY
- ▲ 1.59%
- F500 in state
- 60
Industry mix (Fortune 500 HQ in IL)
| Industry | F500 HQs | Revenue |
|---|---|---|
| Insurance | 4 | $201B |
|
||
| Consumer Goods | 4 | $87B |
|
||
| Industrial Machinery | 3 | $64B |
|
||
| Healthcare | 2 | $55B |
|
||
| Retail / Pharmacy | 1 | $148B |
|
||
| Agriculture / Food | 1 | $86B |
|
||
Price history
+108.3% since first listed3 events — show timeline
- 2026-05-28 Price Changed $250,000 MRED as Distributed by MLS Grid
- 2026-04-09 Listing Removed — MRED as Distributed by MLS Grid
- 1994-09-28 Sold (Public Records) $120,000 Public Records
Property tax history
+3.6%/yrLatest (2023): $5,532 · +14.7% YoY. Source: county tax records.
Cash-flow waterfall
monthlySold comps — $/sqft
last 12 mo · ≤1 miLoading sold comps…