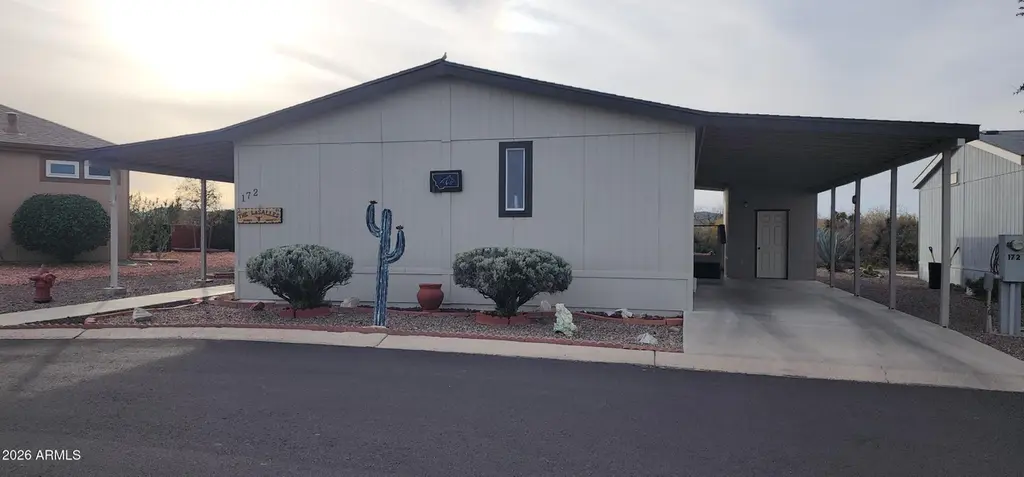
2501 W Wickenburg Way #172 · Wickenburg, AZ
Flood risk 8/10 · Major
- FEMA flood zone
- AE
- Chance of flooding over 30 yrs
- 0.99%
- Est. flood insurance / yr
- $1,737 – $8,500
Fire risk 5/10 · Moderate
- Est. fire insurance / yr
- $610 – $1,132
Heat risk 8/10 · Major
- Hot days now (above 109°F)
- 5 days/yr
- Hot days in 30 yrs
- 13 days/yr
Wind risk 1/10 · Minimal
- Chance of severe wind over 30 yrs
- —
Air-quality risk 1/10 · Minimal
- Unhealthy air days now
- 0 days/yr
- Unhealthy air days in 30 yrs
- 0 days/yr
Risk factors via First Street. Map © Google.
Why this score? — see what drove the B grade
The composite is a weighted blend of 9 inputs, each scored 0–100. Each bar is that input's sub-score; the figure is the points it added to the 100-point composite (weight × sub-score).
- Cash flow +30.0/30.0
- 1% rule +10.0/10.0
- DSCR +10.0/10.0
- ARV discount +7.5/15.0
- Condition / age +3.8/5.0
- Livability +3.5/5.0
- Schools +2.9/10.0
- Rent growth +2.5/5.0
- Appreciation +0.0/10.0
$94,500
🖨 Deal sheet 📄 Offer letter ✓ Due diligence
Listing remarks MLS
This well kept and nicely furnished 3 bed, 2 bath home is ideal for snow birding or full-time living. It sits on the far west side of the park next to the wash, so the views out the backdoor are unobstructed and simply fabulous. If living in a 55+ park is what your looking for, then this is the home for you. Buyer's will be required to be approved by the Westpark management. Please check with them on all rules and regulations.
Key facts
- Unobstructed views
- 2 parking spots
- Community pool
Tags
Neighborhood map
What this means for you Summary
Snapshot
- This is a 3-bed/2.0-bath manufactured listed at $94k. Condition is rated good.
Deal economics
- At list price, monthly cash flow is $517 ($6k/yr) — positive.
- The deal already cash-flows at list — no discount required.
- Meets the 1% rule at list price ($2k rent vs $94k).
- Recommended offer: $83k (12.0% below list) — sets the bar for market timing.
- Cap rate 18.3% vs local median 3.0% in Wickenburg — top-decile yield for the area; either an underpriced asset or a hidden risk that comps aren't pricing in. Stress-test before assuming the spread holds.
Location & tenants
- Location reads 70/100 on livability (#41 in AZ) — a middle-class / working-renter tenant base. Strengths: crime A+, housing A+, cost of living A-; Watch: schools D+, amenities F, commute F.
- Wickenburg Unified District (4236) (rural): math 33% / reading 35% proficiency, ranked #92 of 249 in AZ (top 37%) — families likely to look elsewhere, expect single-tenant / working-renter base with shorter leases.
- Market conditions: 378 active listings in the ZIP; 11 comparable units currently listed for rent nearby; rentals at typical pace (median 22d on market — plan ~3-4 weeks tenant-placement turnaround); 36,011 units permitted in Maricopa County in 2024 (12,801 in 5+ unit buildings).
- This rent runs 35% of the median local income ($69k/yr) — at the standard rent-burdened threshold; future hikes will face affordability resistance.
Forward outlook
- Local home prices are declining (-3.0%/yr); year-one equity from $653 of loan paydown is wiped out by about $3k of value loss. Plan a longer hold.
- Maricopa County population projected at +38% by 2050 — long-run rental-demand tailwind backs the buy-and-hold thesis.
- At projected returns (-3.0% appreciation + 3.0% rent growth), your $26k cash investment doubles in ~6 years — after that, you're playing with house money.
Negotiation context
- It's been on market 146 days — a 12% lower offer ($83k) is reasonable based on typical stale-listing flexibility.
Risks & watch-outs
- Watch-outs: flood insurance adds $427/mo.
- Climate carrying-cost: in FEMA flood zone AE (mandatory federal flood insurance); moderate wildfire risk; extreme-heat days projected 5→13/yr by 2055 (HVAC capex compounding) — expect insurance premiums to compound above CPI over the hold.
Questions for the listing agent
- It's been on market 146 days. Have you received any prior offers? Is the seller open to a 12% concession, seller financing, or rate buy-down credit?
- What's the actual annual flood-insurance premium (NFIP or private), and is the property in a SFHA with mandatory coverage?
- Why hasn't it sold? Are there any deal-killer items the seller is aware of (foundation, flood, title, zoning, code violations)?
- Is there a deadline driving the sale (1031 exchange, divorce, estate, relocation)? That informs how much negotiation room exists.
- Schools are D-rated, which usually means shorter tenancies and higher turnover. Who's the typical renter profile here, and what's been the actual vacancy rate?
- What's the average days-on-market for RENTAL listings here right now (not sales)? A rising rental-DOM trend means longer vacancies and softer asking-rent achievability than the comps imply.
- What's the recent tenant-quality profile in this submarket — average credit score on applications, eviction rate, late-payment / NSF rate, and stable-employment percentage? A property-management company in the area should have these aggregated.
- How much new for-sale + rental construction is in the pipeline within 1–3 miles? Heavy new supply typically softens prices + rents 12–24 months out; constrained supply supports both.
Investment metrics
- 1% rule
- 2.14% ✓
- Cap rate
- 18.27%
- Cash-on-cash
- 42.79%
- DSCR
- 2.90
- GRM
- 3.9
CMA / ARV
- ARV (median comp)
- $39,445
- List price
- $94,500
- Delta
- 139.57%
- Verdict
- OVERPRICED
- Comps
- 16 within 1.0 mi
Show comp detail 12 sales within ~0.75 mi
| Address | Dist | Beds/Ba | Sqft | Sold | Price | $/sf | Match |
|---|---|---|---|---|---|---|---|
| 2501 W Wickenburg Way #362 | 0.00mi | 2/2.0 (-1) | 1,361 (-1%) | 2mo | $99,900 | $73 | 92 |
| 2501 W Wickenburg Way #37 | 0.00mi | 2/2.0 (-1) | 1,440 (+5%) | 1mo | $15,000 | $10 | 86 |
| 2501 W Wickenburg Way #137 | 0.00mi | 2/2.0 (-1) | 1,344 (-2%) | 9mo | $27,000 | $20 | 84 |
| 2501 W Wickenburg Way #171 | 0.00mi | 2/2.0 (-1) | 1,344 (-2%) | 9mo | $70,000 | $52 | 84 |
| 2501 W Wickenburg Way #353 | 0.00mi | 2/2.0 (-1) | 1,500 (+9%) | 1mo | $100,000 | $67 | 78 |
| 2501 W Wickenburg Way #35 | 0.00mi | 2/2.0 (-1) | 1,248 (-9%) | 2mo | $14,500 | $12 | 78 |
| 2501 W Wickenburg Way #102 | 0.00mi | 2/3.0 (-1) | 1,560 (+14%) | 1mo | $15,000 | $10 | 67 |
| 2501 W Wickenburg Way #175 | 0.00mi | 3/2.0 | 1,560 (+14%) | 12mo | $79,500 | $51 | 67 |
| 2501 W Wickenburg Way #122 | 0.00mi | 2/2.0 (-1) | 1,176 (-14%) | 6mo | $64,700 | $55 | 67 |
| 685 Smoketree St | 0.62mi | 2/2.0 (-1) | 1,260 (-8%) | 13mo | $230,000 | $183 | 42 |
| 2040 W Val Vista Dr | 0.60mi | 2/2.0 (-1) | 1,210 (-12%) | 7mo | $200,000 | $165 | 41 |
| 725 W Smoketree Rd | 0.62mi | 2/2.0 (-1) | 1,568 (+14%) | 4mo | $210,000 | $134 | 38 |
Match score weights: distance 35% · size 25% · config 20% · recency 20%. Top-matched comps best support the ARV.
Projected returns pro-forma
-3.0% appreciation · 3.0% rent growth · sell at horizon
- IRR
- 16.7%
- Equity multiple
- 1.68×
- Total profit
- $17,905
- Equity at exit
- $14,090
- IRR
- 25.4%
- Equity multiple
- 3.24×
- Total profit
- $59,178
- Equity at exit
- $8,171
Cash invested: $26,460 (down + closing). Projections, not guarantees.
Landlord ↔ Tenant lean methodology
- Overall (STATE)
- 87 Strongly Landlord-Friendly
- State Arizona
- 87 Strongly Landlord-Friendly · R+3
- County
- — inherits STATE
- City
- — inherits STATE
ZIP-level market 85390
- Home prices YoY
- -17.4%
- Active inventory
- 378
- Price-to-rent
- 3.9×
Monthly cashflow live
- Estimated rent
- $2,021 high interval (Pro) →
- Mortgage (P&I)
- −$496
- Tax est. 1.5%
- −$118 /mo · $1,418/yr
- Insurance
- −$39
- Flood insurance flood zone
- −$427 /mo · $5,118/yr
- HOA
- −$0
- Vacancy / Maint / Mgmt
- −$424
- Net cashflow
- $517
Break-even live
UW: 25.0% down · 7.5% · 30yr · 1.5% tax · 5.0% vac · 8.0% maint · 8.0% mgmt
Financing live
Cash to close
- Down payment
- $23,625
- Closing costs
- $2,835
- Reserves months
- —
- Total cash needed
- —
Loan-product check · same deal, 3 products live
Conventional
25% down · 7.5% · 30yr
- Down + closing
- —
- Monthly P&I
- —
- Monthly cashflow
- —
- DSCR
- —
- Eligible?
- —
Personal DTI + credit; lowest rate.
DSCR
20% down · 8.5% · 30yr
- Down + closing
- —
- Monthly P&I
- —
- Monthly cashflow
- —
- DSCR
- —
- Eligible?
- —
No personal income docs; deal must DSCR.
Hard money
10% down · 12.0% · 12mo
- Down + closing
- —
- Monthly P&I
- —
- Monthly cashflow
- —
- DSCR
- —
- Eligible?
- —
Short-term bridge; refi at stabilization.
Rent comps 11 comps
| Address | Beds | Baths | Sqft | Rent | $/sqft | DOM | Units | Dist |
|---|---|---|---|---|---|---|---|---|
| 2159 W Terrace Dr Wickenburg, AZ | 3.0 | 2.0 | 1304 | $2,100 | $1.61 | 43d | 1 | 0.50mi |
| 2110 W Terrace Dr Wickenburg, AZ | 3.0 | 2.0 | 1358 | $1,600 | $1.18 | 24d | 1 | 0.59mi |
| 540 S West Rd #24 Wickenburg, AZ | 3.0 | 1.0 | 894 | $2,200 | $2.46 | 24d | 1 | 0.73mi |
| 1845 Yance Dr Wickenburg, AZ | 4.0 | 2.0 | 1741 | $1,995 | $1.15 | 43d | 1 | 1.35mi |
| 1850 Yance Dr Wickenburg, AZ | 4.0 | 2.0 | 1815 | $1,830 | $1.01 | 5d | 1 | 1.37mi |
| 1830 Yance Dr Wickenburg, AZ | 4.0 | 2.0 | 1741 | $1,835 | $1.05 | 12d | 1 | 1.39mi |
| 1820 Yance Dr Wickenburg, AZ | 4.0 | 2.0 | 1815 | $1,830 | $1.01 | 21d | 1 | 1.40mi |
| 895 Jubal Ln Wickenburg, AZ | 4.0 | 2.0 | 1815 | $3,500 | $1.93 | 43d | 1 | 1.41mi |
| 1800 Yance Dr Wickenburg, AZ | 4.0 | 2.0 | 1741 | $1,825 | $1.05 | 12d | 1 | 1.42mi |
| 1790 Yance Dr Wickenburg, AZ | 4.0 | 2.0 | 1815 | $1,815 | $1.00 | 21d | 1 | 1.44mi |
| 1780 Yance Dr Wickenburg, AZ | 3.0 | 2.0 | 1619 | $1,725 | $1.07 | 12d | 1 | 1.45mi |
Listing history 15 events
-
2026-06-18days on market $94,500 Active 146 DOM
-
2026-06-17days on market $94,500 Active 145 DOM
-
2026-06-16days on market $94,500 Active 144 DOM
-
2026-06-15days on market $94,500 Active 143 DOM
-
2026-06-13days on market $94,500 Active 141 DOM
-
2026-06-13days on market $94,500 Active 140 DOM
-
2026-06-09days on market $94,500 Active 137 DOM
-
2026-06-08days on market $94,500 Active 136 DOM
-
2026-06-07days on market $94,500 Active 135 DOM
-
2026-06-04days on market $94,500 Active 132 DOM
-
2026-06-03days on market $94,500 Active 131 DOM
-
2026-06-02days on market $94,500 Active 130 DOM
-
2026-06-01days on market $94,500 Active 129 DOM
-
2026-05-31days on market $94,500 Active 128 DOM
-
2026-01-23$94,500 Active 430-char remark
Show marketing remark (430 chars)
This well kept and nicely furnished 3 bed, 2 bath home is ideal for snow birding or full-time living. It sits on the far west side of the park next to the wash, so the views out the backdoor are unobstructed and simply fabulous. If living in a 55+ park is what your looking for, then this is the home for you. Buyer's will be required to be approved by the Westpark management. Please check with them on all rules and regulations.
ⓘ Source: listings_history table (triggers on properties + properties_extension) + one-shot
backfill from property_details.listing_events for pre-trigger history.
Climate risk First Street
- Flood 8/10 Severe FEMA zone AE · 99% chance over 30 yrs
- Wildfire 5/10 Major
- Heat 8/10 Severe 5 d/yr ≥109°F today · 13 d/yr by 30 yrs out
- Wind 1/10 Low
- Air quality 1/10 Low 0 unhealthy d/yr today · 0 by 30 yrs out
Nearby sold comps map
Loading sold comps map…
Walkable amenities ~0.75 mi
Loading nearby amenities…
Taxation est. · year 1
- Rental income
- $24,252
- − Mortgage interest
- −$5,293
- − Property taxes
- −$1,418
- − Insurance
- −$5,591
- − Repairs & maintenance
- −$1,940
- − Management
- −$1,940
- − Depreciation
- −$2,749
- Taxable income
- $5,320
- Est. tax owed @ 24.0%
- −$1,277
- After-tax cash flow
- $4,927/yr
For passive investors: Depreciation is non-cash, so a rental often shows a tax loss while cash-flowing — sheltering income. Rental losses are passive: they offset passive income freely, and up to $25,000/yr can offset ordinary (W-2) income if you actively participate and your MAGI is under $100k (phasing out to $0 by $150k); unused losses carry forward. On sale, claimed depreciation is recaptured at up to 25%, and gains may owe capital-gains tax (a 1031 exchange can defer both). Figures are a year-1 estimate at your 24.0% rate — not tax advice; consult a CPA.
Condition & rehab AI · 6 photos
This well-maintained 3-bedroom, 2-bathroom home is in good condition and ready for move-in. It offers a great location with unobstructed views and is ideal for snowbirding or full-time living.
Value-add opportunities
- Both Paint exterior trim — Fresh paint enhances curb appeal and adds value.
- Both Inspect and clean gutters — Clean gutters prevent water damage and improve home's appearance.
Renovation cost estimate screening
Value-add ROI direction
- Both Paint exterior trim — Fresh paint enhances curb appeal and adds value. ↑
- Both Inspect and clean gutters — Clean gutters prevent water damage and improve home's appearance. ↑
ⓘ Cost ranges are severity-bucket heuristics (US national rule-of-thumb). Get contractor quotes + a written scope before underwriting a rehab budget.
Schools (NCES district)
- District
- Wickenburg Unified District (4236)
- NCES district ID
- 0409190
- Math proficiency
- 33% ▼ -10.00%
- Reading proficiency
- 35% ▼ -7.00%
- Median HH income
- $47,369
- Composite
- 29.27/100
- National rank
- #6560
- State rank
- #92 of 249 in AZ
Livability — Wickenburg
- Score
- 70/100
- State rank
- #41
- US rank
- #7975
Category grades
Schools grade is shown separately in the Schools card above.
Census & demographics
- Census place
- Wickenburg, AZ
- County
- Maricopa County · 4,537,380 people
- City population
- 10,298
- Metro
- Phoenix-Mesa-Chandler, AZ
- Population (ZIP)
- 10,298
- Household income
- $68,591
- Rent vs Own
- Severe rent burden
- 251.0
Population outlook (Maricopa County) Hauer SSP2
- Today (2025)
- 4,979,203 people
- By 2030
- 5,378,229 · +8.0%
- By 2040
- 6,156,598 · +23.6%
- By 2050
- 6,872,376 · +38.0%
- By 2075
- 8,401,270 · +68.7%
- By 2100
- 9,247,439 · +85.7%
Race, ethnicity, and origin ACS 2023
- Neighborhood character
- Predominantly White (88%)
- Race & ethnicity
- White 88% Hispanic / Latino 7% Two or more races 4% Native American 1%
- Hispanic origin (detail)
- Mexican 5%
- Common ancestry
- Portuguese 3% Lithuanian 3% Slovak 2%
- Foreign-born
- 3% · Canada
- Languages at home
- 93% English-only · Spanish 5%
Political lean MEDSL · Maricopa
- 2024 margin
- Toss-up / Even · D 47.7% · R 51.2% · Other 1.1%
- 2008→2024 swing
- +7.1pp toward D · 2008: -10.6pp · 2024: -3.5pp
- All cycles
- 2024: R+3.5 2020: D+2.2 2016: R+3.5 2012: R+12.0 2008: R+10.6
Not yet ingested
- Civics
- —
Market trends
- HPI YoY
- ▼ -66.26%
- Current HPI
- 314.3169
- Rent YoY
- —
- Metro
- Phoenix-Mesa-Chandler, AZ
- State GDP YoY
- ▲ 4.54%
- F500 in state
- 20
Industry mix (Fortune 500 HQ in AZ)
| Industry | F500 HQs | Revenue |
|---|---|---|
| Technology | 2 | $13B |
|
||
| Mining / Metals | 1 | $23B |
|
||
| Environmental Services | 1 | $16B |
|
||
| Metals / Steel | 1 | $14B |
|
||
| Technology Distribution | 1 | $9B |
|
||
| Homebuilding | 1 | $8B |
|
||
Price history
1 event — show timeline
- 2026-01-23 Listed $94,500 ARMLS
Cash-flow waterfall
monthlySold comps — $/sqft
last 12 mo · ≤1 miLoading sold comps…