 🏗️ New Construction
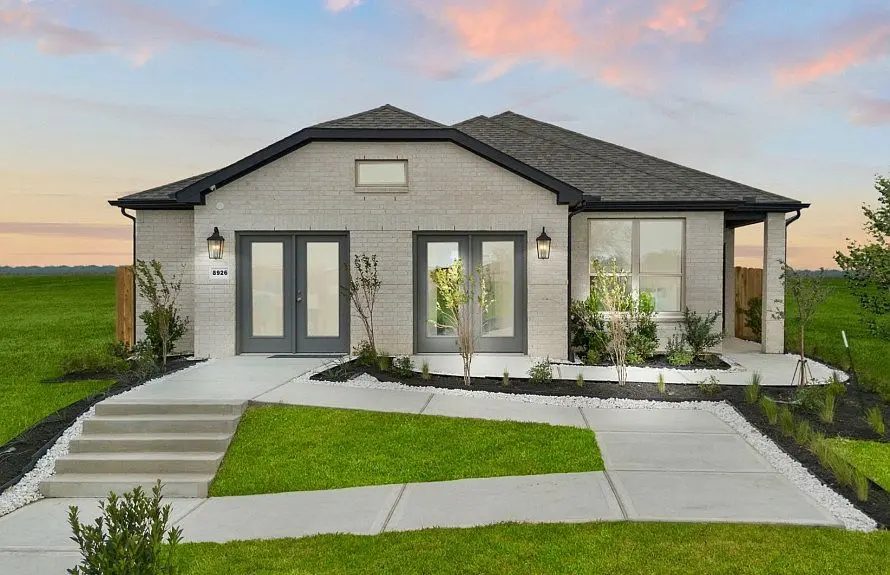
9011 Bay Lodge Ln · Baytown, TX
Flood risk No data
- FEMA flood zone
- —
- Chance of flooding over 30 yrs
- —
- Est. flood insurance / yr
- —
Fire risk No data
- Est. fire insurance / yr
- —
Heat risk No data
- Hot days now (above threshold)
- —
- Hot days in 30 yrs
- —
Wind risk No data
- Chance of severe wind over 30 yrs
- —
Air-quality risk No data
- Unhealthy air days now
- —
- Unhealthy air days in 30 yrs
- —
Risk factors via First Street. Map © Google.
Why this score? — see what drove the D grade
The composite is a weighted blend of 9 inputs, each scored 0–100. Each bar is that input's sub-score; the figure is the points it added to the 100-point composite (weight × sub-score).
- Cash flow +15.4/30.0
- ARV discount +7.5/15.0
- DSCR +4.7/10.0
- Livability +3.5/5.0
- 1% rule +3.3/10.0
- Schools +3.2/10.0
- Rent growth +2.9/5.0
- Condition / age +2.5/5.0
- Appreciation +0.0/10.0
$249,990
🖨 Deal sheet 📄 Offer letter ✓ Due diligence
Listing remarks
This well-maintained 3-bedroom, 2-bath home offers 1,500 square feet of thoughtfully designed living space, all on one level. A versatile flex space provides endless possibilities for a home office, playroom, or additional living area. Situated on a desirable corner lot, the property features a beautifully landscaped backyard highlighted by a stone fence and a covered patio—perfect for relaxing or entertaining year-round. The open and functional floor plan is filled with natural light and designed for comfortable everyday living. Enjoy the privacy, curb appeal, and convenience this home delivers. A must-see!
Key facts
- Landscaped backyard
- Covered patio
- Corner lot
Tags
Property features AI
Finance
- HOA & community: Associa-managed association; Annual association fee: $750; Community pool
Exterior
- Parking: Attached garage; 2-car garage
- Security: Prewired for security; Smoke detectors
- Utilities: Public water; Public sewer
- Home design: Residential property; New construction; South-facing; Single-story entry (first floor living); Slab foundation
- Construction: Built in 2026; Brick construction; Composition roof
- Exterior features: Covered patio; Fully fenced yard; Fence; Paved driveway; Porch; Patio; Private yard; Corner lot; Subdivision; Side yard; Asphalt road
Interior
- Kitchen: Convection oven; Dishwasher; Gas cooktop; Disposal; Gas range; Microwave; Oven; ENERGY STAR qualified appliances; Instant hot water; Tankless water heater
- Bedrooms: Primary bedroom (first floor); Bedroom (first floor); Bedroom (first floor)
- Flooring: Carpet; Tile
- Bathrooms: 2 full bathrooms
- Heating & cooling: Central heating (electric); Central air conditioning (electric)
- Interior features: Breakfast bar; Crown molding; Double vanity; Entrance foyer; High ceilings; Kitchen island; Kitchen/family room combo; Pantry; Self-closing cabinet doors and drawers; Soaking tub; Separate shower; Tub/shower combo
- Laundry & utility: Gas dryer hookup
Neighborhood map
What this means for you Summary
Snapshot
- This is a 3-bed/2.0-bath land listed at $250k.
Deal economics
- At list price, monthly cash flow is $100 ($1k/yr) — positive.
- The deal already cash-flows at list — no discount required.
- To meet the 1% rule (rent ≥ 1% of price), the offer needs to be $213k (14.9% below list).
- Recommended offer: $213k (14.9% below list) — sets the bar for 1% rule.
- Cap rate 6.8% vs local median 4.2% in Baytown — top-decile yield for the area; either an underpriced asset or a hidden risk that comps aren't pricing in. Stress-test before assuming the spread holds.
Location & tenants
- Location reads 69/100 on livability (#412 in TX) — a middle-class / working-renter tenant base. Strengths: cost of living A+, housing A+; Watch: employment D+, crime F, amenities F.
- Goose Creek CISD (urban): math 37% / reading 36% proficiency, ranked #473 of 826 in TX (top 57%) — families likely to look elsewhere, expect single-tenant / working-renter base with shorter leases; 61% free/reduced lunch — lower-income household profile, screen leases tightly.
- Zoned schools: Victoria Walker El (math 40% / reading 42%, grade F, #1,462 of 4,322 statewide, top 34%, 829 students, 66% FRL); E F Green Junior School (1,020 students, 67% FRL); Goose Creek Memorial (math 28% / reading 45%, grade F, #924 of 1,632 statewide, top 57%, 2,223 students, 70% FRL).
- Market conditions: Rents rising (+1.5%/yr); 612 active listings in the ZIP; 4 comparable units currently listed for rent nearby; rentals at typical pace (median 17d on market — plan ~3-4 weeks tenant-placement turnaround); 29,883 units permitted in Harris County in 2024 (8,621 in 5+ unit buildings).
- This rent runs 35% of the median local income ($74k/yr) — at the standard rent-burdened threshold; future hikes will face affordability resistance.
Forward outlook
- Local home prices are declining (-3.0%/yr); year-one equity from $2k of loan paydown is wiped out by about $8k of value loss. Plan a longer hold.
- Harris County population projected at +47% by 2050 — long-run rental-demand tailwind backs the buy-and-hold thesis.
Negotiation context
- Only 11 days on market — expect competitive offers; lowballing is unlikely to land.
- 3 sale attempts with the ask held roughly flat each time — persistent listings suggest the price (not the market) is what's stuck; bring a comps-based counter.
Questions for the listing agent
- What does the HOA fee cover, when was the last increase, and are there any pending special assessments or reserve-fund shortfalls?
- Is there a deadline driving the sale (1031 exchange, divorce, estate, relocation)? That informs how much negotiation room exists.
- Schools are D-rated, which usually means shorter tenancies and higher turnover. Who's the typical renter profile here, and what's been the actual vacancy rate?
- Crime grade is F in this area — have there been break-ins, vandalism, or insurance claims at this property in the last 3 years? What carrier currently insures it and at what premium?
- The area grade is low — what's the realistic commute time and amenity access for the typical tenant pool here? Any planned neighborhood developments (good or bad) we should know about?
- What's the average days-on-market for RENTAL listings here right now (not sales)? A rising rental-DOM trend means longer vacancies and softer asking-rent achievability than the comps imply.
- What's the recent tenant-quality profile in this submarket — average credit score on applications, eviction rate, late-payment / NSF rate, and stable-employment percentage? A property-management company in the area should have these aggregated.
- How much new for-sale + rental construction is in the pipeline within 1–3 miles? Heavy new supply typically softens prices + rents 12–24 months out; constrained supply supports both.
Investment metrics
- 1% rule
- 0.83% ✗
- Cap rate
- 6.76%
- Cash-on-cash
- 1.67%
- DSCR
- 1.07
- GRM
- 10.0
CMA / ARV
- ARV (median comp)
- $256,180
- List price
- $249,990
- Delta
- -0.46%
- Verdict
- FAIR
- Comps
- 20 within 1.0 mi
Projected returns pro-forma
-3.0% appreciation · 1.48% rent growth · sell at horizon
- IRR
- -15.2%
- Equity multiple
- 0.46×
- Total profit
- $-38,460
- Equity at exit
- $38,197
- IRR
- -9.2%
- Equity multiple
- 0.46×
- Total profit
- $-38,425
- Equity at exit
- $22,150
Cash invested: $71,730 (down + closing). Projections, not guarantees.
Landlord ↔ Tenant lean methodology
- Overall (STATE)
- 87 Strongly Landlord-Friendly
- State Texas
- 87 Strongly Landlord-Friendly · R+5
- County
- — inherits STATE
- City
- — inherits STATE
ZIP-level market 77521
- Rents YoY
- 1.5%
- Active inventory
- 612
- Price-to-rent
- 9.8×
Monthly cashflow live
- Estimated rent
- $2,129 medium interval (Pro) →
- Mortgage (P&I)
- −$1,343
- Tax from tax record
- −$69 /mo · $826/yr
- Insurance
- −$107
- HOA
- −$63
- Vacancy / Maint / Mgmt
- −$447
- Net cashflow
- $100
Break-even live
UW: 25.0% down · 7.5% · 30yr · 1.5% tax · 5.0% vac · 8.0% maint · 8.0% mgmt
Financing live
Cash to close
- Down payment
- $64,045
- Closing costs
- $7,685
- Reserves months
- —
- Total cash needed
- —
Loan-product check · same deal, 3 products live
Conventional
25% down · 7.5% · 30yr
- Down + closing
- —
- Monthly P&I
- —
- Monthly cashflow
- —
- DSCR
- —
- Eligible?
- —
Personal DTI + credit; lowest rate.
DSCR
20% down · 8.5% · 30yr
- Down + closing
- —
- Monthly P&I
- —
- Monthly cashflow
- —
- DSCR
- —
- Eligible?
- —
No personal income docs; deal must DSCR.
Hard money
10% down · 12.0% · 12mo
- Down + closing
- —
- Monthly P&I
- —
- Monthly cashflow
- —
- DSCR
- —
- Eligible?
- —
Short-term bridge; refi at stabilization.
Rent comps 4 comps
| Address | Beds | Baths | Sqft | Rent | $/sqft | DOM | Units | Dist |
|---|---|---|---|---|---|---|---|---|
| 6019 Standpiper Loop Baytown, TX | 4.0 | 2.0 | 1656 | $2,265 | $1.37 | 1d | 1 | 0.14mi |
| 8002 Sesame St Baytown, TX | 3.0 | 2.0 | 1819 | $2,100 | $1.15 | 17d | 1 | 0.91mi |
| 8110 Berkely Ct Baytown, TX | 4.0 | 2.0 | 1828 | $1,946 | $1.06 | 5d | 1 | 1.28mi |
| 4730 Black Rock St Baytown, TX | 3.0 | 2.0 | 1540 | $2,073 | $1.35 | 16d | 1 | 1.42mi |
HOA detail
- Monthly dues
- $63 · $756/yr
Listing history 16 events
-
2026-06-10status $249,990 Pending 11 DOM
-
2026-06-09days on market $249,990 Active 11 DOM
-
2026-06-07days on market $249,990 Active 9 DOM
-
2026-06-04days on market $249,990 Active 6 DOM
-
2026-06-03days on market $249,990 Active 5 DOM
-
2026-06-02days on market $249,990 Active 4 DOM
-
2026-06-01days on market $249,990 Active 3 DOM
-
2026-05-31days on market $249,990 Active 2 DOM
-
2026-05-01price $254,990 25-char remark
-
2026-04-28price $254,990 621-char remark
-
2026-04-09$266,310 Active 621-char remark
-
2026-04-09historical
-
2026-04-08price $266,310 25-char remark
-
2026-04-06price $266,310
-
2026-03-24$291,310 Active 25-char remark
-
2026-02-16$291,310 Active
ⓘ Source: listings_history table (triggers on properties + properties_extension) + one-shot
backfill from property_details.listing_events for pre-trigger history.
Tax reassessment forecast TX · Resets to sale price
- Current annual tax
- $826 · $69/mo
- Projected year-2 tax
- $4,575 · $381/mo
- Expected delta
- +$3,749/yr (+$312/mo · 453.7%)
ⓘ Screening estimate from a state-policy table — verify with the county assessor before closing.
Nearby sold comps map
Loading sold comps map…
Walkable amenities ~0.75 mi
Loading nearby amenities…
Taxation est. · year 1
- Rental income
- $25,544
- − Mortgage interest
- −$14,350
- − Property taxes
- −$826
- − Insurance
- −$1,281
- − Repairs & maintenance
- −$2,043
- − Management
- −$2,043
- − HOA
- −$756
- − Depreciation
- −$7,452
- Taxable loss
- −$3,209
- Est. tax savings @ 24.0%
- +$770
- After-tax cash flow
- $1,965/yr
For passive investors: Depreciation is non-cash, so a rental often shows a tax loss while cash-flowing — sheltering income. Rental losses are passive: they offset passive income freely, and up to $25,000/yr can offset ordinary (W-2) income if you actively participate and your MAGI is under $100k (phasing out to $0 by $150k); unused losses carry forward. On sale, claimed depreciation is recaptured at up to 25%, and gains may owe capital-gains tax (a 1031 exchange can defer both). Figures are a year-1 estimate at your 24.0% rate — not tax advice; consult a CPA.
Schools (NCES district)
- District
- Goose Creek CISD
- NCES district ID
- 4821150
- Math proficiency
- 37% ▼ -11.00%
- Reading proficiency
- 36% ▼ -4.00%
- Median HH income
- $52,468
- Composite
- 31.84/100
- National rank
- #5877
- State rank
- #473 of 826 in TX
Livability — Baytown
- Score
- 69/100
- State rank
- #412
- US rank
- #8494
Category grades
Schools grade is shown separately in the Schools card above.
Census & demographics
- County
- Harris County · 4,702,590 people
- City population
- 135,579
- Metro
- Houston-The Woodlands-Sugar Land, TX
- Population (ZIP)
- 69,038
- Household income
- $73,629
- Rent vs Own
- Severe rent burden
- 2121.0
Population outlook (Harris County) Hauer SSP2
- Today (2025)
- 5,571,493 people
- By 2030
- 6,089,821 · +9.3%
- By 2040
- 7,142,806 · +28.2%
- By 2050
- 8,185,864 · +46.9%
- By 2075
- 10,574,329 · +89.8%
- By 2100
- 12,109,958 · +117.4%
Race, ethnicity, and origin ACS 2023
- Neighborhood character
- Diverse neighborhood (Simpson 0.64)
- Race & ethnicity
- Hispanic / Latino 50% White 28% Two or more races 18% Black 17% Asian 3%
- Hispanic origin (detail)
- Mexican 42% Puerto Rican 2%
- Common ancestry
- Lithuanian 2% Slovak 1%
- Foreign-born
- 20% · Canada, Vietnam
- Languages at home
- 59% English-only · Spanish 36% French/Haitian/Cajun 1% Other Asian/Pacific 1%
Political lean MEDSL · Harris
- 2024 margin
- Lean D (+5.5) · D 52.0% · R 46.4% · Other 1.6%
- 2008→2024 swing
- +3.9pp toward D · 2008: 1.6pp · 2024: 5.5pp
- All cycles
- 2024: D+5.5 2020: D+13.3 2016: D+12.4 2012: D+0.1 2008: D+1.6
Not yet ingested
- Civics
- —
Market trends
- HPI YoY
- ▼ -154.80%
- Current HPI
- 246.1892
- Rent YoY
- ▲ 1.48%
- Metro
- Houston-The Woodlands-Sugar Land, TX
- State GDP YoY
- ▲ 3.95%
- F500 in state
- 110
Industry mix (Fortune 500 HQ in TX)
| Industry | F500 HQs | Revenue |
|---|---|---|
| Energy | 16 | $1,198B |
|
||
| Technology | 5 | $198B |
|
||
| Engineering / Construction | 4 | $72B |
|
||
| Energy Services | 3 | $60B |
|
||
| Utilities | 3 | $41B |
|
||
| Healthcare | 2 | $330B |
|
||
Price history
-14.2% since first listed8 events — show timeline
- 2026-06-09 Pending — HARMLS
- 2026-05-29 Listing Removed — HARMLS
- 2026-05-29 Listed $249,990 HARMLS
- 2026-04-28 Price Changed $254,990 HARMLS
- 2026-04-09 Listing Removed — HARMLS
- 2026-04-09 Listed $266,310 HARMLS
- 2026-04-06 Price Changed $266,310 HARMLS
- 2026-02-16 Listed $291,310 HARMLS
Cash-flow waterfall
monthlySold comps — $/sqft
last 12 mo · ≤1 miLoading sold comps…