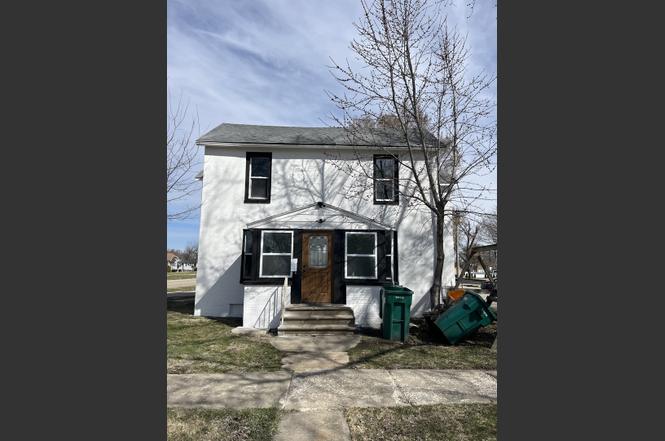
102 E Stanton St · Streator, IL
Flood risk 1/10 · Minimal
- FEMA flood zone
- X (unshaded)
- Chance of flooding over 30 yrs
- 0.0%
- Est. flood insurance / yr
- $473 – $860
Fire risk 1/10 · Minimal
- Est. fire insurance / yr
- $804 – $1,492
Heat risk 3/10 · Minor
- Hot days now (above 104°F)
- 7 days/yr
- Hot days in 30 yrs
- 17 days/yr
Wind risk 2/10 · Minimal
- Chance of severe wind over 30 yrs
- 1.0%
Air-quality risk 2/10 · Minimal
- Unhealthy air days now
- 1 days/yr
- Unhealthy air days in 30 yrs
- 1 days/yr
Risk factors via First Street. Map © Google.
Why this score? — see what drove the D+ grade
The composite is a weighted blend of 9 inputs, each scored 0–100. Each bar is that input's sub-score; the figure is the points it added to the 100-point composite (weight × sub-score).
- Cash flow +20.2/30.0
- ARV discount +7.5/15.0
- DSCR +6.4/10.0
- 1% rule +5.2/10.0
- Livability +3.2/5.0
- Rent growth +2.5/5.0
- Condition / age +2.5/5.0
- Schools +1.3/10.0
- Appreciation +0.0/10.0
$163,828
🖨 Deal sheet (PDF) 📄 Offer letter ✓ Due diligence
Listing remarks
Turnkey, Fully Rented Brick Duplex - Strong Cash Flow Beautifully maintained all-brick two-unit property, fully leased and producing income from day one. Each spacious unit offers 3 bedrooms, 1 bath, central A/C, updated kitchens with stainless steel appliances and granite countertops, and original hardwood floors. Newer windows, newer roof, make this a true low-maintenance investment. Current rents total $2,348/month ($28,176 annually). Asking $163,828 = strong return and excellent value. Includes basement, large attic for storage, and one-car garage. Located minutes from downtown Streator, shopping, dining, parks, Walmart, and McDonald's. Fully rented, refreshed, and move-in ready-a perf
Key facts
- Brick duplex
- Newer windows
- Updated kitchens
Tags
Property features AI
Finance
- Other: School bus service and interstate access noted
- Financial info: One unit currently rented for $1,290/month (lease through Oct 1, 2026); One unit currently rented for $1,058/month (lease through Jul 1, 2026); Special service area: No
Exterior
- Parking: Attached garage (1 garage space); 2 total parking spaces
- Utilities: Public water; Public sewer
- Home design: Two- to four-unit building (duplex); Fee simple ownership; Building age approximately 61–70 years; Rehab planned/completed in 2025; Located in Streator (Bruce township), on the corner of Stanton & Bloomington (RT23)
- Construction: Brick construction; Built before 1978
- Exterior features: Corner lot; Lot dimensions approximately 50 x 65; Less than 0.25 acre
Interior
- Kitchen: Each unit includes stove and refrigerator
- Bedrooms: 6 bedrooms (three on each unit: two 3-bed units)
- Bathrooms: 2 full bathrooms (one in each unit)
- Heating & cooling: Natural gas heating
- Interior features: 10 total rooms; Full unfinished basement
- Laundry & utility: Tenant(s) responsible for electric, gas, and heat (one unit also pays parking)
Neighborhood map
What this means for you Summary
Snapshot
- This is a 6-bed/2.0-bath single-family listed at $164k.
Deal economics
- At list price, monthly cash flow is $205 ($2k/yr) — positive.
- The deal already cash-flows at list — no discount required.
- Meets the 1% rule at list price ($2k rent vs $164k).
- Recommended offer: $149k (9.0% below list) — sets the bar for market timing.
Location & tenants
- Location reads 63/100 on livability (#752 in IL) — a middle-class / working-renter tenant base. Strengths: cost of living A+, health & safety A+, housing B+; Watch: amenities F, commute F, employment F.
- Streator Twp Hsd 40 (town): math 11% / reading 19% proficiency, ranked #513 of 620 in IL (top 83%) — low school quality limits family demand, transient renter base, plan for 1-2y turnover.
- Zoned schools: Centennial Elem School (math 13% / reading 20%, grade F, #1,224 of 2,056 statewide, top 60%, 470 students, 0% FRL); Northlawn Jr High School (math 7% / reading 14%, grade F, #580 of 665 statewide, top 88%, 617 students, 0% FRL); Streator Twp High School (math 11% / reading 19%, grade F, #462 of 693 statewide, top 68%, 809 students, 0% FRL).
- Market conditions: 85 active listings in the ZIP; 82 units permitted in LaSalle County in 2024 (0 in 5+ unit buildings).
- This rent runs 34% of the median local income ($59k/yr) — at the standard rent-burdened threshold; future hikes will face affordability resistance.
Forward outlook
- Local home prices are declining (-3.0%/yr); year-one equity from $1k of loan paydown is wiped out by about $5k of value loss. Plan a longer hold.
- LaSalle County population projected at -16% by 2050 — secular population decline; favor cash flow + early exit over multi-decade hold.
Negotiation context
- It's been on market 102 days — a 9% lower offer ($149k) is reasonable based on typical stale-listing flexibility.
- 11 sale attempts since 22y ago with the ask held roughly flat each time — persistent listings suggest the price (not the market) is what's stuck; bring a comps-based counter.
Questions for the listing agent
- It's been on market 102 days. Have you received any prior offers? Is the seller open to a 9% concession, seller financing, or rate buy-down credit?
- Built in 1964 — when were the roof, HVAC, electrical panel, plumbing, and water heater last replaced?
- Why hasn't it sold? Are there any deal-killer items the seller is aware of (foundation, flood, title, zoning, code violations)?
- Is there a deadline driving the sale (1031 exchange, divorce, estate, relocation)? That informs how much negotiation room exists.
- Schools are F-rated, which usually means shorter tenancies and higher turnover. Who's the typical renter profile here, and what's been the actual vacancy rate?
- The area grade is low — what's the realistic commute time and amenity access for the typical tenant pool here? Any planned neighborhood developments (good or bad) we should know about?
- What's the average days-on-market for RENTAL listings here right now (not sales)? A rising rental-DOM trend means longer vacancies and softer asking-rent achievability than the comps imply.
- What's the recent tenant-quality profile in this submarket — average credit score on applications, eviction rate, late-payment / NSF rate, and stable-employment percentage? A property-management company in the area should have these aggregated.
- How much new for-sale + rental construction is in the pipeline within 1–3 miles? Heavy new supply typically softens prices + rents 12–24 months out; constrained supply supports both.
Investment metrics
- 1% rule
- 1.02% ✓
- Cap rate
- 7.80%
- Cash-on-cash
- 5.37%
- DSCR
- 1.24
- GRM
- 8.2
CMA / ARV
No comps found within radius.
Projected returns pro-forma
-3.0% appreciation · 3.0% rent growth · sell at horizon
- IRR
- -8.0%
- Equity multiple
- 0.71×
- Total profit
- $-13,451
- Equity at exit
- $24,427
- IRR
- 1.6%
- Equity multiple
- 1.11×
- Total profit
- $5,191
- Equity at exit
- $14,165
Cash invested: $45,872 (down + closing). Projections, not guarantees.
Landlord ↔ Tenant lean methodology
- Overall (STATE)
- 43 Moderately Tenant-Leaning
- State Illinois
- 43 Moderately Tenant-Leaning · D+7
- County
- — inherits STATE
- City
- — inherits STATE
ZIP-level market 61364
- Home prices YoY
- -31.1%
- Active inventory
- 85
- Price-to-rent
- 8.2×
Monthly cashflow live
- Estimated rent
- $1,671 medium interval (Pro) →
- Mortgage (P&I)
- −$859
- Tax from tax record
- −$187 /mo · $2,246/yr
- Insurance
- −$68
- HOA
- −$0
- Vacancy / Maint / Mgmt
- −$351
- Net cashflow
- $205
Break-even live
Sensitivity live
| Price | -10% $298 | -5% $252 | +0% $205 | +5% $159 | +10% $113 |
|---|---|---|---|---|---|
| Rent | -10% $73 | -5% $139 | +0% $205 | +5% $271 | +10% $337 |
| Rate | -1.0pp $288 | -0.5pp $247 | base $205 | +0.5pp $163 | +1.0pp $120 |
UW: 25.0% down · 7.5% · 30yr · 1.5% tax · 5.0% vac · 8.0% maint · 8.0% mgmt
Financing live
Cash to close
- Down payment
- $40,957
- Closing costs
- $4,915
- Reserves months
- —
- Total cash needed
- —
Loan-product check · same deal, 3 products live
Conventional
25% down · 7.5% · 30yr
- Down + closing
- —
- Monthly P&I
- —
- Monthly cashflow
- —
- DSCR
- —
- Eligible?
- —
Personal DTI + credit; lowest rate.
DSCR
20% down · 8.5% · 30yr
- Down + closing
- —
- Monthly P&I
- —
- Monthly cashflow
- —
- DSCR
- —
- Eligible?
- —
No personal income docs; deal must DSCR.
Hard money
10% down · 12.0% · 12mo
- Down + closing
- —
- Monthly P&I
- —
- Monthly cashflow
- —
- DSCR
- —
- Eligible?
- —
Short-term bridge; refi at stabilization.
Listing history 50 events
-
2026-06-21days on market $163,828 Active 102 DOM
-
2026-06-19days on market $163,828 Active 100 DOM
-
2026-06-18days on market $163,828 Active 99 DOM
-
2026-06-17days on market $163,828 Active 98 DOM
-
2026-06-16days on market $163,828 Active 97 DOM
-
2026-06-15days on market $163,828 Active 96 DOM
-
2026-06-14days on market $163,828 Active 94 DOM
-
2026-06-12days on market $163,828 Active 93 DOM
-
2026-06-09days on market $163,828 Active 90 DOM
-
2026-06-08days on market $163,828 Active 89 DOM
-
2026-06-07days on market $163,828 Active 88 DOM
-
2026-06-05days on market $163,828 Active 85 DOM
-
2026-06-03days on market $163,828 Active 84 DOM
-
2026-06-02days on market $163,828 Active 83 DOM
-
2026-06-01days on market $163,828 Active 82 DOM
-
2026-05-31days on market $163,828 Active 81 DOM
-
2026-05-30days on market $163,828 Active 80 DOM
-
2026-03-11$163,828 Active
-
2026-03-11historical
-
2026-02-24Active
-
2026-02-24historical
-
2026-02-13Active
-
2025-03-24soldstatus $145,000 Closed
-
2025-02-21historical Contingent - No Showings
-
2025-02-04historical
-
2025-01-23$149,900 Active
-
2025-01-23historical
-
2024-12-19Active
-
2024-12-18historical
-
2024-12-03price
-
2024-11-01Active
-
2024-04-09soldstatus $55,000
-
2015-01-30soldstatus $16,250 Closed Sale
-
2015-01-22status Pending
-
2015-01-13price $18,500
-
2014-12-12price $21,900
-
2014-11-04price $29,900
-
2014-10-01$34,900 New
-
2013-08-15historical
-
2013-05-07price Price Change
-
2012-08-15New
-
2012-08-07historical
-
2011-11-01price Price Change
-
2011-07-12price Price Change
-
2011-02-15price Price Change
-
2011-01-11price Price Change
-
2010-11-19price Price Change
-
2010-10-29price Price Change
-
2010-09-23price Price Change
-
2010-07-20New
ⓘ Source: listings_history table (triggers on properties + properties_extension) + one-shot
backfill from property_details.listing_events for pre-trigger history.
Tax reassessment forecast IL · Partial reset (capped growth)
- Current annual tax
- $2,246 · $187/mo
- Projected year-2 tax
- $2,983 · $249/mo
- Expected delta
- +$736/yr (+$61/mo · 32.8%)
ⓘ Screening estimate from a state-policy table — verify with the county assessor before closing.
Climate risk First Street
- Flood 1/10 Low FEMA zone X (unshaded) · 0% chance over 30 yrs
- Wildfire 1/10 Low
- Heat 3/10 Moderate 7 d/yr ≥104°F today · 17 d/yr by 30 yrs out
- Wind 2/10 Low 100% chance of damaging wind over 30 yrs
- Air quality 2/10 Low 1 unhealthy d/yr today · 1 by 30 yrs out
Nearby sold comps map
Loading sold comps map…
Walkable amenities ~0.75 mi
Loading nearby amenities…
Taxation est. · year 1
- Rental income
- $20,050
- − Mortgage interest
- −$9,177
- − Property taxes
- −$2,246
- − Insurance
- −$819
- − Repairs & maintenance
- −$1,604
- − Management
- −$1,604
- − Depreciation
- −$4,766
- Taxable loss
- −$166
- Est. tax savings @ 24.0%
- +$40
- After-tax cash flow
- $2,505/yr
For passive investors: Depreciation is non-cash, so a rental often shows a tax loss while cash-flowing — sheltering income. Rental losses are passive: they offset passive income freely, and up to $25,000/yr can offset ordinary (W-2) income if you actively participate and your MAGI is under $100k (phasing out to $0 by $150k); unused losses carry forward. On sale, claimed depreciation is recaptured at up to 25%, and gains may owe capital-gains tax (a 1031 exchange can defer both). Figures are a year-1 estimate at your 24.0% rate — not tax advice; consult a CPA.
Schools (NCES district)
- District
- Streator Twp Hsd 40
- NCES district ID
- 1738100
- Math proficiency
- 11% ▼ -4.00%
- Reading proficiency
- 19% ▼ -1.00%
- Median HH income
- $43,002
- Composite
- 13.07/100
- National rank
- #9561
- State rank
- #513 of 620 in IL
Livability — Streator
- Score
- 63/100
- State rank
- #752
- US rank
- #15266
Category grades
Schools grade is shown separately in the Schools card above.
Census & demographics
- Census place
- Streator, IL
- County
- La Salle County · 41,676 people
- City population
- 17,963
- Metro
- Ottawa, IL
- Population (ZIP)
- 17,963
- Household income
- $59,060
- Rent vs Own
- Severe rent burden
- 450.0
Population outlook (LaSalle County) Hauer SSP2
- Today (2025)
- 107,080 people
- By 2030
- 104,196 · -2.7%
- By 2040
- 97,413 · -9.0%
- By 2050
- 90,294 · -15.7%
- By 2075
- 76,252 · -28.8%
- By 2100
- 61,339 · -42.7%
Race, ethnicity, and origin ACS 2023
- Neighborhood character
- Predominantly White (83%)
- Race & ethnicity
- White 83% Hispanic / Latino 11% Two or more races 4% Black 3%
- Hispanic origin (detail)
- Mexican 10%
- Common ancestry
- Romanian 3% Lithuanian 2% Slovak 2%
- Foreign-born
- 3% · Canada
- Languages at home
- 93% English-only · Spanish 6%
Political lean MEDSL · LaSalle
- 2024 margin
- R (+18.5) · D 40.1% · R 58.6% · Other 1.3%
- 2008→2024 swing
- -29.6pp toward R · 2008: 11.1pp · 2024: -18.5pp
- All cycles
- 2024: R+18.5 2020: R+14.3 2016: R+14.4 2012: R+0.4 2008: D+11.1
Not yet ingested
- Civics
- —
Market trends
- HPI YoY
- ▼ -105.28%
- Current HPI
- 233.5533
- Rent YoY
- —
- Metro
- Ottawa, IL
- State GDP YoY
- ▲ 1.59%
- F500 in state
- 60
Industry mix (Fortune 500 HQ in IL)
| Industry | F500 HQs | Revenue |
|---|---|---|
| Insurance | 4 | $201B |
|
||
| Consumer Goods | 4 | $87B |
|
||
| Industrial Machinery | 3 | $64B |
|
||
| Healthcare | 2 | $55B |
|
||
| Retail / Pharmacy | 1 | $148B |
|
||
| Agriculture / Food | 1 | $86B |
|
||
Price history
+446.1% since first listed39 events — show timeline
- 2026-03-11 Listing Removed — MRED as Distributed by MLS Grid
- 2026-03-11 Listed $163,828 MRED as Distributed by MLS Grid
- 2026-02-24 Listing Removed — MRED as Distributed by MLS Grid
- 2026-02-24 Listed — MRED as Distributed by MLS Grid
- 2026-02-13 Listed — MRED as Distributed by MLS Grid
- 2025-03-24 Sold (MLS) $145,000 MRED as Distributed by MLS Grid
- 2025-02-21 Contingent — MRED as Distributed by MLS Grid
- 2025-02-04 Listing Removed — MRED as Distributed by MLS Grid
- 2025-01-23 Listing Removed — MRED as Distributed by MLS Grid
- 2025-01-23 Listed $149,900 MRED as Distributed by MLS Grid
- 2024-12-19 Listed — MRED as Distributed by MLS Grid
- 2024-12-18 Listing Removed — MRED as Distributed by MLS Grid
- 2024-12-03 Price Changed — MRED as Distributed by MLS Grid
- 2024-11-01 Listed — MRED as Distributed by MLS Grid
- 2024-04-09 Sold (Public Records) $55,000 Public Records
- 2015-01-30 Sold (MLS) $16,250 MRED as Distributed by MLS Grid
- 2015-01-22 Pending — MRED as Distributed by MLS Grid
- 2015-01-13 Price Changed $18,500 MRED as Distributed by MLS Grid
- 2014-12-12 Price Changed $21,900 MRED as Distributed by MLS Grid
- 2014-11-04 Price Changed $29,900 MRED as Distributed by MLS Grid
- 2014-10-01 Listed $34,900 MRED as Distributed by MLS Grid
- 2013-08-15 Listing Removed — MRED as Distributed by MLS Grid
- 2013-05-07 Price Changed — MRED as Distributed by MLS Grid
- 2012-08-15 Listed — MRED as Distributed by MLS Grid
- 2012-08-07 Listing Removed — MRED as Distributed by MLS Grid
- 2011-11-01 Price Changed — MRED as Distributed by MLS Grid
- 2011-07-12 Price Changed — MRED as Distributed by MLS Grid
- 2011-02-15 Price Changed — MRED as Distributed by MLS Grid
- 2011-01-11 Price Changed — MRED as Distributed by MLS Grid
- 2010-11-19 Price Changed — MRED as Distributed by MLS Grid
- 2010-10-29 Price Changed — MRED as Distributed by MLS Grid
- 2010-09-23 Price Changed — MRED as Distributed by MLS Grid
- 2010-07-20 Listed — MRED as Distributed by MLS Grid
- 2008-09-19 Sold (MLS) $66,000 MRED as Distributed by MLS Grid
- 2008-07-14 Listing Removed — MRED as Distributed by MLS Grid
- 2007-11-26 Listed $70,000 MRED as Distributed by MLS Grid
- 2006-11-13 Sold (Public Records) $30,000 Public Records
- 2004-07-01 Listing Removed — MRED as Distributed by MLS Grid
- 2004-01-01 Listed — MRED as Distributed by MLS Grid
Property tax history
+2.6%/yrLatest (2024): $2,246 · +8.1% YoY. Source: county tax records.
Cash-flow waterfall
monthlySold comps — $/sqft
last 12 mo · ≤1 miLoading sold comps…