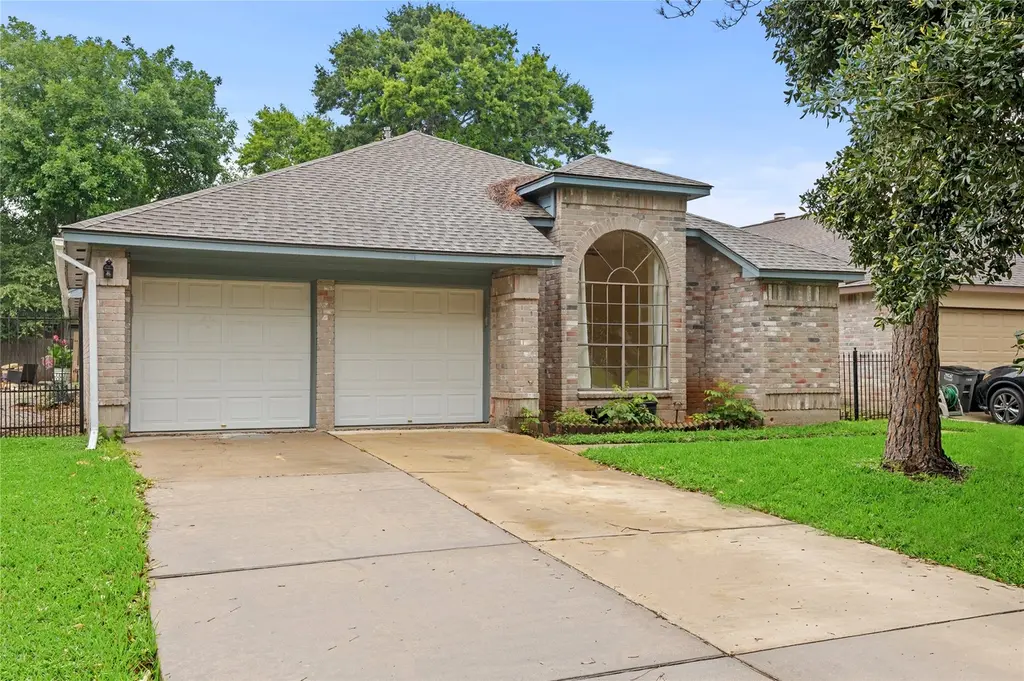
1318 Roundstone Dr · Pecan Grove, TX
Flood risk 6/10 · Moderate
- FEMA flood zone
- X
- Chance of flooding over 30 yrs
- 0.7%
- Est. flood insurance / yr
- $507 – $1,088
Fire risk 1/10 · Minimal
- Est. fire insurance / yr
- $1,222 – $2,270
Heat risk 9/10 · Severe
- Hot days now (above 110°F)
- 7 days/yr
- Hot days in 30 yrs
- 23 days/yr
Wind risk 9/10 · Severe
- Chance of severe wind over 30 yrs
- 99.0%
Air-quality risk 2/10 · Minimal
- Unhealthy air days now
- 1 days/yr
- Unhealthy air days in 30 yrs
- 2 days/yr
Risk factors via First Street. Map © Google.
Why this score? — see what drove the D grade
The composite is a weighted blend of 9 inputs, each scored 0–100. Each bar is that input's sub-score; the figure is the points it added to the 100-point composite (weight × sub-score).
- ARV discount +15.0/15.0
- Cash flow +9.0/30.0
- Schools +4.5/10.0
- Livability +3.6/5.0
- 1% rule +3.0/10.0
- DSCR +2.5/10.0
- Condition / age +2.5/5.0
- Rent growth +2.1/5.0
- Appreciation +0.0/10.0
$279,900
🖨 Deal sheet (PDF) 📄 Offer letter ✓ Due diligence
Listing remarks MLS
READY FOR MOVE IN TO THIS 3 BR 2 BATH 2 GARAGE 1 STORY HOME. BRAND NEW ROOF. BRAND NEW HOT WATER HEATER. FRESH PAINT THROUGH OUT. RESTORED COUNTER TOPS AND KITCHEN CABINETS. HUGE FAMILY ROOM WITH HIGH CEILINGS AND CEILING FANS. MASTER BEDROOM WITH HIGH CEILINGS AND BACKYARD ACCESS. GREAT FLOOR PLAN. UTILITY ROOM IN HOME. FENCED BACK YARD. HUGE GARAGE. MUST SEE TO APPRECIATE.
Key facts
- Master suite
- Cozy fireplace
- En-suite bathroom
Tags
Property features AI
Finance
- Other: Full ownership
- HOA & community: Pecan Grove HOA with an annual fee of $200; Community pool
Exterior
- Parking: Attached garage with 2 parking spaces
- Utilities: Public water; Public sewer
- Home design: Residential property; Built in 1984; Slab foundation; Composition roof; Concrete road access
- Construction: Brick and wood siding construction
- Exterior features: Deck; Patio; Porch; Fully fenced private yard; Fence (back yard); Subdivision setting; Side yard
Interior
- Bedrooms: Total of 5 rooms (includes bedrooms and living spaces)
- Flooring: Carpet; Tile; Wood
- Bathrooms: 2 full bathrooms
- Heating & cooling: Central heating (gas); Central electric air conditioning
- Interior features: High ceilings; One fireplace (living area)
Neighborhood map
What this means for you Summary
Snapshot
- This is a 3-bed/2.0-bath single-family listed at $280k.
Deal economics
- At list price, monthly cash flow is $-222 ($-3k/yr) — negative.
- To cash-flow at today's rent, offer at most $241k (14.0% below list).
- To meet the 1% rule (rent ≥ 1% of price), the offer needs to be $224k (20.0% below list).
- Recommended offer: $224k (20.0% below list) — sets the bar for 1% rule.
- Cap rate 5.3% vs local median 2.2% in Pecan Grove — top-decile yield for the area; either an underpriced asset or a hidden risk that comps aren't pricing in. Stress-test before assuming the spread holds.
Location & tenants
- Location reads 72/100 on livability (#256 in TX) — a middle-class / working-renter tenant base. Strengths: employment A+, housing A+, crime A; Watch: amenities F, commute F, health & safety F.
- Fort Bend ISD (suburban): math 44% / reading 53% proficiency, ranked #140 of 826 in TX (top 17%) — families likely to look elsewhere, expect single-tenant / working-renter base with shorter leases.
- Zoned schools: Pecan Grove El (math 49% / reading 53%, grade C-, #818 of 4,322 statewide, top 19%, 763 students, 33% FRL); James Bowie Middle (math 45% / reading 53%, grade C-, #378 of 1,662 statewide, top 23%, 1,639 students, 41% FRL); Fort Bend Co Alter (26 students, 0% FRL).
- Market conditions: Rents soft (-1.6%/yr); 1238 active listings in the ZIP; 1 comparable units currently listed for rent nearby; high-income renter base; 12,093 units permitted in Fort Bend County in 2024 (815 in 5+ unit buildings).
Forward outlook
- Local home prices are declining (-3.0%/yr); year-one equity from $2k of loan paydown is wiped out by about $8k of value loss. Plan a longer hold.
- Fort Bend County population projected at +75% by 2050 — long-run rental-demand tailwind backs the buy-and-hold thesis.
Negotiation context
- It's been on market 39 days — a 3% lower offer ($272k) is reasonable based on typical stale-listing flexibility.
- 7 sale attempts since 25y ago with the ask held roughly flat each time — persistent listings suggest the price (not the market) is what's stuck; bring a comps-based counter.
Risks & watch-outs
- Climate carrying-cost: major flood risk; severe wind risk, 99% chance of damaging wind over 30y; extreme-heat days projected 7→23/yr by 2055 (HVAC capex compounding) — expect insurance premiums to compound above CPI over the hold.
Questions for the listing agent
- What do current leases actually rent for vs. the listed asking? Can we see a recent rent roll and the last 12 months of T-12 income?
- It's been on market 39 days. Have you received any prior offers? Is the seller open to a 20% concession, seller financing, or rate buy-down credit?
- What does the HOA fee cover, when was the last increase, and are there any pending special assessments or reserve-fund shortfalls?
- Is there a deadline driving the sale (1031 exchange, divorce, estate, relocation)? That informs how much negotiation room exists.
- The area grade is low — what's the realistic commute time and amenity access for the typical tenant pool here? Any planned neighborhood developments (good or bad) we should know about?
- What's the average days-on-market for RENTAL listings here right now (not sales)? A rising rental-DOM trend means longer vacancies and softer asking-rent achievability than the comps imply.
- What's the recent tenant-quality profile in this submarket — average credit score on applications, eviction rate, late-payment / NSF rate, and stable-employment percentage? A property-management company in the area should have these aggregated.
- How much new for-sale + rental construction is in the pipeline within 1–3 miles? Heavy new supply typically softens prices + rents 12–24 months out; constrained supply supports both.
Investment metrics
- 1% rule
- 0.80% ✗
- Cap rate
- 5.34%
- Cash-on-cash
- -3.40%
- DSCR
- 0.85
- GRM
- 10.4
CMA / ARV
- ARV (median comp)
- $337,080
- List price
- $279,900
- Delta
- -16.96%
- Verdict
- UNDERPRICED
- Comps
- 20 within 1.0 mi
Show comp detail 12 sales within ~0.75 mi
| Address | Dist | Beds/Ba | Sqft | Sold | Price | $/sf | Match |
|---|---|---|---|---|---|---|---|
| 1838 Rock Fence Dr | 0.18mi | 3/2.0 | 1,919 (+2%) | 2mo | $220,000 | $115 | 87 |
| 1946 Mayweather Ln | 0.13mi | 4/2.5 (+1) | 2,008 (+7%) | 7mo | $348,000 | $173 | 70 |
| 2006 Carriage Ct | 0.58mi | 3/2.0 | 1,930 (+3%) | 0mo | $340,000 | $176 | 68 |
| 1038 Warm Summer Dr | 0.72mi | 3/2.0 | 1,825 (-3%) | 1mo | $390,000 | $214 | 61 |
| 1303 Carriage Dr | 0.57mi | 3/2.0 | 2,008 (+7%) | 8mo | $365,000 | $182 | 55 |
| 1206 Carriage Dr | 0.57mi | 3/2.0 | 2,000 (+6%) | 9mo | $270,000 | $135 | 55 |
| 2727 Lemongrass Breeze Ln | 0.70mi | 3/2.0 | 2,036 (+8%) | 7mo | $399,900 | $196 | 47 |
| 2739 Lemongrass Breeze Ln | 0.73mi | 3/2.0 | 2,090 (+11%) | 2mo | $399,888 | $191 | 46 |
| 2618 Fresh Basil Ct | 0.66mi | 4/2.0 (+1) | 2,090 (+11%) | 9mo | $425,000 | $203 | 38 |
| 918 Bent Creek Ct | 0.68mi | 4/2.5 (+1) | 2,078 (+11%) | 8mo | $386,500 | $186 | 37 |
| 914 Clover Rise Ct | 0.70mi | 4/2.0 (+1) | 2,105 (+12%) | 9mo | $385,000 | $183 | 35 |
| 2335 Trail Wood Ln | 0.73mi | 3/2.5 | 1,612 (-14%) | 10mo | $250,000 | $155 | 32 |
Match score weights: distance 35% · size 25% · config 20% · recency 20%. Top-matched comps best support the ARV.
Projected returns pro-forma
-3.0% appreciation · 0.0% rent growth · sell at horizon
- IRR
- -25.5%
- Equity multiple
- 0.16×
- Total profit
- $-65,974
- Equity at exit
- $41,734
- IRR
- -35.6%
- Equity multiple
- -0.29×
- Total profit
- $-100,720
- Equity at exit
- $24,201
Cash invested: $78,372 (down + closing). Projections, not guarantees.
Landlord ↔ Tenant lean methodology
- Overall (STATE)
- 87 Strongly Landlord-Friendly
- State Texas
- 87 Strongly Landlord-Friendly · R+5
- County
- — inherits STATE
- City
- — inherits STATE
ZIP-level market 77406
- Home prices YoY
- -26.2%
- Rents YoY
- -1.6%
- Active inventory
- 1238
- Price-to-rent
- 10.4×
Monthly cashflow live
- Estimated rent
- $2,239 medium interval (Pro) →
- Mortgage (P&I)
- −$1,468
- Tax from tax record
- −$389 /mo · $4,671/yr
- Insurance
- −$117
- HOA
- −$17
- Vacancy / Maint / Mgmt
- −$470
- Net cashflow
- $-222
Break-even live
Sensitivity live
| Price | -10% $-63 | -5% $-143 | +0% $-222 | +5% $-301 | +10% $-380 |
|---|---|---|---|---|---|
| Rent | -10% $-399 | -5% $-310 | +0% $-222 | +5% $-133 | +10% $-45 |
| Rate | -1.0pp $-81 | -0.5pp $-151 | base $-222 | +0.5pp $-294 | +1.0pp $-368 |
UW: 25.0% down · 7.5% · 30yr · 1.5% tax · 5.0% vac · 8.0% maint · 8.0% mgmt
Financing live
Cash to close
- Down payment
- $69,975
- Closing costs
- $8,397
- Reserves months
- —
- Total cash needed
- —
Loan-product check · same deal, 3 products live
Conventional
25% down · 7.5% · 30yr
- Down + closing
- —
- Monthly P&I
- —
- Monthly cashflow
- —
- DSCR
- —
- Eligible?
- —
Personal DTI + credit; lowest rate.
DSCR
20% down · 8.5% · 30yr
- Down + closing
- —
- Monthly P&I
- —
- Monthly cashflow
- —
- DSCR
- —
- Eligible?
- —
No personal income docs; deal must DSCR.
Hard money
10% down · 12.0% · 12mo
- Down + closing
- —
- Monthly P&I
- —
- Monthly cashflow
- —
- DSCR
- —
- Eligible?
- —
Short-term bridge; refi at stabilization.
Rent comps 1 comps
| Address | Beds | Baths | Sqft | Rent | $/sqft | DOM | Units | Dist |
|---|---|---|---|---|---|---|---|---|
| 707 Land Grant Dr Richmond, TX | 4.0 | 2.0 | 1994 | $2,595 | $1.30 | 45d | 1 | 0.94mi |
HOA detail
- Monthly dues
- $17 · $204/yr
- Likely covers
- water
Listing history 37 events
-
2026-06-21days on market $279,900 Active 39 DOM
-
2026-06-18days on market $279,900 Active 36 DOM
-
2026-06-17days on market $279,900 Active 35 DOM
-
2026-06-16days on market $279,900 Active 34 DOM
-
2026-06-15days on market $279,900 Active 33 DOM
-
2026-06-13pricedays on market $279,900 Active 31 DOM
-
2026-06-09days on market $284,990 Active 27 DOM
-
2026-06-08days on market $284,990 Active 26 DOM
-
2026-06-07days on market $284,990 Active 25 DOM
-
2026-06-04days on market $284,990 Active 22 DOM
-
2026-06-03days on market $284,990 Active 21 DOM
-
2026-06-02days on market $284,990 Active 20 DOM
-
2026-06-01days on market $284,990 Active 19 DOM
-
2026-05-31days on market $284,990 Active 18 DOM
-
2026-05-13$284,990 Active 554-char remark
-
2026-04-27historical
-
2026-02-05price $285,000
-
2026-01-16$300,000 Active
-
2020-10-13soldstatus Sold
Show marketing remark (377 chars)
READY FOR MOVE IN TO THIS 3 BR 2 BATH 2 GARAGE 1 STORY HOME. BRAND NEW ROOF. BRAND NEW HOT WATER HEATER. FRESH PAINT THROUGH OUT. RESTORED COUNTER TOPS AND KITCHEN CABINETS. HUGE FAMILY ROOM WITH HIGH CEILINGS AND CEILING FANS. MASTER BEDROOM WITH HIGH CEILINGS AND BACKYARD ACCESS. GREAT FLOOR PLAN. UTILITY ROOM IN HOME. FENCED BACK YARD. HUGE GARAGE. MUST SEE TO APPRECIATE.
-
2020-10-13soldstatus
Show marketing remark (377 chars)
READY FOR MOVE IN TO THIS 3 BR 2 BATH 2 GARAGE 1 STORY HOME. BRAND NEW ROOF. BRAND NEW HOT WATER HEATER. FRESH PAINT THROUGH OUT. RESTORED COUNTER TOPS AND KITCHEN CABINETS. HUGE FAMILY ROOM WITH HIGH CEILINGS AND CEILING FANS. MASTER BEDROOM WITH HIGH CEILINGS AND BACKYARD ACCESS. GREAT FLOOR PLAN. UTILITY ROOM IN HOME. FENCED BACK YARD. HUGE GARAGE. MUST SEE TO APPRECIATE.
-
2020-09-16status Pending
Show marketing remark (377 chars)
READY FOR MOVE IN TO THIS 3 BR 2 BATH 2 GARAGE 1 STORY HOME. BRAND NEW ROOF. BRAND NEW HOT WATER HEATER. FRESH PAINT THROUGH OUT. RESTORED COUNTER TOPS AND KITCHEN CABINETS. HUGE FAMILY ROOM WITH HIGH CEILINGS AND CEILING FANS. MASTER BEDROOM WITH HIGH CEILINGS AND BACKYARD ACCESS. GREAT FLOOR PLAN. UTILITY ROOM IN HOME. FENCED BACK YARD. HUGE GARAGE. MUST SEE TO APPRECIATE.
-
2020-09-08status Option Pending
Show marketing remark (377 chars)
READY FOR MOVE IN TO THIS 3 BR 2 BATH 2 GARAGE 1 STORY HOME. BRAND NEW ROOF. BRAND NEW HOT WATER HEATER. FRESH PAINT THROUGH OUT. RESTORED COUNTER TOPS AND KITCHEN CABINETS. HUGE FAMILY ROOM WITH HIGH CEILINGS AND CEILING FANS. MASTER BEDROOM WITH HIGH CEILINGS AND BACKYARD ACCESS. GREAT FLOOR PLAN. UTILITY ROOM IN HOME. FENCED BACK YARD. HUGE GARAGE. MUST SEE TO APPRECIATE.
-
2020-08-10price $209,000
Show marketing remark (377 chars)
READY FOR MOVE IN TO THIS 3 BR 2 BATH 2 GARAGE 1 STORY HOME. BRAND NEW ROOF. BRAND NEW HOT WATER HEATER. FRESH PAINT THROUGH OUT. RESTORED COUNTER TOPS AND KITCHEN CABINETS. HUGE FAMILY ROOM WITH HIGH CEILINGS AND CEILING FANS. MASTER BEDROOM WITH HIGH CEILINGS AND BACKYARD ACCESS. GREAT FLOOR PLAN. UTILITY ROOM IN HOME. FENCED BACK YARD. HUGE GARAGE. MUST SEE TO APPRECIATE.
-
2020-07-23price $219,000
Show marketing remark (377 chars)
READY FOR MOVE IN TO THIS 3 BR 2 BATH 2 GARAGE 1 STORY HOME. BRAND NEW ROOF. BRAND NEW HOT WATER HEATER. FRESH PAINT THROUGH OUT. RESTORED COUNTER TOPS AND KITCHEN CABINETS. HUGE FAMILY ROOM WITH HIGH CEILINGS AND CEILING FANS. MASTER BEDROOM WITH HIGH CEILINGS AND BACKYARD ACCESS. GREAT FLOOR PLAN. UTILITY ROOM IN HOME. FENCED BACK YARD. HUGE GARAGE. MUST SEE TO APPRECIATE.
-
2020-07-03$229,000 Active
Show marketing remark (377 chars)
READY FOR MOVE IN TO THIS 3 BR 2 BATH 2 GARAGE 1 STORY HOME. BRAND NEW ROOF. BRAND NEW HOT WATER HEATER. FRESH PAINT THROUGH OUT. RESTORED COUNTER TOPS AND KITCHEN CABINETS. HUGE FAMILY ROOM WITH HIGH CEILINGS AND CEILING FANS. MASTER BEDROOM WITH HIGH CEILINGS AND BACKYARD ACCESS. GREAT FLOOR PLAN. UTILITY ROOM IN HOME. FENCED BACK YARD. HUGE GARAGE. MUST SEE TO APPRECIATE.
-
2020-06-30historical
-
2020-05-02status Active
-
2020-02-13status Pending
-
2020-02-06status Option Pending
-
2020-02-05price $232,000
-
2020-02-05price $235,000
-
2020-02-05historical
-
2019-12-05$209,000 Active
-
2002-12-06historical
-
2002-06-06$129,500
-
2001-03-15historical
-
2001-02-01$120,000
ⓘ Source: listings_history table (triggers on properties + properties_extension) + one-shot
backfill from property_details.listing_events for pre-trigger history.
Tax reassessment forecast TX · Resets to sale price
- Current annual tax
- $4,671 · $389/mo
- Projected year-2 tax
- $5,122 · $427/mo
- Expected delta
- +$451/yr (+$38/mo · 9.6%)
ⓘ Screening estimate from a state-policy table — verify with the county assessor before closing.
Climate risk First Street
- Flood 6/10 Major FEMA zone X · 70% chance over 30 yrs
- Wildfire 1/10 Low
- Heat 9/10 Extreme 7 d/yr ≥110°F today · 23 d/yr by 30 yrs out
- Wind 9/10 Extreme 99% chance of damaging wind over 30 yrs
- Air quality 2/10 Low 1 unhealthy d/yr today · 2 by 30 yrs out
Nearby sold comps map
Loading sold comps map…
Walkable amenities ~0.75 mi
Loading nearby amenities…
Taxation est. · year 1
- Rental income
- $26,870
- − Mortgage interest
- −$15,679
- − Property taxes
- −$4,671
- − Insurance
- −$1,400
- − Repairs & maintenance
- −$2,150
- − Management
- −$2,150
- − HOA
- −$204
- − Depreciation
- −$8,143
- Taxable loss
- −$7,525
- Est. tax savings @ 24.0%
- +$1,806
- After-tax cash flow
- $-855/yr
For passive investors: Depreciation is non-cash, so a rental often shows a tax loss while cash-flowing — sheltering income. Rental losses are passive: they offset passive income freely, and up to $25,000/yr can offset ordinary (W-2) income if you actively participate and your MAGI is under $100k (phasing out to $0 by $150k); unused losses carry forward. On sale, claimed depreciation is recaptured at up to 25%, and gains may owe capital-gains tax (a 1031 exchange can defer both). Figures are a year-1 estimate at your 24.0% rate — not tax advice; consult a CPA.
Schools (NCES district)
- District
- Fort Bend ISD
- NCES district ID
- 4819650
- Math proficiency
- 44% ▼ -15.00%
- Reading proficiency
- 53% ▼ -4.00%
- Median HH income
- $82,360
- Composite
- 44.61/100
- National rank
- #2779
- State rank
- #140 of 826 in TX
Livability — Pecan Grove
- Score
- 72/100
- State rank
- #256
- US rank
- #6017
Category grades
Schools grade is shown separately in the Schools card above.
Census & demographics
- Census place
- Pecan Grove, TX
- County
- Fort Bend County · 836,777 people
- Metro
- Houston-The Woodlands-Sugar Land, TX
- Population (ZIP)
- 69,918
- Household income
- $141,869
- Rent vs Own
- Severe rent burden
- 575.0
Population outlook (Fort Bend County) Hauer SSP2
- Today (2025)
- 1,004,526 people
- By 2030
- 1,153,104 · +14.8%
- By 2040
- 1,453,718 · +44.7%
- By 2050
- 1,753,781 · +74.6%
- By 2075
- 2,455,772 · +144.5%
- By 2100
- 2,930,528 · +191.7%
Race, ethnicity, and origin ACS 2023
- Neighborhood character
- Highly diverse neighborhood (Simpson 0.72)
- Race & ethnicity
- White 43% Hispanic / Latino 26% Two or more races 15% Black 14% Asian 12%
- Hispanic origin (detail)
- Mexican 18% Puerto Rican 1%
- Common ancestry
- Lithuanian 2% Romanian 1% Iranian 1%
- Foreign-born
- 17% · Canada, Vietnam, China
- Languages at home
- 73% English-only · Spanish 14% Other Indo-European 3% Vietnamese 2%
Political lean MEDSL · Fort Bend
- 2024 margin
- Toss-up / Even · D 49.5% · R 47.9% · Other 2.6%
- 2008→2024 swing
- +4.0pp toward D · 2008: -2.4pp · 2024: 1.6pp
- All cycles
- 2024: D+1.6 2020: D+10.6 2016: D+6.6 2012: R+6.8 2008: R+2.4
Not yet ingested
- Civics
- —
Market trends
- HPI YoY
- ▼ -79.18%
- Current HPI
- 222.9525
- Rent YoY
- ▼ -1.61%
- Metro
- Houston-The Woodlands-Sugar Land, TX
- State GDP YoY
- ▲ 3.95%
- F500 in state
- 110
Industry mix (Fortune 500 HQ in TX)
| Industry | F500 HQs | Revenue |
|---|---|---|
| Energy | 16 | $1,198B |
|
||
| Technology | 5 | $198B |
|
||
| Engineering / Construction | 4 | $72B |
|
||
| Energy Services | 3 | $60B |
|
||
| Utilities | 3 | $41B |
|
||
| Healthcare | 2 | $330B |
|
||
Price history
+133.2% since first listed24 events — show timeline
- 2026-06-12 Price Changed $279,900 HARMLS
- 2026-05-13 Listed $284,990 HARMLS
- 2026-04-27 Listing Removed — HARMLS
- 2026-02-05 Price Changed $285,000 HARMLS
- 2026-01-16 Listed $300,000 HARMLS
- 2020-10-13 Sold (Public Records) — Public Records
- 2020-10-13 Sold (MLS) — HARMLS
- 2020-09-16 Pending — HARMLS
- 2020-09-08 Pending — HARMLS
- 2020-08-10 Price Changed $209,000 HARMLS
- 2020-07-23 Price Changed $219,000 HARMLS
- 2020-07-03 Listed $229,000 HARMLS
- 2020-06-30 Listing Removed — HARMLS
- 2020-05-02 Relisted — HARMLS
- 2020-02-13 Pending — HARMLS
- 2020-02-06 Pending — HARMLS
- 2020-02-05 Listing Removed — HARMLS
- 2020-02-05 Price Changed $232,000 HARMLS
- 2020-02-05 Price Changed $235,000 HARMLS
- 2019-12-05 Listed $209,000 HARMLS
- 2002-12-06 Listing Removed — HARMLS
- 2002-06-06 Listed $129,500 HARMLS
- 2001-03-15 Listing Removed — HARMLS
- 2001-02-01 Listed $120,000 HARMLS
Property tax history
+2.3%/yrLatest (2025): $4,671 · +6.3% YoY. Source: county tax records.
Cash-flow waterfall
monthlySold comps — $/sqft
last 12 mo · ≤1 miLoading sold comps…