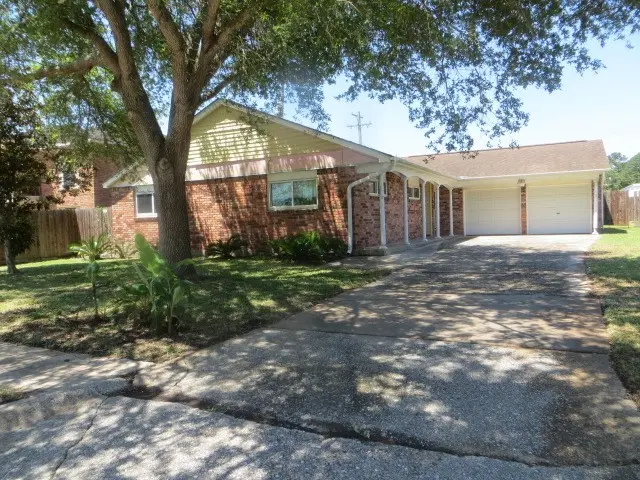
1602 Bellaire Blvd · Alvin, TX
Flood risk 8/10 · Major
- FEMA flood zone
- AE
- Chance of flooding over 30 yrs
- 0.99%
- Est. flood insurance / yr
- $1,737 – $8,500
Fire risk 3/10 · Minor
- Est. fire insurance / yr
- $1,222 – $2,270
Heat risk 9/10 · Severe
- Hot days now (above 108°F)
- 7 days/yr
- Hot days in 30 yrs
- 25 days/yr
Wind risk 9/10 · Severe
- Chance of severe wind over 30 yrs
- 99.0%
Air-quality risk 2/10 · Minimal
- Unhealthy air days now
- 1 days/yr
- Unhealthy air days in 30 yrs
- 1 days/yr
Risk factors via First Street. Map © Google.
Why this score? — see what drove the C grade
The composite is a weighted blend of 9 inputs, each scored 0–100. Each bar is that input's sub-score; the figure is the points it added to the 100-point composite (weight × sub-score).
- Cash flow +18.6/30.0
- ARV discount +15.0/15.0
- 1% rule +7.7/10.0
- DSCR +5.9/10.0
- Schools +3.9/10.0
- Livability +3.2/5.0
- Rent growth +3.0/5.0
- Condition / age +2.5/5.0
- Appreciation +0.0/10.0
$158,900
🖨 Deal sheet (PDF) 📄 Offer letter ✓ Due diligence
Listing remarks MLS
REALLY NICE BRICK HOME 4/2/2 IN DESIRABLE LOCATION OF ALVIN. DID NOT FLOOD!! FORMAL DINING ROOM. NEW FLOORS, RECENT PAINT. TRIPLE-PANED WINDOWS (POP-OUT) FOR EXTRA EFFICIENCY. ROOF, FENCE, HOT WATER HEATER 3 YEARS OLD. NICE PLAYHOUSE FOR KIDS IN THE BACKYARD. ALL APPLIANCES STAY. MUST SEE THIS ONE TO APPRECIATE.
Key facts
- Outdoor entertaining
- Large backyard
- Covered patio
Tags
Property features AI
Finance
- Financial info: Lease not considered
Exterior
- Parking: Attached garage; 2 garage spaces
- Utilities: Public water; Public sewer
- Home design: Residential property; Built in 1962; Slab foundation
- Construction: Brick, vinyl siding and wood siding exterior; Composition roof
- Exterior features: Covered patio; Patio; Deck; Fenced backyard; Located in a subdivision
Interior
- Kitchen: Dishwasher; Electric cooktop; Electric oven; Refrigerator
- Flooring: Concrete; Plank; Vinyl
- Bathrooms: 2 full bathrooms
- Heating & cooling: Central heating (gas); Central electric air conditioning
- Interior features: Breakfast bar; Tub with shower; Ceiling fans
- Laundry & utility: Washer hookup; Electric dryer hookup
Neighborhood map
What this means for you Summary
Snapshot
- This is a 4-bed/2.0-bath single-family listed at $159k.
Deal economics
- At list price, monthly cash flow is $-271 ($-3k/yr) — negative.
- To cash-flow at today's rent, offer at most $129k (18.9% below list).
- Meets the 1% rule at list price ($2k rent vs $159k).
- Recommended offer: $129k (18.9% below list) — sets the bar for cash-flow.
- Cap rate 7.5% vs local median 2.7% in Alvin — top-decile yield for the area; either an underpriced asset or a hidden risk that comps aren't pricing in. Stress-test before assuming the spread holds.
Location & tenants
- Location reads 65/100 on livability (#704 in TX) — a middle-class / working-renter tenant base. Strengths: cost of living A+, housing A+; Watch: amenities F, commute F, health & safety F.
- Alvin ISD (suburban): math 39% / reading 48% proficiency, ranked #255 of 826 in TX (top 31%) — families likely to look elsewhere, expect single-tenant / working-renter base with shorter leases.
- Zoned schools: Alvin H S (math 35% / reading 48%, grade F, #767 of 1,632 statewide, top 47%, 2,821 students, 65% FRL) — zoned schools average 65% FRL vs 48% district-wide (16 pts higher); higher-poverty schools than district average — tighter screening recommended.
- Market conditions: Rents rising (+1.9%/yr); 599 active listings in the ZIP; 1 comparable units currently listed for rent nearby; 3,960 units permitted in Brazoria County in 2024 (593 in 5+ unit buildings).
- This rent runs 32% of the median local income ($75k/yr) — at the standard rent-burdened threshold; future hikes will face affordability resistance.
Forward outlook
- Local home prices are declining (-3.0%/yr); year-one equity from $1k of loan paydown is wiped out by about $5k of value loss. Plan a longer hold.
- Brazoria County population projected at +44% by 2050 — long-run rental-demand tailwind backs the buy-and-hold thesis.
Negotiation context
- It's been on market 21 days — a 2% lower offer ($157k) is reasonable based on typical stale-listing flexibility.
- 9 sale attempts since 12y ago with the ask held roughly flat each time — persistent listings suggest the price (not the market) is what's stuck; bring a comps-based counter.
Risks & watch-outs
- Watch-outs: property tax is 4.1% of price; flood insurance adds $427/mo.
- Climate carrying-cost: in FEMA flood zone AE (mandatory federal flood insurance); severe wind risk, 99% chance of damaging wind over 30y; extreme-heat days projected 7→25/yr by 2055 (HVAC capex compounding) — expect insurance premiums to compound above CPI over the hold.
Questions for the listing agent
- What do current leases actually rent for vs. the listed asking? Can we see a recent rent roll and the last 12 months of T-12 income?
- Built in 1962 — when were the roof, HVAC, electrical panel, plumbing, and water heater last replaced?
- Property tax is high relative to price — has the assessment been appealed recently, and will the sale trigger a re-assessment?
- What's the actual annual flood-insurance premium (NFIP or private), and is the property in a SFHA with mandatory coverage?
- Is there a deadline driving the sale (1031 exchange, divorce, estate, relocation)? That informs how much negotiation room exists.
- Schools are D-rated, which usually means shorter tenancies and higher turnover. Who's the typical renter profile here, and what's been the actual vacancy rate?
- What's the average days-on-market for RENTAL listings here right now (not sales)? A rising rental-DOM trend means longer vacancies and softer asking-rent achievability than the comps imply.
- What's the recent tenant-quality profile in this submarket — average credit score on applications, eviction rate, late-payment / NSF rate, and stable-employment percentage? A property-management company in the area should have these aggregated.
- How much new for-sale + rental construction is in the pipeline within 1–3 miles? Heavy new supply typically softens prices + rents 12–24 months out; constrained supply supports both.
Investment metrics
- 1% rule
- 1.27% ✓
- Cap rate
- 7.47%
- Cash-on-cash
- 4.20%
- DSCR
- 1.19
- GRM
- 6.6
CMA / ARV
- ARV (median comp)
- $259,158
- List price
- $158,900
- Delta
- -38.69%
- Verdict
- UNDERPRICED
- Comps
- 20 within 1.0 mi
Show comp detail 12 sales within ~0.75 mi
| Address | Dist | Beds/Ba | Sqft | Sold | Price | $/sf | Match |
|---|---|---|---|---|---|---|---|
| 717 Briargrove Dr | 0.19mi | 4/2.0 | 1,766 (0%) | 8mo | $199,900 | $113 | 84 |
| 1709 Perch St | 0.68mi | 4/2.0 | 1,748 (-1%) | 10mo | $310,000 | $177 | 58 |
| 1050 Great Barracuda | 0.44mi | 4/2.5 | 1,831 (+4%) | 18mo | $324,990 | $177 | 56 |
| 2701 Mustang Rd | 0.67mi | 4/2.0 | 1,892 (+7%) | 3mo | $279,900 | $148 | 54 |
| 643 E Fairway Lake Dr | 0.64mi | 3/2.0 (-1) | 1,723 (-2%) | 11mo | $275,000 | $160 | 52 |
| 1822 Meadowview Dr | 0.63mi | 3/2.0 (-1) | 1,670 (-5%) | 8mo | $239,900 | $144 | 50 |
| 1056 Marina Bay Dr | 0.46mi | 3/2.0 (-1) | 1,575 (-11%) | 16mo | $299,990 | $190 | 42 |
| 217 E Southland Ave | 0.46mi | 3/2.0 (-1) | 1,502 (-15%) | 10mo | $309,900 | $206 | 40 |
| 1014 Bluegill Ln | 0.75mi | 5/2.5 (+1) | 1,892 (+7%) | 7mo | $278,990 | $147 | 40 |
| 817 Circle Way | 0.67mi | 3/1.5 (-1) | 1,554 (-12%) | 3mo | $234,000 | $151 | 39 |
| 1742 Glenview Dr | 0.58mi | 3/2.0 (-1) | 1,512 (-14%) | 9mo | $249,900 | $165 | 36 |
| 914 S Hill St | 0.74mi | 3/1.5 (-1) | 1,523 (-14%) | 2mo | $190,000 | $125 | 34 |
Match score weights: distance 35% · size 25% · config 20% · recency 20%. Top-matched comps best support the ARV.
Projected returns pro-forma
-3.0% appreciation · 1.87% rent growth · sell at horizon
- IRR
- -30.9%
- Equity multiple
- -0.01×
- Total profit
- $-44,772
- Equity at exit
- $23,693
- IRR
- -44.1%
- Equity multiple
- -0.53×
- Total profit
- $-68,264
- Equity at exit
- $13,739
Cash invested: $44,492 (down + closing). Projections, not guarantees.
Landlord ↔ Tenant lean methodology
- Overall (STATE)
- 87 Strongly Landlord-Friendly
- State Texas
- 87 Strongly Landlord-Friendly · R+5
- County
- — inherits STATE
- City
- — inherits STATE
ZIP-level market 77511
- Home prices YoY
- -18.6%
- Rents YoY
- 1.9%
- Active inventory
- 599
- Price-to-rent
- 6.6×
Monthly cashflow live
- Estimated rent
- $2,015 medium interval (Pro) →
- Mortgage (P&I)
- −$833
- Tax from tax record
- −$537 /mo · $6,443/yr
- Insurance
- −$66
- Flood insurance flood zone
- −$427 /mo · $5,118/yr
- HOA
- −$0
- Vacancy / Maint / Mgmt
- −$423
- Net cashflow
- $-271
Break-even live
Sensitivity live
| Price | -10% $-181 | -5% $-226 | +0% $-271 | +5% $-316 | +10% $-361 |
|---|---|---|---|---|---|
| Rent | -10% $-430 | -5% $-351 | +0% $-271 | +5% $-191 | +10% $-112 |
| Rate | -1.0pp $-191 | -0.5pp $-231 | base $-271 | +0.5pp $-312 | +1.0pp $-354 |
UW: 25.0% down · 7.5% · 30yr · 1.5% tax · 5.0% vac · 8.0% maint · 8.0% mgmt
Financing live
Cash to close
- Down payment
- $39,725
- Closing costs
- $4,767
- Reserves months
- —
- Total cash needed
- —
Loan-product check · same deal, 3 products live
Conventional
25% down · 7.5% · 30yr
- Down + closing
- —
- Monthly P&I
- —
- Monthly cashflow
- —
- DSCR
- —
- Eligible?
- —
Personal DTI + credit; lowest rate.
DSCR
20% down · 8.5% · 30yr
- Down + closing
- —
- Monthly P&I
- —
- Monthly cashflow
- —
- DSCR
- —
- Eligible?
- —
No personal income docs; deal must DSCR.
Hard money
10% down · 12.0% · 12mo
- Down + closing
- —
- Monthly P&I
- —
- Monthly cashflow
- —
- DSCR
- —
- Eligible?
- —
Short-term bridge; refi at stabilization.
Rent comps 1 comps
| Address | Beds | Baths | Sqft | Rent | $/sqft | DOM | Units | Dist |
|---|---|---|---|---|---|---|---|---|
| 1305 Pinto Pass Alvin, TX | 4.0 | 2.5 | 2131 | $2,400 | $1.13 | 45d | 1 | 1.29mi |
Listing history 33 events
-
2026-05-07$158,900 Active 375-char remark
-
2025-02-05historical
-
2024-11-08status Active
-
2024-11-08status Pending
-
2024-10-19status Pending
-
2024-10-14status Option Pending
-
2024-10-12historical
-
2024-04-17price $189,900
-
2024-04-12status Active
-
2024-04-04status Pending
-
2024-03-01price $182,000
-
2024-03-01status Active
-
2024-02-28status Pending
-
2024-02-16status Option Pending
-
2024-02-16$175,000 Active
-
2024-02-06historical
-
2018-12-17soldstatus Sold
Show marketing remark (313 chars)
REALLY NICE BRICK HOME 4/2/2 IN DESIRABLE LOCATION OF ALVIN. DID NOT FLOOD!! FORMAL DINING ROOM. NEW FLOORS, RECENT PAINT. TRIPLE-PANED WINDOWS (POP-OUT) FOR EXTRA EFFICIENCY. ROOF, FENCE, HOT WATER HEATER 3 YEARS OLD. NICE PLAYHOUSE FOR KIDS IN THE BACKYARD. ALL APPLIANCES STAY. MUST SEE THIS ONE TO APPRECIATE.
-
2018-12-17soldstatus
Show marketing remark (313 chars)
REALLY NICE BRICK HOME 4/2/2 IN DESIRABLE LOCATION OF ALVIN. DID NOT FLOOD!! FORMAL DINING ROOM. NEW FLOORS, RECENT PAINT. TRIPLE-PANED WINDOWS (POP-OUT) FOR EXTRA EFFICIENCY. ROOF, FENCE, HOT WATER HEATER 3 YEARS OLD. NICE PLAYHOUSE FOR KIDS IN THE BACKYARD. ALL APPLIANCES STAY. MUST SEE THIS ONE TO APPRECIATE.
-
2018-11-20status Pending
Show marketing remark (313 chars)
REALLY NICE BRICK HOME 4/2/2 IN DESIRABLE LOCATION OF ALVIN. DID NOT FLOOD!! FORMAL DINING ROOM. NEW FLOORS, RECENT PAINT. TRIPLE-PANED WINDOWS (POP-OUT) FOR EXTRA EFFICIENCY. ROOF, FENCE, HOT WATER HEATER 3 YEARS OLD. NICE PLAYHOUSE FOR KIDS IN THE BACKYARD. ALL APPLIANCES STAY. MUST SEE THIS ONE TO APPRECIATE.
-
2018-11-09status Option Pending
Show marketing remark (313 chars)
REALLY NICE BRICK HOME 4/2/2 IN DESIRABLE LOCATION OF ALVIN. DID NOT FLOOD!! FORMAL DINING ROOM. NEW FLOORS, RECENT PAINT. TRIPLE-PANED WINDOWS (POP-OUT) FOR EXTRA EFFICIENCY. ROOF, FENCE, HOT WATER HEATER 3 YEARS OLD. NICE PLAYHOUSE FOR KIDS IN THE BACKYARD. ALL APPLIANCES STAY. MUST SEE THIS ONE TO APPRECIATE.
-
2018-11-01status Active
Show marketing remark (313 chars)
REALLY NICE BRICK HOME 4/2/2 IN DESIRABLE LOCATION OF ALVIN. DID NOT FLOOD!! FORMAL DINING ROOM. NEW FLOORS, RECENT PAINT. TRIPLE-PANED WINDOWS (POP-OUT) FOR EXTRA EFFICIENCY. ROOF, FENCE, HOT WATER HEATER 3 YEARS OLD. NICE PLAYHOUSE FOR KIDS IN THE BACKYARD. ALL APPLIANCES STAY. MUST SEE THIS ONE TO APPRECIATE.
-
2018-10-25status Option Pending
Show marketing remark (313 chars)
REALLY NICE BRICK HOME 4/2/2 IN DESIRABLE LOCATION OF ALVIN. DID NOT FLOOD!! FORMAL DINING ROOM. NEW FLOORS, RECENT PAINT. TRIPLE-PANED WINDOWS (POP-OUT) FOR EXTRA EFFICIENCY. ROOF, FENCE, HOT WATER HEATER 3 YEARS OLD. NICE PLAYHOUSE FOR KIDS IN THE BACKYARD. ALL APPLIANCES STAY. MUST SEE THIS ONE TO APPRECIATE.
-
2018-10-16$159,900 Active
Show marketing remark (313 chars)
REALLY NICE BRICK HOME 4/2/2 IN DESIRABLE LOCATION OF ALVIN. DID NOT FLOOD!! FORMAL DINING ROOM. NEW FLOORS, RECENT PAINT. TRIPLE-PANED WINDOWS (POP-OUT) FOR EXTRA EFFICIENCY. ROOF, FENCE, HOT WATER HEATER 3 YEARS OLD. NICE PLAYHOUSE FOR KIDS IN THE BACKYARD. ALL APPLIANCES STAY. MUST SEE THIS ONE TO APPRECIATE.
-
2014-11-26soldstatus
-
2014-11-25soldstatus Sold
-
2014-11-10status Pending, Continue to Show
-
2014-10-31status Option Pending
-
2014-10-15price $129,995
-
2014-10-01status Active
-
2014-09-26status Pending, Continue to Show
-
2014-09-14status Option Pending
-
2014-09-07price $132,500
-
2014-07-25$135,000 Active
ⓘ Source: listings_history table (triggers on properties + properties_extension) + one-shot
backfill from property_details.listing_events for pre-trigger history.
Tax reassessment forecast TX · Resets to sale price
- Current annual tax
- $6,443 · $537/mo
- Projected year-2 tax
- $6,443 · $537/mo
- Expected delta
- $0/yr ($0/mo · 0.0%)
ⓘ Screening estimate from a state-policy table — verify with the county assessor before closing.
Climate risk First Street
- Flood 8/10 Severe FEMA zone AE · 99% chance over 30 yrs
- Wildfire 3/10 Moderate
- Heat 9/10 Extreme 7 d/yr ≥108°F today · 25 d/yr by 30 yrs out
- Wind 9/10 Extreme 99% chance of damaging wind over 30 yrs
- Air quality 2/10 Low 1 unhealthy d/yr today · 1 by 30 yrs out
Nearby sold comps map
Loading sold comps map…
Walkable amenities ~0.75 mi
Loading nearby amenities…
Taxation est. · year 1
- Rental income
- $24,182
- − Mortgage interest
- −$8,901
- − Property taxes
- −$6,443
- − Insurance
- −$5,913
- − Repairs & maintenance
- −$1,935
- − Management
- −$1,935
- − Depreciation
- −$4,623
- Taxable loss
- −$5,566
- Est. tax savings @ 24.0%
- +$1,336
- After-tax cash flow
- $-1,916/yr
For passive investors: Depreciation is non-cash, so a rental often shows a tax loss while cash-flowing — sheltering income. Rental losses are passive: they offset passive income freely, and up to $25,000/yr can offset ordinary (W-2) income if you actively participate and your MAGI is under $100k (phasing out to $0 by $150k); unused losses carry forward. On sale, claimed depreciation is recaptured at up to 25%, and gains may owe capital-gains tax (a 1031 exchange can defer both). Figures are a year-1 estimate at your 24.0% rate — not tax advice; consult a CPA.
Schools (NCES district)
- District
- Alvin ISD
- NCES district ID
- 4808090
- Math proficiency
- 39% ▼ -11.00%
- Reading proficiency
- 48% ▬ 0.00%
- Median HH income
- $66,740
- Composite
- 38.96/100
- National rank
- #4080
- State rank
- #255 of 826 in TX
Livability — Alvin
- Score
- 65/100
- State rank
- #704
- US rank
- #13148
Category grades
Schools grade is shown separately in the Schools card above.
Census & demographics
- Census place
- Alvin, TX
- County
- Brazoria County · 374,982 people
- City population
- 51,892
- Metro
- Houston-The Woodlands-Sugar Land, TX
- Population (ZIP)
- 51,892
- Household income
- $74,939
- Rent vs Own
- Severe rent burden
- 923.0
Population outlook (Brazoria County) Hauer SSP2
- Today (2025)
- 420,414 people
- By 2030
- 457,585 · +8.8%
- By 2040
- 532,232 · +26.6%
- By 2050
- 605,399 · +44.0%
- By 2075
- 779,358 · +85.4%
- By 2100
- 883,759 · +110.2%
Race, ethnicity, and origin ACS 2023
- Neighborhood character
- Diverse neighborhood (Simpson 0.58)
- Race & ethnicity
- White 50% Hispanic / Latino 41% Two or more races 21% Black 5% Asian 1%
- Hispanic origin (detail)
- Mexican 34%
- Common ancestry
- Lithuanian 3% Italian 2% Iranian 1%
- Foreign-born
- 13% · Canada, China, Jamaica
- Languages at home
- 71% English-only · Spanish 27% Other Asian/Pacific 1%
Political lean MEDSL · Brazoria
- 2024 margin
- R (+19.7) · D 39.5% · R 59.2% · Other 1.3%
- 2008→2024 swing
- +9.9pp toward D · 2008: -29.6pp · 2024: -19.7pp
- All cycles
- 2024: R+19.7 2020: R+18.2 2016: R+24.6 2012: R+34.2 2008: R+29.6
Not yet ingested
- Civics
- —
Market trends
- HPI YoY
- ▼ -63.72%
- Current HPI
- 278.5745
- Rent YoY
- ▲ 1.87%
- Metro
- Houston-The Woodlands-Sugar Land, TX
- State GDP YoY
- ▲ 3.95%
- F500 in state
- 110
Industry mix (Fortune 500 HQ in TX)
| Industry | F500 HQs | Revenue |
|---|---|---|
| Energy | 16 | $1,198B |
|
||
| Technology | 5 | $198B |
|
||
| Engineering / Construction | 4 | $72B |
|
||
| Energy Services | 3 | $60B |
|
||
| Utilities | 3 | $41B |
|
||
| Healthcare | 2 | $330B |
|
||
Price history
+17.7% since first listed35 events — show timeline
- 2026-05-29 Pending — HARMLS
- 2026-05-20 Pending — HARMLS
- 2026-05-07 Listed $158,900 HARMLS
- 2025-02-05 Listing Removed — HARMLS
- 2024-11-08 Relisted — HARMLS
- 2024-11-08 Pending — HARMLS
- 2024-10-19 Pending — HARMLS
- 2024-10-14 Pending — HARMLS
- 2024-10-12 Listing Removed — HARMLS
- 2024-04-17 Price Changed $189,900 HARMLS
- 2024-04-12 Relisted — HARMLS
- 2024-04-04 Pending — HARMLS
- 2024-03-01 Price Changed $182,000 HARMLS
- 2024-03-01 Relisted — HARMLS
- 2024-02-28 Pending — HARMLS
- 2024-02-16 Pending — HARMLS
- 2024-02-16 Listed $175,000 HARMLS
- 2024-02-06 Coming Soon — HARMLS
- 2018-12-17 Sold (Public Records) — Public Records
- 2018-12-17 Sold (MLS) — HARMLS
- 2018-11-20 Pending — HARMLS
- 2018-11-09 Pending — HARMLS
- 2018-11-01 Relisted — HARMLS
- 2018-10-25 Pending — HARMLS
- 2018-10-16 Listed $159,900 HARMLS
- 2014-11-26 Sold (Public Records) — Public Records
- 2014-11-25 Sold (MLS) — HARMLS
- 2014-11-10 Pending — HARMLS
- 2014-10-31 Pending — HARMLS
- 2014-10-15 Price Changed $129,995 HARMLS
- 2014-10-01 Relisted — HARMLS
- 2014-09-26 Pending — HARMLS
- 2014-09-14 Pending — HARMLS
- 2014-09-07 Price Changed $132,500 HARMLS
- 2014-07-25 Listed $135,000 HARMLS
Property tax history
+4.9%/yrLatest (2025): $6,443 · -3.3% YoY. Source: county tax records.
Cash-flow waterfall
monthlySold comps — $/sqft
last 12 mo · ≤1 miLoading sold comps…