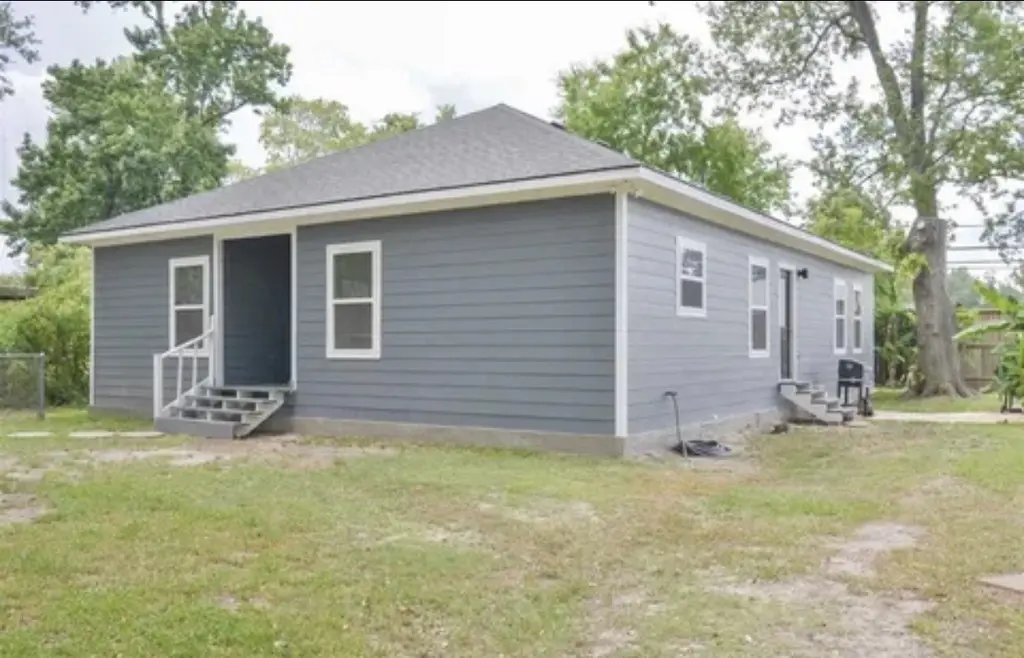
602 Big Deer Dr · Houston, TX
Flood risk 1/10 · Minimal
- FEMA flood zone
- X (unshaded)
- Chance of flooding over 30 yrs
- 0.0%
- Est. flood insurance / yr
- $507 – $1,088
Fire risk 3/10 · Minor
- Est. fire insurance / yr
- $1,222 – $2,270
Heat risk 9/10 · Severe
- Hot days now (above 111°F)
- 7 days/yr
- Hot days in 30 yrs
- 24 days/yr
Wind risk 9/10 · Severe
- Chance of severe wind over 30 yrs
- 99.0%
Air-quality risk 2/10 · Minimal
- Unhealthy air days now
- 2 days/yr
- Unhealthy air days in 30 yrs
- 2 days/yr
Risk factors via First Street. Map © Google.
Why this score? — see what drove the B grade
The composite is a weighted blend of 9 inputs, each scored 0–100. Each bar is that input's sub-score; the figure is the points it added to the 100-point composite (weight × sub-score).
- Cash flow +26.8/30.0
- ARV discount +15.0/15.0
- DSCR +9.2/10.0
- 1% rule +9.1/10.0
- Livability +3.7/5.0
- Schools +3.1/10.0
- Rent growth +2.9/5.0
- Condition / age +2.5/5.0
- Appreciation +0.0/10.0
$164,000
🖨 Deal sheet 📄 Offer letter ✓ Due diligence
Listing remarks MLS
This Charming LOT completely fenced, is a great starter home. Or an investment property to buy and hold to lease for income producing. This house is in need of work inside & out. Come make it your own. With a spacious floor-plan & open living area that flows into the kitchen that includes a large island. It has 2 large bedrooms with spacious closets. 2 bathrooms Needs new Paint throughout, and TLC. Call today to schedule your appointment.
Key facts
- 0.3 acre lot
- Built 2020
- Listed 62 days
Neighborhood map
What this means for you Summary
Snapshot
- This is a 3-bed/2.0-bath single-family listed at $164k.
Deal economics
- At list price, monthly cash flow is $451 ($5k/yr) — positive.
- The deal already cash-flows at list — no discount required.
- Meets the 1% rule at list price ($2k rent vs $164k).
- Recommended offer: $154k (6.0% below list) — sets the bar for market timing.
- Cap rate 9.6% vs local median 3.2% in Houston — top-decile yield for the area; either an underpriced asset or a hidden risk that comps aren't pricing in. Stress-test before assuming the spread holds.
Location & tenants
- Location reads 74/100 on livability (#184 in TX, #4,771 nationally) — a middle-class / working-renter tenant base. Strengths: amenities A+, cost of living A+, housing A+; Watch: schools D, crime F.
- Huffman ISD (rural): math 32% / reading 35% proficiency, ranked #500 of 826 in TX (top 60%) — families likely to look elsewhere, expect single-tenant / working-renter base with shorter leases.
- Market conditions: Rents rising (+1.5%/yr); 1172 active listings in the ZIP; 2 comparable units currently listed for rent nearby; solid renter incomes; 29,883 units permitted in Harris County in 2024 (8,621 in 5+ unit buildings).
- This rent runs 30% of the median local income ($92k/yr) — at the standard rent-burdened threshold; future hikes will face affordability resistance.
Forward outlook
- Local home prices are declining (-3.0%/yr); year-one equity from $1k of loan paydown is wiped out by about $5k of value loss. Plan a longer hold.
- Harris County population projected at +47% by 2050 — long-run rental-demand tailwind backs the buy-and-hold thesis.
Negotiation context
- It's been on market 62 days — a 6% lower offer ($154k) is reasonable based on typical stale-listing flexibility.
- 4 sale attempts since 4y ago; this cycle's ask has dropped $13k (7%) from the opening price — seller is motivated, your offer sets the floor, not the list.
Risks & watch-outs
- Watch-outs: property tax is 3.2% of price.
- Climate carrying-cost: severe wind risk, 99% chance of damaging wind over 30y; extreme-heat days projected 7→24/yr by 2055 (HVAC capex compounding) — expect insurance premiums to compound above CPI over the hold.
Questions for the listing agent
- It's been on market 62 days. Have you received any prior offers? Is the seller open to a 6% concession, seller financing, or rate buy-down credit?
- Property tax is high relative to price — has the assessment been appealed recently, and will the sale trigger a re-assessment?
- What does the HOA fee cover, when was the last increase, and are there any pending special assessments or reserve-fund shortfalls?
- Why hasn't it sold? Are there any deal-killer items the seller is aware of (foundation, flood, title, zoning, code violations)?
- Is there a deadline driving the sale (1031 exchange, divorce, estate, relocation)? That informs how much negotiation room exists.
- Schools are D-rated, which usually means shorter tenancies and higher turnover. Who's the typical renter profile here, and what's been the actual vacancy rate?
- Crime grade is F in this area — have there been break-ins, vandalism, or insurance claims at this property in the last 3 years? What carrier currently insures it and at what premium?
- What's the average days-on-market for RENTAL listings here right now (not sales)? A rising rental-DOM trend means longer vacancies and softer asking-rent achievability than the comps imply.
- What's the recent tenant-quality profile in this submarket — average credit score on applications, eviction rate, late-payment / NSF rate, and stable-employment percentage? A property-management company in the area should have these aggregated.
- How much new for-sale + rental construction is in the pipeline within 1–3 miles? Heavy new supply typically softens prices + rents 12–24 months out; constrained supply supports both.
Investment metrics
- 1% rule
- 1.41% ✓
- Cap rate
- 9.59%
- Cash-on-cash
- 11.78%
- DSCR
- 1.52
- GRM
- 5.9
CMA / ARV
- ARV (median comp)
- $274,377
- List price
- $164,000
- Delta
- -40.23%
- Verdict
- UNDERPRICED
- Comps
- 20 within 1.0 mi
Show comp detail 9 sales within ~0.75 mi
| Address | Dist | Beds/Ba | Sqft | Sold | Price | $/sf | Match |
|---|---|---|---|---|---|---|---|
| 414 Mariachi St | 0.33mi | 3/2.0 | 1,920 (+6%) | 4mo | $345,000 | $180 | 70 |
| 611 Big Deer Dr | 0.06mi | 2/1.5 (-1) | 1,580 (-12%) | 9mo | $234,900 | $149 | 62 |
| 719 Moose Dr | 0.30mi | 3/2.5 | 2,076 (+15%) | 4mo | $285,000 | $137 | 56 |
| 1322 Red Fox Dr | 0.71mi | 3/2.0 | 1,845 (+2%) | 14mo | $309,000 | $167 | 52 |
| 1326 Red Fox Dr | 0.70mi | 3/2.0 | 1,845 (+2%) | 16mo | $309,000 | $167 | 50 |
| 126 E Antelope Dr | 0.53mi | 4/2.0 (+1) | 2,016 (+12%) | 3mo | $67,000 | $33 | 49 |
| 203 Antelope Dr | 0.52mi | 3/2.5 | 2,014 (+12%) | 18mo | $289,000 | $143 | 40 |
| 1119 Big Deer Dr | 0.53mi | 3/2.0 | 1,597 (-12%) | 20mo | $245,000 | $153 | 39 |
| 21206 Papoose Ct | 0.75mi | 3/2.0 | 2,058 (+14%) | 12mo | $265,000 | $129 | 32 |
Match score weights: distance 35% · size 25% · config 20% · recency 20%. Top-matched comps best support the ARV.
Projected returns pro-forma
-3.0% appreciation · 1.48% rent growth · sell at horizon
- IRR
- -0.7%
- Equity multiple
- 0.97×
- Total profit
- $-1,167
- Equity at exit
- $24,453
- IRR
- 7.1%
- Equity multiple
- 1.50×
- Total profit
- $22,823
- Equity at exit
- $14,180
Cash invested: $45,920 (down + closing). Projections, not guarantees.
Landlord ↔ Tenant lean methodology
- Overall (STATE)
- 87 Strongly Landlord-Friendly
- State Texas
- 87 Strongly Landlord-Friendly · R+5
- County
- — inherits STATE
- City
- — inherits STATE
ZIP-level market 77532
- Home prices YoY
- -28.6%
- Rents YoY
- 1.5%
- Active inventory
- 1172
- Price-to-rent
- 5.9×
Monthly cashflow live
- Estimated rent
- $2,316 medium interval (Pro) →
- Mortgage (P&I)
- −$860
- Tax from tax record
- −$437 /mo · $5,249/yr
- Insurance
- −$68
- HOA
- −$13
- Vacancy / Maint / Mgmt
- −$486
- Net cashflow
- $451
Break-even live
UW: 25.0% down · 7.5% · 30yr · 1.5% tax · 5.0% vac · 8.0% maint · 8.0% mgmt
Financing live
Cash to close
- Down payment
- $41,000
- Closing costs
- $4,920
- Reserves months
- —
- Total cash needed
- —
Loan-product check · same deal, 3 products live
Conventional
25% down · 7.5% · 30yr
- Down + closing
- —
- Monthly P&I
- —
- Monthly cashflow
- —
- DSCR
- —
- Eligible?
- —
Personal DTI + credit; lowest rate.
DSCR
20% down · 8.5% · 30yr
- Down + closing
- —
- Monthly P&I
- —
- Monthly cashflow
- —
- DSCR
- —
- Eligible?
- —
No personal income docs; deal must DSCR.
Hard money
10% down · 12.0% · 12mo
- Down + closing
- —
- Monthly P&I
- —
- Monthly cashflow
- —
- DSCR
- —
- Eligible?
- —
Short-term bridge; refi at stabilization.
Rent comps 2 comps
| Address | Beds | Baths | Sqft | Rent | $/sqft | DOM | Units | Dist |
|---|---|---|---|---|---|---|---|---|
| 22423 Woodlake Rd Huffman, TX | 3.0 | 2.0 | 1673 | $1,935 | $1.16 | 5d | 1 | 1.17mi |
| 1823 Black Bear Dr Crosby, TX | 3.0 | 2.5 | 2564 | $2,395 | $0.93 | 44d | 1 | 1.23mi |
HOA detail
- Monthly dues
- $13 · $156/yr
Listing history 33 events
-
2026-06-18days on market $164,000 Active 62 DOM
-
2026-06-17days on market $164,000 Active 61 DOM
-
2026-06-16days on market $164,000 Active 60 DOM
-
2026-06-15days on market $164,000 Active 59 DOM
-
2026-06-13days on market $164,000 Active 57 DOM
-
2026-06-09days on market $164,000 Active 53 DOM
-
2026-06-08days on market $164,000 Active 52 DOM
-
2026-06-07pricedays on market $164,000 Active 51 DOM
-
2026-06-04days on market $165,900 Active 48 DOM
-
2026-06-03days on market $165,900 Active 47 DOM
-
2026-06-02pricedays on market $165,900 Active 46 DOM
-
2026-06-01days on market $169,900 Active 45 DOM
-
2026-05-31days on market $169,900 Active 44 DOM
-
2026-05-06price $169,900 460-char remark
Show marketing remark (460 chars)
This Charming LOT completely fenced, is a great starter home. Or an investment property to buy and hold to lease for income producing. This house is in need of work inside & out. Come make it your own. With a spacious floor-plan & open living area that flows into the kitchen that includes a large island. It has 2 large bedrooms with spacious closets. 2 bathrooms Needs new Paint throughout, and TLC. Call today to schedule your appointment.
-
2026-04-17$176,750 Active 460-char remark
Show marketing remark (460 chars)
This Charming LOT completely fenced, is a great starter home. Or an investment property to buy and hold to lease for income producing. This house is in need of work inside & out. Come make it your own. With a spacious floor-plan & open living area that flows into the kitchen that includes a large island. It has 2 large bedrooms with spacious closets. 2 bathrooms Needs new Paint throughout, and TLC. Call today to schedule your appointment.
-
2026-04-17historical
Show marketing remark (460 chars)
This Charming LOT completely fenced, is a great starter home. Or an investment property to buy and hold to lease for income producing. This house is in need of work inside & out. Come make it your own. With a spacious floor-plan & open living area that flows into the kitchen that includes a large island. It has 2 large bedrooms with spacious closets. 2 bathrooms Needs new Paint throughout, and TLC. Call today to schedule your appointment.
-
2026-03-09price $155,000
-
2026-03-04price $159,900
-
2026-02-18price $165,000
-
2026-02-17$180,000 Active
-
2025-04-19historical
-
2025-04-05$239,900 Active
-
2022-12-08soldstatus Sold
-
2022-12-08soldstatus
-
2022-11-24status Pending
-
2022-11-14status Option Pending
-
2022-10-29price $246,000
-
2022-09-02price $249,000
-
2022-07-29price $259,000
-
2022-06-30$265,000 Active
-
2015-11-30soldstatus
-
2002-01-24soldstatus
-
1992-12-15soldstatus
ⓘ Source: listings_history table (triggers on properties + properties_extension) + one-shot
backfill from property_details.listing_events for pre-trigger history.
Tax reassessment forecast TX · Resets to sale price
- Current annual tax
- $5,249 · $437/mo
- Projected year-2 tax
- $5,249 · $437/mo
- Expected delta
- $0/yr ($0/mo · 0.0%)
ⓘ Screening estimate from a state-policy table — verify with the county assessor before closing.
Climate risk First Street
- Flood 1/10 Low FEMA zone X (unshaded) · 0% chance over 30 yrs
- Wildfire 3/10 Moderate
- Heat 9/10 Extreme 7 d/yr ≥111°F today · 24 d/yr by 30 yrs out
- Wind 9/10 Extreme 99% chance of damaging wind over 30 yrs
- Air quality 2/10 Low 2 unhealthy d/yr today · 2 by 30 yrs out
Nearby sold comps map
Loading sold comps map…
Walkable amenities ~0.75 mi
Loading nearby amenities…
Taxation est. · year 1
- Rental income
- $27,791
- − Mortgage interest
- −$9,187
- − Property taxes
- −$5,249
- − Insurance
- −$820
- − Repairs & maintenance
- −$2,223
- − Management
- −$2,223
- − HOA
- −$156
- − Depreciation
- −$4,771
- Taxable income
- $3,162
- Est. tax owed @ 24.0%
- −$759
- After-tax cash flow
- $4,651/yr
For passive investors: Depreciation is non-cash, so a rental often shows a tax loss while cash-flowing — sheltering income. Rental losses are passive: they offset passive income freely, and up to $25,000/yr can offset ordinary (W-2) income if you actively participate and your MAGI is under $100k (phasing out to $0 by $150k); unused losses carry forward. On sale, claimed depreciation is recaptured at up to 25%, and gains may owe capital-gains tax (a 1031 exchange can defer both). Figures are a year-1 estimate at your 24.0% rate — not tax advice; consult a CPA.
Schools (NCES district)
- District
- Huffman ISD
- NCES district ID
- 4823820
- Math proficiency
- 32% ▼ -9.00%
- Reading proficiency
- 35% ▼ -9.00%
- Median HH income
- $65,848
- Composite
- 30.61/100
- National rank
- #6195
- State rank
- #500 of 826 in TX
Livability — Houston
- Score
- 74/100
- State rank
- #184
- US rank
- #4771
Category grades
Schools grade is shown separately in the Schools card above.
Census & demographics
- County
- Harris County · 4,702,590 people
- City population
- 3,226,434
- Metro
- Houston-The Woodlands-Sugar Land, TX
- Population (ZIP)
- 33,780
- Household income
- $92,201
- Rent vs Own
- Severe rent burden
- 382.0
Population outlook (Harris County) Hauer SSP2
- Today (2025)
- 5,571,493 people
- By 2030
- 6,089,821 · +9.3%
- By 2040
- 7,142,806 · +28.2%
- By 2050
- 8,185,864 · +46.9%
- By 2075
- 10,574,329 · +89.8%
- By 2100
- 12,109,958 · +117.4%
Race, ethnicity, and origin ACS 2023
- Neighborhood character
- Diverse neighborhood (Simpson 0.60)
- Race & ethnicity
- White 54% Hispanic / Latino 31% Two or more races 16% Black 9%
- Hispanic origin (detail)
- Mexican 24%
- Common ancestry
- Lithuanian 4% Romanian 3% Italian 2%
- Foreign-born
- 10% · Canada
- Languages at home
- 78% English-only · Spanish 21%
Political lean MEDSL · Harris
- 2024 margin
- Lean D (+5.5) · D 52.0% · R 46.4% · Other 1.6%
- 2008→2024 swing
- +3.9pp toward D · 2008: 1.6pp · 2024: 5.5pp
- All cycles
- 2024: D+5.5 2020: D+13.3 2016: D+12.4 2012: D+0.1 2008: D+1.6
Not yet ingested
- Civics
- —
Market trends
- HPI YoY
- ▼ -105.63%
- Current HPI
- 264.0126
- Rent YoY
- ▲ 1.48%
- Metro
- Houston-The Woodlands-Sugar Land, TX
- State GDP YoY
- ▲ 3.95%
- F500 in state
- 110
Industry mix (Fortune 500 HQ in TX)
| Industry | F500 HQs | Revenue |
|---|---|---|
| Energy | 16 | $1,198B |
|
||
| Technology | 5 | $198B |
|
||
| Engineering / Construction | 4 | $72B |
|
||
| Energy Services | 3 | $60B |
|
||
| Utilities | 3 | $41B |
|
||
| Healthcare | 2 | $330B |
|
||
Price history
-35.9% since first listed20 events — show timeline
- 2026-05-06 Price Changed $169,900 HARMLS
- 2026-04-17 Listing Removed — HARMLS
- 2026-04-17 Listed $176,750 HARMLS
- 2026-03-09 Price Changed $155,000 HARMLS
- 2026-03-04 Price Changed $159,900 HARMLS
- 2026-02-18 Price Changed $165,000 HARMLS
- 2026-02-17 Listed $180,000 HARMLS
- 2025-04-19 Listing Removed — HARMLS
- 2025-04-05 Listed $239,900 HARMLS
- 2022-12-08 Sold (Public Records) — Public Records
- 2022-12-08 Sold (MLS) — HARMLS
- 2022-11-24 Pending — HARMLS
- 2022-11-14 Pending — HARMLS
- 2022-10-29 Price Changed $246,000 HARMLS
- 2022-09-02 Price Changed $249,000 HARMLS
- 2022-07-29 Price Changed $259,000 HARMLS
- 2022-06-30 Listed $265,000 HARMLS
- 2015-11-30 Sold (Public Records) — Public Records
- 2002-01-24 Sold (Public Records) — Public Records
- 1992-12-15 Sold (Public Records) — Public Records
Property tax history
+13.4%/yrLatest (2025): $5,249 · +115.9% YoY. Source: county tax records.
Cash-flow waterfall
monthlySold comps — $/sqft
last 12 mo · ≤1 miLoading sold comps…