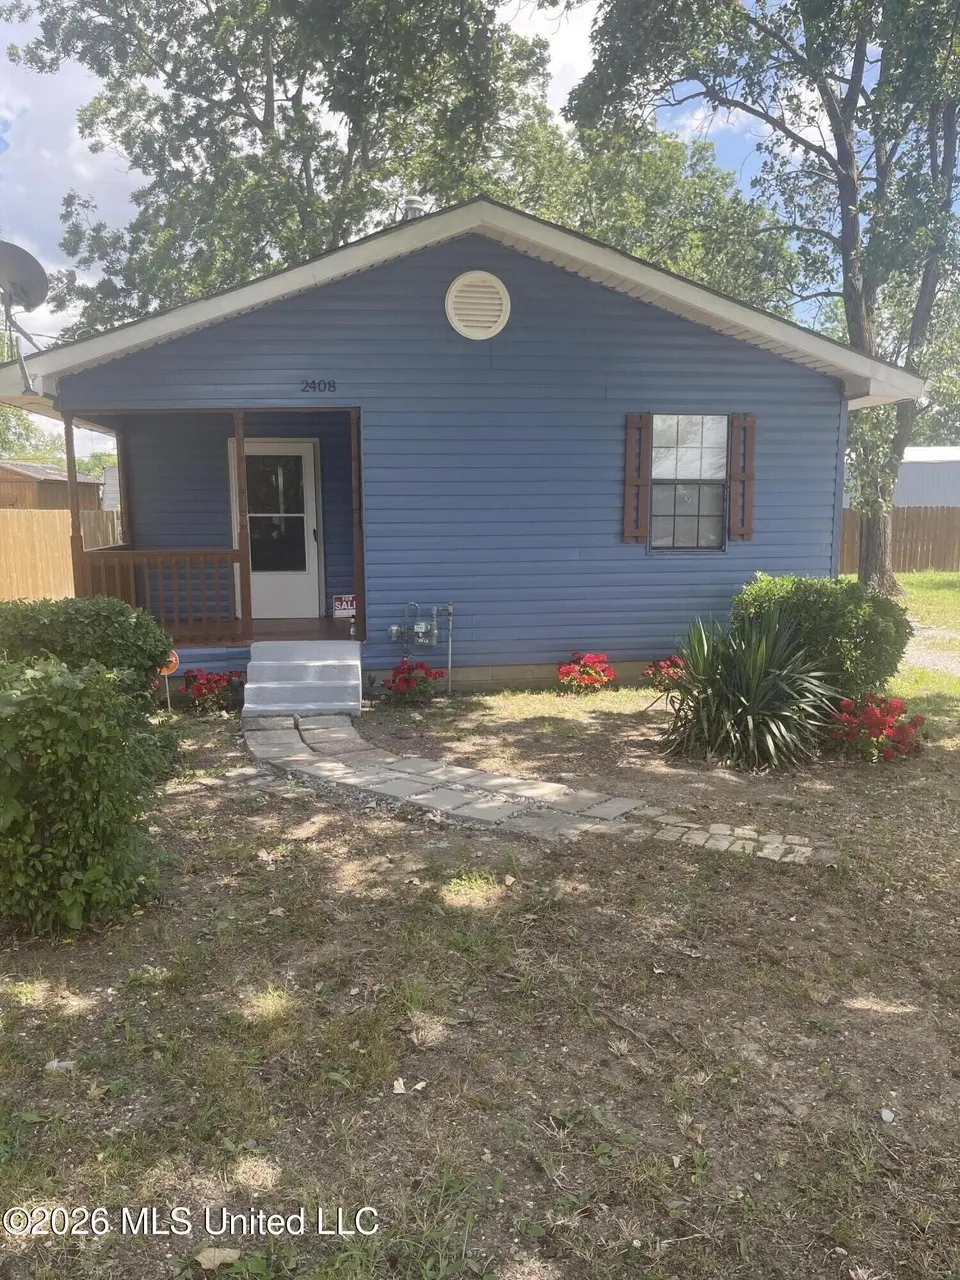
2408 N Old Hwy 61 · North Tunica, MS
Flood risk 1/10 · Minimal
- FEMA flood zone
- X (unshaded)
- Chance of flooding over 30 yrs
- 0.0%
- Est. flood insurance / yr
- $507 – $1,088
Fire risk 1/10 · Minimal
- Est. fire insurance / yr
- $1,241 – $2,305
Heat risk 7/10 · Major
- Hot days now (above 109°F)
- 7 days/yr
- Hot days in 30 yrs
- 20 days/yr
Wind risk 4/10 · Minor
- Chance of severe wind over 30 yrs
- 21.0%
Air-quality risk 1/10 · Minimal
- Unhealthy air days now
- 0 days/yr
- Unhealthy air days in 30 yrs
- 0 days/yr
Risk factors via First Street. Map © Google.
Why this score? — see what drove the B+ grade
The composite is a weighted blend of 9 inputs, each scored 0–100. Each bar is that input's sub-score; the figure is the points it added to the 100-point composite (weight × sub-score).
- Cash flow +30.0/30.0
- 1% rule +10.0/10.0
- DSCR +10.0/10.0
- Appreciation +8.7/10.0
- ARV discount +7.5/15.0
- Livability +2.9/5.0
- Rent growth +2.5/5.0
- Condition / age +2.5/5.0
- Schools +1.2/10.0
$65,000
🖨 Deal sheet (PDF) 📄 Offer letter ✓ Due diligence
Listing remarks
If you're looking for something affordable to call your own, This is it! If you're wanting to add to your portfolio, This is it! Two for one! This home also has a vacant lot next door that can be utilized to place a mobile home or expand your existing home. . Either way, This is Move in READY for you or your TENANTS !!!Owner has installed new carpet, ceiling fans throughout entire home, fresh paint throughout, and new interior bedrooms and closet doors added. Home has security system in place.
Key facts
- Security system
- 0.23 acre lot
- Listed 8 days
Tags
Property features AI
Finance
- HOA & community: Playground in the community
Exterior
- Parking: Driveway (gravel)
- Security: Security system
- Utilities: Public water; Public sewer; Cable available
- Home design: Single-family house; One story; Move-in ready; Estimated living area
- Construction: Siding exterior; Asphalt shingle roof; Foundation: see remarks; Built as a single-family residence
- Exterior features: Enclosed front porch; Wood privacy fencing; Gravel driveway
Interior
- Bathrooms: 1 full bathroom
- Heating & cooling: Hot water heating (natural gas); Ceiling fans for cooling; Window unit(s)
- Interior features: Ceiling fans; Security system
- Laundry & utility: Washer hookup; Washer space in laundry room and in kitchen; Gas dryer hookup
Neighborhood map
What this means for you Summary
Snapshot
- This is a 2-bed/1.0-bath single-family listed at $65k.
Deal economics
- At list price, monthly cash flow is $415 ($5k/yr) — positive.
- The deal already cash-flows at list — no discount required.
- Meets the 1% rule at list price ($1k rent vs $65k).
Location & tenants
- Location reads 58/100 on livability (#276 in MS) — a working-class tenant base; expect higher turnover. Strengths: cost of living A+, housing A+; Watch: amenities F, commute F, employment F.
- Tunica County School District (rural): math 13% / reading 16% proficiency, ranked #110 of 130 in MS (top 85%) — low school quality limits family demand, transient renter base, plan for 1-2y turnover; 94% free/reduced lunch — lower-income household profile, screen leases tightly.
- Market conditions: 13 active listings in the ZIP; 90 units permitted in Tunica County in 2024 (0 in 5+ unit buildings).
Forward outlook
- In year one you build about $5k of equity ($449 loan paydown + $5k appreciation (7.4% local appreciation)).
- Tunica County population projected at -22% by 2050 — secular population decline; favor cash flow + early exit over multi-decade hold.
- At projected returns (7.4% appreciation + 3.0% rent growth), your $18k cash investment doubles in ~2 years — after that, you're playing with house money.
- By year 7, paydown + projected appreciation supports a ~$36k cash-out refi (75% LTV) — recoverable capital for the next deal without selling this one.
Negotiation context
- Only 8 days on market — expect competitive offers; lowballing is unlikely to land.
Risks & watch-outs
- Watch-outs: built in 1950 — expect roof / HVAC / electrical / plumbing capex.
- Climate carrying-cost: extreme-heat days projected 7→20/yr by 2055 (HVAC capex compounding) — expect insurance premiums to compound above CPI over the hold.
Questions for the listing agent
- Built in 1950 — when were the roof, HVAC, electrical panel, plumbing, and water heater last replaced?
- Is there a deadline driving the sale (1031 exchange, divorce, estate, relocation)? That informs how much negotiation room exists.
- What's the average days-on-market for RENTAL listings here right now (not sales)? A rising rental-DOM trend means longer vacancies and softer asking-rent achievability than the comps imply.
- What's the recent tenant-quality profile in this submarket — average credit score on applications, eviction rate, late-payment / NSF rate, and stable-employment percentage? A property-management company in the area should have these aggregated.
- How much new for-sale + rental construction is in the pipeline within 1–3 miles? Heavy new supply typically softens prices + rents 12–24 months out; constrained supply supports both.
Investment metrics
- 1% rule
- 1.59% ✓
- Cap rate
- 13.96%
- Cash-on-cash
- 27.39%
- DSCR
- 2.22
- GRM
- 5.2
CMA / ARV
No comps found within radius.
Projected returns pro-forma
7.42% appreciation · 3.0% rent growth · sell at horizon
- IRR
- 40.9%
- Equity multiple
- 3.79×
- Total profit
- $50,817
- Equity at exit
- $46,828
- IRR
- 36.9%
- Equity multiple
- 8.02×
- Total profit
- $127,761
- Equity at exit
- $90,618
Cash invested: $18,200 (down + closing). Projections, not guarantees.
Landlord ↔ Tenant lean methodology
- Overall (STATE)
- 90 Strongly Landlord-Friendly
- State Mississippi
- 90 Strongly Landlord-Friendly · R+11
- County
- — inherits STATE
- City
- — inherits STATE
ZIP-level market 38676
- Home prices YoY
- 6.5%
- Active inventory
- 13
- Price-to-rent
- 5.2×
Monthly cashflow live
- Estimated rent
- $1,034 medium interval (Pro) →
- Mortgage (P&I)
- −$341
- Tax from tax record
- −$34 /mo · $407/yr
- Insurance
- −$27
- HOA
- −$0
- Vacancy / Maint / Mgmt
- −$217
- Net cashflow
- $415
Break-even live
Sensitivity live
| Price | -10% $452 | -5% $434 | +0% $415 | +5% $397 | +10% $379 |
|---|---|---|---|---|---|
| Rent | -10% $334 | -5% $375 | +0% $415 | +5% $456 | +10% $497 |
| Rate | -1.0pp $448 | -0.5pp $432 | base $415 | +0.5pp $399 | +1.0pp $381 |
UW: 25.0% down · 7.5% · 30yr · 1.5% tax · 5.0% vac · 8.0% maint · 8.0% mgmt
Financing live
Cash to close
- Down payment
- $16,250
- Closing costs
- $1,950
- Reserves months
- —
- Total cash needed
- —
Loan-product check · same deal, 3 products live
Conventional
25% down · 7.5% · 30yr
- Down + closing
- —
- Monthly P&I
- —
- Monthly cashflow
- —
- DSCR
- —
- Eligible?
- —
Personal DTI + credit; lowest rate.
DSCR
20% down · 8.5% · 30yr
- Down + closing
- —
- Monthly P&I
- —
- Monthly cashflow
- —
- DSCR
- —
- Eligible?
- —
No personal income docs; deal must DSCR.
Hard money
10% down · 12.0% · 12mo
- Down + closing
- —
- Monthly P&I
- —
- Monthly cashflow
- —
- DSCR
- —
- Eligible?
- —
Short-term bridge; refi at stabilization.
Listing history 6 events
-
2026-06-18days on market $65,000 Active 8 DOM
-
2026-06-17days on market $65,000 Active 7 DOM
-
2026-06-16days on market $65,000 Active 6 DOM
-
2026-06-15days on market $65,000 Active 5 DOM
-
2026-06-13remarks 498-char remark
-
2026-06-13$65,000 Active 3 DOM
ⓘ Source: listings_history table (triggers on properties + properties_extension) + one-shot
backfill from property_details.listing_events for pre-trigger history.
Tax reassessment forecast MS · Resets to sale price
- Current annual tax
- $407 · $34/mo
- Projected year-2 tax
- $514 · $43/mo
- Expected delta
- +$106/yr (+$9/mo · 26.1%)
ⓘ Screening estimate from a state-policy table — verify with the county assessor before closing.
Climate risk First Street
- Flood 1/10 Low FEMA zone X (unshaded) · 0% chance over 30 yrs
- Wildfire 1/10 Low
- Heat 7/10 Severe 7 d/yr ≥109°F today · 20 d/yr by 30 yrs out
- Wind 4/10 Moderate 21% chance of damaging wind over 30 yrs
- Air quality 1/10 Low 0 unhealthy d/yr today · 0 by 30 yrs out
Nearby sold comps map
Loading sold comps map…
Walkable amenities ~0.75 mi
Loading nearby amenities…
Taxation est. · year 1
- Rental income
- $12,414
- − Mortgage interest
- −$3,641
- − Property taxes
- −$407
- − Insurance
- −$325
- − Repairs & maintenance
- −$993
- − Management
- −$993
- − Depreciation
- −$1,891
- Taxable income
- $4,164
- Est. tax owed @ 24.0%
- −$999
- After-tax cash flow
- $3,985/yr
For passive investors: Depreciation is non-cash, so a rental often shows a tax loss while cash-flowing — sheltering income. Rental losses are passive: they offset passive income freely, and up to $25,000/yr can offset ordinary (W-2) income if you actively participate and your MAGI is under $100k (phasing out to $0 by $150k); unused losses carry forward. On sale, claimed depreciation is recaptured at up to 25%, and gains may owe capital-gains tax (a 1031 exchange can defer both). Figures are a year-1 estimate at your 24.0% rate — not tax advice; consult a CPA.
Schools (NCES district)
- District
- Tunica County School District
- NCES district ID
- 2804290
- Math proficiency
- 13% ▼ -26.00%
- Reading proficiency
- 16% ▼ -9.00%
- Median HH income
- $32,099
- Composite
- 11.64/100
- National rank
- #9693
- State rank
- #110 of 130 in MS
Livability — North Tunica
- Score
- 58/100
- State rank
- #276
- US rank
- #21452
Category grades
Schools grade is shown separately in the Schools card above.
Census & demographics
- Census place
- North Tunica, MS
- Population (ZIP)
- 5,318
Population outlook (Tunica County) Hauer SSP2
- Today (2025)
- 9,512 people
- By 2030
- 9,080 · -4.5%
- By 2040
- 8,232 · -13.5%
- By 2050
- 7,406 · -22.1%
- By 2075
- 5,511 · -42.1%
- By 2100
- 3,828 · -59.8%
Race, ethnicity, and origin ACS 2023
- Neighborhood character
- Predominantly Black (77%)
- Race & ethnicity
- Black 77% White 22% Hispanic / Latino 1%
- Common ancestry
- Slovak 2% Serbian 1% Iranian 1%
- Foreign-born
- 1% · Canada
- Languages at home
- 98% English-only · Spanish 2%
Political lean MEDSL · Tunica
- 2024 margin
- Solid D (+38.9) · D 68.8% · R 29.9% · Other 1.2%
- 2008→2024 swing
- -13.3pp toward R · 2008: 52.2pp · 2024: 38.9pp
- All cycles
- 2024: D+38.9 2020: D+46.4 2016: D+50.2 2012: D+58.8 2008: D+52.2
Not yet ingested
- Civics
- —
Market trends
- HPI YoY
- ▲ 7.42%
- Current HPI
- 120.6957
- Rent YoY
- —
- Metro
- —
- State GDP YoY
- —
- F500 in state
- 0
Price history
2 events — show timeline
- 2026-06-10 Listed $65,000 MLSU
- 1990-06-22 Sold (Public Records) — Public Records
Property tax history
+7.8%/yrLatest (2025): $407 · +50.0% YoY. Source: county tax records.
Cash-flow waterfall
monthlySold comps — $/sqft
last 12 mo · ≤1 miLoading sold comps…