206 Denby Cir · Columbia, SC
Flood risk 1/10 · Minimal
- FEMA flood zone
- X (unshaded)
- Chance of flooding over 30 yrs
- 0.0%
- Est. flood insurance / yr
- $507 – $1,088
Fire risk 4/10 · Minor
- Est. fire insurance / yr
- $783 – $1,453
Heat risk 7/10 · Major
- Hot days now (above 107°F)
- 7 days/yr
- Hot days in 30 yrs
- 16 days/yr
Wind risk 6/10 · Moderate
- Chance of severe wind over 30 yrs
- 65.0%
Air-quality risk 3/10 · Minor
- Unhealthy air days now
- 2 days/yr
- Unhealthy air days in 30 yrs
- 3 days/yr
Risk factors via First Street. Map © Google.
Why this score? — see what drove the D- grade
The composite is a weighted blend of 9 inputs, each scored 0–100. Each bar is that input's sub-score; the figure is the points it added to the 100-point composite (weight × sub-score).
- Cash flow +11.5/30.0
- ARV discount +7.5/15.0
- 1% rule +4.0/10.0
- Livability +3.9/5.0
- Schools +3.6/10.0
- DSCR +3.4/10.0
- Rent growth +3.2/5.0
- Condition / age +2.5/5.0
- Appreciation +0.0/10.0
$224,400
🖨 Deal sheet (PDF) 📄 Offer letter ✓ Due diligence
Listing remarks
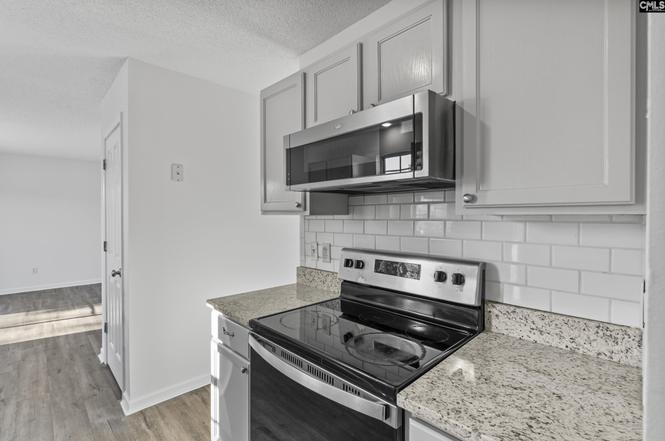
IMPRESSIVE IMPROVEMENTS!!! This home offers true peace of mind with a NEW roof, NEW HVAC, NEW carpet, full interior paint, freshly painted kitchen cabinets, and NEW granite countertops already completed. Delivering both style and low-maintenance living for years to come. Inside, you'll find updated light fixtures throughout, durable LVP flooring across the main living areas, and new carpet upstairs, creating a cohesive and modern feel. A one-car garage with additional driveway parking adds everyday convenience. Step outside to a spacious backyard, perfect for entertaining or unwinding. Ideally located near major interstates and just minutes from shopping, dining, and entertainment at Villag
Key facts
- New carpet
- New hvac
- Exterior refresh
Tags
Property features AI
Finance
- HOA & community: Homeowners association present
Exterior
- Parking: Attached garage with 1 garage space
- Utilities: Public water; Public sewer; Storm doors
- Home design: Two-story home
- Construction: Slab foundation
- Exterior features: Patio; Vinyl exterior finish; Paved road access
Interior
- Kitchen: Wood-natural cabinets; Eat-in kitchen; Pantry; Formica countertops; Dishwasher; Garbage disposal; Refrigerator; Microwave above stove; Free-standing smooth-surface range
- Bedrooms: Master bedroom with his-and-hers closets, private bath with tub/shower, and private closet (second floor); Bedroom 2 with private closet and shared tub/shower bath (second floor); Bedroom 3 with shared tub/shower bath (second floor)
- Flooring: Luxury vinyl plank flooring throughout main living areas and bedrooms; Concrete floors in some bedroom areas
- Bathrooms: Two full bathrooms; One half bathroom; Two secondary full bathrooms
- Heating & cooling: Central cooling; Central electric heating
- Interior features: Smoke detector; Attic with pull-down access; Attic access; Ceiling fan in living room
- Laundry & utility: Mud room laundry on main level; Electric water heater
Neighborhood map
What this means for you Summary
Snapshot
- This is a 3-bed/3.0-bath single-family listed at $224k.
Deal economics
- At list price, monthly cash flow is $-75 ($-895/yr) — negative.
- To cash-flow at today's rent, offer at most $211k (5.9% below list).
- To meet the 1% rule (rent ≥ 1% of price), the offer needs to be $201k (10.4% below list).
- Recommended offer: $197k (12.0% below list) — sets the bar for market timing.
Location & tenants
- Location reads 78/100 on livability (#18 in SC, #2,436 nationally) — a middle-class / working-renter tenant base. Strengths: amenities A+, commute A+, cost of living A+; Watch: employment D, crime F.
- Richland 02 (suburban): math 35% / reading 47% proficiency, ranked #29 of 80 in SC (top 36%) — families likely to look elsewhere, expect single-tenant / working-renter base with shorter leases.
- Zoned schools: Bridge Creek Elementary (math 35% / reading 31%, grade F, #364 of 597 statewide, top 61%, 558 students, 80% FRL); Ridge View High (math 43% / reading 76%, grade C+, #110 of 196 statewide, top 58%, 1,711 students, 60% FRL) — zoned schools average 70% FRL vs 38% district-wide (32 pts higher); higher-poverty schools than district average — tighter screening recommended.
- Market conditions: Rents rising (+2.8%/yr); 417 active listings in the ZIP; 5 comparable units currently listed for rent nearby; rentals leasing fast (median 5d on market — plan ~1-2 weeks tenant-placement turnaround); 3,472 units permitted in Richland County in 2024 (1,096 in 5+ unit buildings).
- This rent runs 33% of the median local income ($74k/yr) — at the standard rent-burdened threshold; future hikes will face affordability resistance.
Forward outlook
- Local home prices are declining (-3.0%/yr); year-one equity from $2k of loan paydown is wiped out by about $7k of value loss. Plan a longer hold.
- Richland County population projected at +30% by 2050 — long-run rental-demand tailwind backs the buy-and-hold thesis.
Negotiation context
- It's been on market 141 days — a 12% lower offer ($197k) is reasonable based on typical stale-listing flexibility.
- 3 sale attempts with the ask held roughly flat each time — persistent listings suggest the price (not the market) is what's stuck; bring a comps-based counter.
- Current owner paid $110k; list at $224k implies a 103% gain — meaningful room to come down on a strong offer.
Risks & watch-outs
- Climate carrying-cost: major wind risk, 65% chance of damaging wind over 30y; extreme-heat days projected 7→16/yr by 2055 (HVAC capex compounding) — expect insurance premiums to compound above CPI over the hold.
Questions for the listing agent
- What do current leases actually rent for vs. the listed asking? Can we see a recent rent roll and the last 12 months of T-12 income?
- It's been on market 141 days. Have you received any prior offers? Is the seller open to a 12% concession, seller financing, or rate buy-down credit?
- What does the HOA fee cover, when was the last increase, and are there any pending special assessments or reserve-fund shortfalls?
- Why hasn't it sold? Are there any deal-killer items the seller is aware of (foundation, flood, title, zoning, code violations)?
- Is there a deadline driving the sale (1031 exchange, divorce, estate, relocation)? That informs how much negotiation room exists.
- Schools are D-rated, which usually means shorter tenancies and higher turnover. Who's the typical renter profile here, and what's been the actual vacancy rate?
- Crime grade is F in this area — have there been break-ins, vandalism, or insurance claims at this property in the last 3 years? What carrier currently insures it and at what premium?
- The area grade is low — what's the realistic commute time and amenity access for the typical tenant pool here? Any planned neighborhood developments (good or bad) we should know about?
- What's the average days-on-market for RENTAL listings here right now (not sales)? A rising rental-DOM trend means longer vacancies and softer asking-rent achievability than the comps imply.
- What's the recent tenant-quality profile in this submarket — average credit score on applications, eviction rate, late-payment / NSF rate, and stable-employment percentage? A property-management company in the area should have these aggregated.
- How much new for-sale + rental construction is in the pipeline within 1–3 miles? Heavy new supply typically softens prices + rents 12–24 months out; constrained supply supports both.
Investment metrics
- 1% rule
- 0.90% ✗
- Cap rate
- 5.89%
- Cash-on-cash
- -1.42%
- DSCR
- 0.94
- GRM
- 9.3
CMA / ARV
No comps found within radius.
Projected returns pro-forma
-3.0% appreciation · 2.81% rent growth · sell at horizon
- IRR
- -18.8%
- Equity multiple
- 0.34×
- Total profit
- $-41,397
- Equity at exit
- $33,459
- IRR
- -11.6%
- Equity multiple
- 0.31×
- Total profit
- $-43,330
- Equity at exit
- $19,402
Cash invested: $62,832 (down + closing). Projections, not guarantees.
Landlord ↔ Tenant lean methodology
- Overall (STATE)
- 90 Strongly Landlord-Friendly
- State South Carolina
- 90 Strongly Landlord-Friendly · R+6
- County
- — inherits STATE
- City
- — inherits STATE
ZIP-level market 29229
- Home prices YoY
- -21.5%
- Rents YoY
- 2.8%
- Active inventory
- 417
- Price-to-rent
- 9.3×
Monthly cashflow live
- Estimated rent
- $2,010 high interval (Pro) →
- Mortgage (P&I)
- −$1,177
- Tax from tax record
- −$373 /mo · $4,479/yr
- Insurance
- −$94
- HOA
- −$19
- Vacancy / Maint / Mgmt
- −$422
- Net cashflow
- $-75
Break-even live
Sensitivity live
| Price | -10% $52 | -5% $-11 | +0% $-75 | +5% $-138 | +10% $-202 |
|---|---|---|---|---|---|
| Rent | -10% $-233 | -5% $-154 | +0% $-75 | +5% $5 | +10% $84 |
| Rate | -1.0pp $38 | -0.5pp $-18 | base $-75 | +0.5pp $-133 | +1.0pp $-192 |
UW: 25.0% down · 7.5% · 30yr · 1.5% tax · 5.0% vac · 8.0% maint · 8.0% mgmt
Financing live
Cash to close
- Down payment
- $56,100
- Closing costs
- $6,732
- Reserves months
- —
- Total cash needed
- —
Loan-product check · same deal, 3 products live
Conventional
25% down · 7.5% · 30yr
- Down + closing
- —
- Monthly P&I
- —
- Monthly cashflow
- —
- DSCR
- —
- Eligible?
- —
Personal DTI + credit; lowest rate.
DSCR
20% down · 8.5% · 30yr
- Down + closing
- —
- Monthly P&I
- —
- Monthly cashflow
- —
- DSCR
- —
- Eligible?
- —
No personal income docs; deal must DSCR.
Hard money
10% down · 12.0% · 12mo
- Down + closing
- —
- Monthly P&I
- —
- Monthly cashflow
- —
- DSCR
- —
- Eligible?
- —
Short-term bridge; refi at stabilization.
Rent comps 5 comps
| Address | Beds | Baths | Sqft | Rent | $/sqft | DOM | Units | Dist |
|---|---|---|---|---|---|---|---|---|
| 1964 Lake Carolina Dr Columbia, SC | 4.0 | 2.5 | 1841 | $1,939 | $1.05 | 23d | 1 | 0.21mi |
| 2000 Lake Carolina Dr Columbia, SC | 4.0 | 2.5 | 1841 | $2,089 | $1.13 | 16d | 1 | 0.30mi |
| 352 White Gables Dr Columbia, SC | 3.0 | 2.0 | 1165 | $1,605 | $1.38 | 4d | 1 | 0.35mi |
| 500 Castle Ridge Dr Columbia, SC | 3.0 | 2.0 | 1753 | $2,150 | $1.23 | 4d | 1 | 1.44mi |
| 3 Long Glen Ct Columbia, SC | 3.0 | 2.0 | 1314 | $1,849 | $1.41 | 4d | 1 | 1.49mi |
HOA detail
- Monthly dues
- $19 · $228/yr
Listing history 16 events
-
2026-06-13statusdays on market $224,400 Pending 141 DOM
-
2026-06-10days on market $224,400 Active - Contingent 140 DOM
-
2026-06-09days on market $224,400 Active - Contingent 139 DOM
-
2026-06-08days on market $224,400 Active - Contingent 138 DOM
-
2026-06-07days on market $224,400 Active - Contingent 137 DOM
-
2026-06-05days on market $224,400 Active - Contingent 134 DOM
-
2026-06-03days on market $224,400 Active - Contingent 133 DOM
-
2026-06-03days on market $224,400 Active - Contingent 132 DOM
-
2026-06-01days on market $224,400 Active - Contingent 131 DOM
-
2026-05-31days on market $224,400 Active - Contingent 130 DOM
-
2026-04-22price $224,400
-
2026-04-21status Active
-
2026-01-06$224,900 Active
-
2025-08-21$189,900 Active
-
2018-11-29soldstatus $110,325
-
2002-06-03soldstatus $90,000
ⓘ Source: listings_history table (triggers on properties + properties_extension) + one-shot
backfill from property_details.listing_events for pre-trigger history.
Tax reassessment forecast SC · Resets to sale price
- Current annual tax
- $4,479 · $373/mo
- Projected year-2 tax
- $4,479 · $373/mo
- Expected delta
- $0/yr ($0/mo · 0.0%)
ⓘ Screening estimate from a state-policy table — verify with the county assessor before closing.
Climate risk First Street
- Flood 1/10 Low FEMA zone X (unshaded) · 0% chance over 30 yrs
- Wildfire 4/10 Moderate
- Heat 7/10 Severe 7 d/yr ≥107°F today · 16 d/yr by 30 yrs out
- Wind 6/10 Major 65% chance of damaging wind over 30 yrs
- Air quality 3/10 Moderate 2 unhealthy d/yr today · 3 by 30 yrs out
Nearby sold comps map
Loading sold comps map…
Walkable amenities ~0.75 mi
Loading nearby amenities…
Taxation est. · year 1
- Rental income
- $24,121
- − Mortgage interest
- −$12,570
- − Property taxes
- −$4,479
- − Insurance
- −$1,122
- − Repairs & maintenance
- −$1,930
- − Management
- −$1,930
- − HOA
- −$228
- − Depreciation
- −$6,528
- Taxable loss
- −$4,665
- Est. tax savings @ 24.0%
- +$1,120
- After-tax cash flow
- $225/yr
For passive investors: Depreciation is non-cash, so a rental often shows a tax loss while cash-flowing — sheltering income. Rental losses are passive: they offset passive income freely, and up to $25,000/yr can offset ordinary (W-2) income if you actively participate and your MAGI is under $100k (phasing out to $0 by $150k); unused losses carry forward. On sale, claimed depreciation is recaptured at up to 25%, and gains may owe capital-gains tax (a 1031 exchange can defer both). Figures are a year-1 estimate at your 24.0% rate — not tax advice; consult a CPA.
Schools (NCES district)
- District
- Richland 02
- NCES district ID
- 4503390
- Math proficiency
- 35% ▼ -15.00%
- Reading proficiency
- 47% ▼ -5.00%
- Median HH income
- $59,684
- Composite
- 36.2/100
- National rank
- #4730
- State rank
- #29 of 80 in SC
Livability — Columbia
- Score
- 78/100
- State rank
- #18
- US rank
- #2436
Category grades
Schools grade is shown separately in the Schools card above.
Census & demographics
- County
- Richland County · 389,530 people
- City population
- 335,994
- Metro
- Columbia, SC
- Population (ZIP)
- 51,861
- Household income
- $74,043
- Rent vs Own
- Severe rent burden
- 1939.0
Population outlook (Richland County) Hauer SSP2
- Today (2025)
- 459,667 people
- By 2030
- 487,524 · +6.1%
- By 2040
- 542,035 · +17.9%
- By 2050
- 595,371 · +29.5%
- By 2075
- 732,998 · +59.5%
- By 2100
- 820,415 · +78.5%
Race, ethnicity, and origin ACS 2023
- Neighborhood character
- Diverse neighborhood (Simpson 0.56)
- Race & ethnicity
- Black 62% White 24% Hispanic / Latino 8% Two or more races 6% Asian 3%
- Hispanic origin (detail)
- Mexican 2% Puerto Rican 2%
- Common ancestry
- Slovak 1% Lithuanian 1% Romanian 1%
- Foreign-born
- 7% · Canada, South Korea, Jamaica
- Languages at home
- 89% English-only · Spanish 6% Other Indo-European 1% Korean 1%
Political lean MEDSL · Richland
- 2024 margin
- Solid D (+34.6) · D 66.4% · R 31.8% · Other 1.8%
- 2008→2024 swing
- +5.7pp toward D · 2008: 28.9pp · 2024: 34.6pp
- All cycles
- 2024: D+34.6 2020: D+38.3 2016: D+32.9 2012: D+33.3 2008: D+28.9
Not yet ingested
- Civics
- —
Market trends
- HPI YoY
- ▼ -51.11%
- Current HPI
- 186.782
- Rent YoY
- ▲ 2.81%
- Metro
- Columbia, SC
- State GDP YoY
- ▲ 4.51%
- F500 in state
- 2
Industry mix (Fortune 500 HQ in SC)
| Industry | F500 HQs | Revenue |
|---|---|---|
| Packaging | 1 | $7B |
|
||
Price history
+149.3% since first listed6 events — show timeline
- 2026-04-22 Price Changed $224,400 Consolidated MLS
- 2026-04-21 Relisted — Consolidated MLS
- 2026-01-06 Listed $224,900 Consolidated MLS
- 2025-08-21 Listed $189,900 Consolidated MLS
- 2018-11-29 Sold (Public Records) $110,325 Public Records
- 2002-06-03 Sold (Public Records) $90,000 Public Records
Property tax history
+14.0%/yrLatest (2025): $4,479 · +2.6% YoY. Source: county tax records.
Cash-flow waterfall
monthlySold comps — $/sqft
last 12 mo · ≤1 miLoading sold comps…