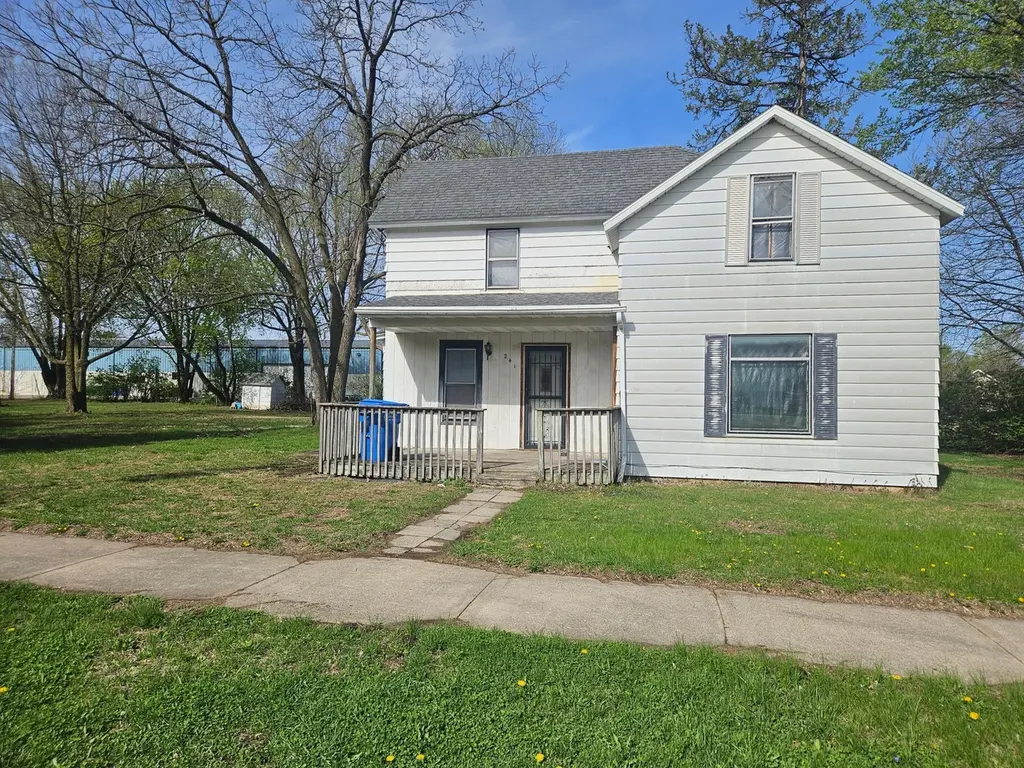
241 Rice St N · Kasota, MN
Flood risk 1/10 · Minimal
- FEMA flood zone
- —
- Chance of flooding over 30 yrs
- 0.0%
- Est. flood insurance / yr
- —
Fire risk 3/10 · Minor
- Est. fire insurance / yr
- $888 – $1,650
Heat risk 2/10 · Minimal
- Hot days now (above 100°F)
- 7 days/yr
- Hot days in 30 yrs
- 14 days/yr
Wind risk 2/10 · Minimal
- Chance of severe wind over 30 yrs
- —
Air-quality risk 2/10 · Minimal
- Unhealthy air days now
- 1 days/yr
- Unhealthy air days in 30 yrs
- 1 days/yr
Risk factors via First Street. Map © Google.
Why this score? — see what drove the B- grade
The composite is a weighted blend of 9 inputs, each scored 0–100. Each bar is that input's sub-score; the figure is the points it added to the 100-point composite (weight × sub-score).
- Cash flow +30.0/30.0
- DSCR +10.0/10.0
- 1% rule +9.7/10.0
- ARV discount +7.5/15.0
- Schools +4.0/10.0
- Livability +2.9/5.0
- Rent growth +2.5/5.0
- Condition / age +2.5/5.0
- Appreciation +0.0/10.0
$84,900
🖨 Deal sheet (PDF) 📄 Offer letter ✓ Due diligence
Listing remarks
Home is ready for your remodel—already down to the studs for someone who wants to make it their own.
Key facts
- 0.29 acre lot
- 2 garage spots
- Built 1900
Property features AI
Exterior
- Parking: Attached 2-car garage
- Utilities: City water connected; City sewer connected; Natural gas
- Home design: Residential property; One and one-half levels; Above-grade finished area 1,500; Below-grade area 890
- Construction: Foundation described as other; Foundation area 890
- Exterior features: Metal exterior
Interior
- Bedrooms: 4 bedrooms
- Bathrooms: 1 full bathroom
- Heating & cooling: Forced air heating; No cooling
- Interior features: Unfinished basement; Forced air heating; No central air
Neighborhood map
What this means for you Summary
Snapshot
- This is a 4-bed/1.0-bath single-family listed at $85k.
Deal economics
- At list price, monthly cash flow is $395 ($5k/yr) — positive.
- The deal already cash-flows at list — no discount required.
- Meets the 1% rule at list price ($1k rent vs $85k).
Location & tenants
- Location reads 57/100 on livability (#830 in MN) — a working-class tenant base; expect higher turnover. Strengths: cost of living A+, housing A+; Watch: crime D+, amenities F, commute F.
- St. Peter Public School District (town): math 44% / reading 48% proficiency, ranked #165 of 301 in MN (top 55%) — families likely to look elsewhere, expect single-tenant / working-renter base with shorter leases.
- Zoned schools: North Elementary School (math 62% / reading 46%, grade C, #352 of 857 statewide, top 41%, 383 students, 48% FRL); St. Peter Middle School (math 36% / reading 47%, grade F, #138 of 258 statewide, top 55%, 621 students, 45% FRL); St. Peter High School (math 42% / reading 62%, grade D+, #111 of 471 statewide, top 26%, 718 students, 39% FRL).
- Market conditions: 12 active listings in the ZIP; 60 units permitted in Le Sueur County in 2024 (0 in 5+ unit buildings).
Forward outlook
- Local home prices are declining (-3.0%/yr); year-one equity from $587 of loan paydown is wiped out by about $3k of value loss. Plan a longer hold.
- Le Sueur County population projected to shrink 8% by 2050 — rents likely to lag national; underwrite the cash flow, not the appreciation.
- At projected returns (-3.0% appreciation + 3.0% rent growth), your $24k cash investment doubles in ~7 years — after that, you're playing with house money.
Negotiation context
- Only 6 days on market — expect competitive offers; lowballing is unlikely to land.
Risks & watch-outs
- Watch-outs: built in 1900 — expect roof / HVAC / electrical / plumbing capex.
Questions for the listing agent
- Built in 1900 — when were the roof, HVAC, electrical panel, plumbing, and water heater last replaced?
- Is there a deadline driving the sale (1031 exchange, divorce, estate, relocation)? That informs how much negotiation room exists.
- Schools are F-rated, which usually means shorter tenancies and higher turnover. Who's the typical renter profile here, and what's been the actual vacancy rate?
- Crime grade is D in this area — have there been break-ins, vandalism, or insurance claims at this property in the last 3 years? What carrier currently insures it and at what premium?
- What's the average days-on-market for RENTAL listings here right now (not sales)? A rising rental-DOM trend means longer vacancies and softer asking-rent achievability than the comps imply.
- What's the recent tenant-quality profile in this submarket — average credit score on applications, eviction rate, late-payment / NSF rate, and stable-employment percentage? A property-management company in the area should have these aggregated.
- How much new for-sale + rental construction is in the pipeline within 1–3 miles? Heavy new supply typically softens prices + rents 12–24 months out; constrained supply supports both.
Investment metrics
- 1% rule
- 1.47% ✓
- Cap rate
- 11.87%
- Cash-on-cash
- 19.92%
- DSCR
- 1.89
- GRM
- 5.7
CMA / ARV
- ARV (median comp)
- $228,518
- List price
- $84,900
- Delta
- -62.85%
- Verdict
- UNDERPRICED
- Comps
- 8 within 1.0 mi
Show comp detail 1 sale within ~0.75 mi
| Address | Dist | Beds/Ba | Sqft | Sold | Price | $/sf | Match |
|---|---|---|---|---|---|---|---|
| 320 N Rice St | 0.31mi | 3/2.0 (-1) | 1,324 (+10%) | 11mo | $253,000 | $191 | 50 |
Match score weights: distance 35% · size 25% · config 20% · recency 20%. Top-matched comps best support the ARV.
Projected returns pro-forma
-3.0% appreciation · 3.0% rent growth · sell at horizon
- IRR
- 12.1%
- Equity multiple
- 1.48×
- Total profit
- $11,401
- Equity at exit
- $12,659
- IRR
- 21.0%
- Equity multiple
- 2.78×
- Total profit
- $42,385
- Equity at exit
- $7,341
Cash invested: $23,772 (down + closing). Projections, not guarantees.
Landlord ↔ Tenant lean methodology
- Overall (STATE)
- 46 Balanced
- State Minnesota
- 46 Balanced · D+2
- County
- — inherits STATE
- City
- — inherits STATE
ZIP-level market 56050
- Home prices YoY
- -13.8%
- Active inventory
- 12
- Price-to-rent
- 5.7×
Monthly cashflow live
- Estimated rent
- $1,249 medium interval (Pro) →
- Mortgage (P&I)
- −$445
- Tax from tax record
- −$112 /mo · $1,342/yr
- Insurance
- −$35
- HOA
- −$0
- Vacancy / Maint / Mgmt
- −$262
- Net cashflow
- $395
Break-even live
Sensitivity live
| Price | -10% $443 | -5% $419 | +0% $395 | +5% $371 | +10% $347 |
|---|---|---|---|---|---|
| Rent | -10% $296 | -5% $345 | +0% $395 | +5% $444 | +10% $493 |
| Rate | -1.0pp $437 | -0.5pp $416 | base $395 | +0.5pp $373 | +1.0pp $350 |
UW: 25.0% down · 7.5% · 30yr · 1.5% tax · 5.0% vac · 8.0% maint · 8.0% mgmt
Financing live
Cash to close
- Down payment
- $21,225
- Closing costs
- $2,547
- Reserves months
- —
- Total cash needed
- —
Loan-product check · same deal, 3 products live
Conventional
25% down · 7.5% · 30yr
- Down + closing
- —
- Monthly P&I
- —
- Monthly cashflow
- —
- DSCR
- —
- Eligible?
- —
Personal DTI + credit; lowest rate.
DSCR
20% down · 8.5% · 30yr
- Down + closing
- —
- Monthly P&I
- —
- Monthly cashflow
- —
- DSCR
- —
- Eligible?
- —
No personal income docs; deal must DSCR.
Hard money
10% down · 12.0% · 12mo
- Down + closing
- —
- Monthly P&I
- —
- Monthly cashflow
- —
- DSCR
- —
- Eligible?
- —
Short-term bridge; refi at stabilization.
Listing history 3 events
-
2026-05-07status Pending 106-char remark
-
2026-05-02$84,900 Active 106-char remark
-
2026-05-01historical $84,900 106-char remark
ⓘ Source: listings_history table (triggers on properties + properties_extension) + one-shot
backfill from property_details.listing_events for pre-trigger history.
Tax reassessment forecast MN · Partial reset (capped growth)
- Current annual tax
- $1,342 · $112/mo
- Projected year-2 tax
- $1,342 · $112/mo
- Expected delta
- $0/yr ($0/mo · 0.0%)
ⓘ Screening estimate from a state-policy table — verify with the county assessor before closing.
Climate risk First Street
- Flood 1/10 Low 0% chance over 30 yrs
- Wildfire 3/10 Moderate
- Heat 2/10 Low 7 d/yr ≥100°F today · 14 d/yr by 30 yrs out
- Wind 2/10 Low
- Air quality 2/10 Low 1 unhealthy d/yr today · 1 by 30 yrs out
Nearby sold comps map
Loading sold comps map…
Walkable amenities ~0.75 mi
Loading nearby amenities…
Taxation est. · year 1
- Rental income
- $14,994
- − Mortgage interest
- −$4,756
- − Property taxes
- −$1,342
- − Insurance
- −$424
- − Repairs & maintenance
- −$1,200
- − Management
- −$1,200
- − Depreciation
- −$2,470
- Taxable income
- $3,603
- Est. tax owed @ 24.0%
- −$865
- After-tax cash flow
- $3,871/yr
For passive investors: Depreciation is non-cash, so a rental often shows a tax loss while cash-flowing — sheltering income. Rental losses are passive: they offset passive income freely, and up to $25,000/yr can offset ordinary (W-2) income if you actively participate and your MAGI is under $100k (phasing out to $0 by $150k); unused losses carry forward. On sale, claimed depreciation is recaptured at up to 25%, and gains may owe capital-gains tax (a 1031 exchange can defer both). Figures are a year-1 estimate at your 24.0% rate — not tax advice; consult a CPA.
Schools (NCES district)
- District
- St. Peter Public School District
- NCES district ID
- 2733870
- Math proficiency
- 44% ▼ -14.00%
- Reading proficiency
- 48% ▼ -10.00%
- Median HH income
- $55,399
- Composite
- 39.98/100
- National rank
- #3831
- State rank
- #165 of 301 in MN
Livability — Kasota
- Score
- 57/100
- State rank
- #830
- US rank
- #21775
Category grades
Schools grade is shown separately in the Schools card above.
Census & demographics
- Census place
- Kasota, MN
- Population (ZIP)
- 1,367
Population outlook (Le Sueur County) Hauer SSP2
- Today (2025)
- 27,622 people
- By 2030
- 27,346 · -1.0%
- By 2040
- 26,451 · -4.2%
- By 2050
- 25,299 · -8.4%
- By 2075
- 23,188 · -16.1%
- By 2100
- 21,103 · -23.6%
Race, ethnicity, and origin ACS 2023
- Neighborhood character
- Predominantly White (93%)
- Race & ethnicity
- White 93% Black 3% Two or more races 2% Hispanic / Latino 2%
- Common ancestry
- Portuguese 12% Romanian 2% Lithuanian 1%
- Foreign-born
- 1% · Canada, Jamaica
- Languages at home
- 97% English-only · Russian/Polish/Slavic 1% Spanish 1% German/W. Germanic 1%
Political lean MEDSL · Le Sueur
- 2024 margin
- Solid R (+33.7) · D 32.4% · R 66.0% · Other 1.6%
- 2008→2024 swing
- -29.4pp toward R · 2008: -4.3pp · 2024: -33.7pp
- All cycles
- 2024: R+33.7 2020: R+30.3 2016: R+30.7 2012: R+6.5 2008: R+4.3
Not yet ingested
- Civics
- —
Market trends
- HPI YoY
- ▼ -29.03%
- Current HPI
- 181.4348
- Rent YoY
- —
- Metro
- —
- State GDP YoY
- ▲ 2.41%
- F500 in state
- 34
Industry mix (Fortune 500 HQ in MN)
| Industry | F500 HQs | Revenue |
|---|---|---|
| Healthcare | 2 | $407B |
|
||
| Retail | 2 | $150B |
|
||
| Consumer Goods | 2 | $32B |
|
||
| Industrial Machinery | 2 | $6B |
|
||
| Agriculture | 1 | $40B |
|
||
| Healthcare / Medical Devices | 1 | $32B |
|
||
Price history
+275.0% since first listed6 events — show timeline
- 2026-06-01 Sold (Public Records) $75,000 Public Records
- 2026-06-01 Sold (MLS) $75,000 NORTHSTARMLS as Distributed by MLS Grid
- 2026-05-07 Pending — NORTHSTARMLS as Distributed by MLS Grid
- 2026-05-02 Listed $84,900 NORTHSTARMLS as Distributed by MLS Grid
- 2026-05-01 Coming Soon $84,900 NORTHSTARMLS as Distributed by MLS Grid
- 2026-04-24 Sold (Public Records) $20,000 Public Records
Property tax history
+3.4%/yrLatest (2025): $1,342 · +9.5% YoY. Source: county tax records.
Cash-flow waterfall
monthlySold comps — $/sqft
last 12 mo · ≤1 miLoading sold comps…