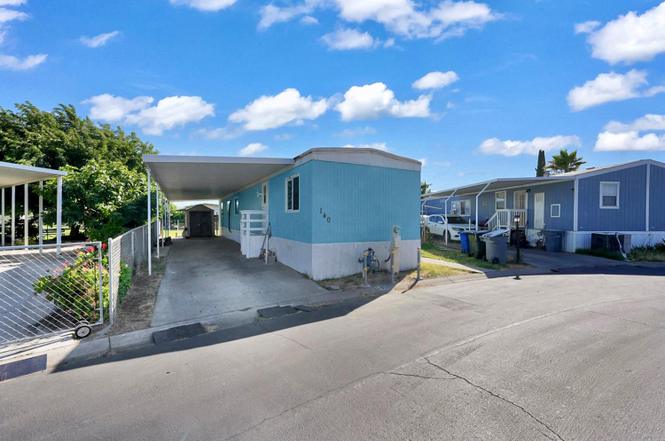
2499 E Gerard #140 · Merced, CA
Flood risk 7/10 · Major
- FEMA flood zone
- AO
- Chance of flooding over 30 yrs
- 0.76%
- Est. flood insurance / yr
- $848 – $2,087
Fire risk 7/10 · Major
- Est. fire insurance / yr
- $659 – $1,223
Heat risk 7/10 · Major
- Hot days now (above 104°F)
- 7 days/yr
- Hot days in 30 yrs
- 17 days/yr
Wind risk 1/10 · Minimal
- Chance of severe wind over 30 yrs
- —
Air-quality risk 10/10 · Severe
- Unhealthy air days now
- 38 days/yr
- Unhealthy air days in 30 yrs
- 40 days/yr
Risk factors via First Street. Map © Google.
Why this score? — see what drove the C+ grade
The composite is a weighted blend of 9 inputs, each scored 0–100. Each bar is that input's sub-score; the figure is the points it added to the 100-point composite (weight × sub-score).
- Cash flow +30.0/30.0
- 1% rule +10.0/10.0
- DSCR +10.0/10.0
- Livability +3.7/5.0
- Rent growth +2.9/5.0
- Schools +2.8/10.0
- ARV discount +2.5/15.0
- Condition / age +2.5/5.0
- Appreciation +0.0/10.0
$69,999
🖨 Deal sheet 📄 Offer letter ✓ Due diligence
Listing remarks MLS
Move In Ready Mobile!! This could be yours today, new carpet, new lino, fresh paint, tile counter top, new AC unit, stove, fridge, shed, covered patio, family park, easy freeway access, nearby schools Approx. Acreage: <1 Acre
Key facts
- Community pool
- Bike trails
- New development
Tags
Property features AI
Finance
- Other: Lot characteristics approximately 0-1 unit per acre; Living area reported from public records
- HOA & community: Land lease at $600/month
Exterior
- Parking: Two parking spaces; Two garage spaces
- Utilities: 220V electrical service throughout; Public sewer; District/public water
- Home design: Single-story mobile home (12 ft x 68 ft); Located in Merced Estates park, space 140; Entry faces front
- Construction: Mobile home remains on site; One story
- Exterior features: Community pool; Sidewalks
Interior
- Bedrooms: Single-level bedrooms (entry level 1)
- Bathrooms: One full bath with shower-in-tub
- Interior features: Front entry
- Laundry & utility: In-unit laundry available with stackable hookups
Neighborhood map
What this means for you Summary
Snapshot
- This is a 2-bed/1.0-bath manufactured listed at $70k.
Deal economics
- At list price, monthly cash flow is $565 ($7k/yr) — positive.
- The deal already cash-flows at list — no discount required.
- Meets the 1% rule at list price ($1k rent vs $70k).
- Cap rate 18.1% vs local median 3.4% in Merced — top-decile yield for the area; either an underpriced asset or a hidden risk that comps aren't pricing in. Stress-test before assuming the spread holds.
Location & tenants
- Location reads 73/100 on livability (#153 in CA) — a middle-class / working-renter tenant base. Strengths: amenities A+, commute A+, housing A+; Watch: schools D, employment D, crime F.
- Merced Union High (urban): math 20% / reading 46% proficiency, ranked #301 of 517 in CA (top 58%) — families likely to look elsewhere, expect single-tenant / working-renter base with shorter leases.
- Market conditions: Rents rising (+1.7%/yr); 170 active listings in the ZIP; 7 comparable units currently listed for rent nearby; rentals leasing fast (median 13d on market — plan ~1-2 weeks tenant-placement turnaround); 459 units permitted in Merced County in 2024 (0 in 5+ unit buildings).
- This rent runs 31% of the median local income ($57k/yr) — at the standard rent-burdened threshold; future hikes will face affordability resistance.
Forward outlook
- Local home prices are declining (-3.0%/yr); year-one equity from $484 of loan paydown is wiped out by about $2k of value loss. Plan a longer hold.
- Merced County population projected at +12% by 2050 — modest demand growth; plan on rents tracking national, not racing it.
- At projected returns (-3.0% appreciation + 1.7% rent growth), your $20k cash investment doubles in ~4 years — after that, you're playing with house money.
Negotiation context
- Only 2 days on market — expect competitive offers; lowballing is unlikely to land.
- 3 sale attempts since 23y ago with the ask held roughly flat each time — persistent listings suggest the price (not the market) is what's stuck; bring a comps-based counter.
- Current owner paid $17k; list at $70k implies a 312% gain — meaningful room to come down on a strong offer.
Risks & watch-outs
- Watch-outs: flood insurance adds $122/mo.
- Climate carrying-cost: in FEMA flood zone AO (mandatory federal flood insurance); major wildfire risk; extreme-heat days projected 7→17/yr by 2055 (HVAC capex compounding) — expect insurance premiums to compound above CPI over the hold.
Questions for the listing agent
- Built in 1977 — when were the roof, HVAC, electrical panel, plumbing, and water heater last replaced?
- What's the actual annual flood-insurance premium (NFIP or private), and is the property in a SFHA with mandatory coverage?
- Is there a deadline driving the sale (1031 exchange, divorce, estate, relocation)? That informs how much negotiation room exists.
- Schools are D-rated, which usually means shorter tenancies and higher turnover. Who's the typical renter profile here, and what's been the actual vacancy rate?
- Crime grade is F in this area — have there been break-ins, vandalism, or insurance claims at this property in the last 3 years? What carrier currently insures it and at what premium?
- What's the average days-on-market for RENTAL listings here right now (not sales)? A rising rental-DOM trend means longer vacancies and softer asking-rent achievability than the comps imply.
- What's the recent tenant-quality profile in this submarket — average credit score on applications, eviction rate, late-payment / NSF rate, and stable-employment percentage? A property-management company in the area should have these aggregated.
- How much new for-sale + rental construction is in the pipeline within 1–3 miles? Heavy new supply typically softens prices + rents 12–24 months out; constrained supply supports both.
Investment metrics
- 1% rule
- 2.12% ✓
- Cap rate
- 18.08%
- Cash-on-cash
- 42.11%
- DSCR
- 2.87
- GRM
- 3.9
CMA / ARV
- ARV (on-the-fly)
- $62,976
- Comps found
- 2
Show comp detail 2 sales within ~0.75 mi
| Address | Dist | Beds/Ba | Sqft | Sold | Price | $/sf | Match |
|---|---|---|---|---|---|---|---|
| 2499 East Gerard Ave #32 | 0.05mi | 2/1.5 | 720 (-6%) | 4mo | $59,000 | $82 | 82 |
| 2499 E Gerard Ave #96 | 0.11mi | 2/2.0 | 720 (-6%) | 6mo | $58,000 | $81 | 75 |
Match score weights: distance 35% · size 25% · config 20% · recency 20%. Top-matched comps best support the ARV.
Projected returns pro-forma
-3.0% appreciation · 1.68% rent growth · sell at horizon
- IRR
- 28.5%
- Equity multiple
- 2.16×
- Total profit
- $22,826
- Equity at exit
- $10,437
- IRR
- 35.1%
- Equity multiple
- 4.00×
- Total profit
- $58,880
- Equity at exit
- $6,052
Cash invested: $19,600 (down + closing). Projections, not guarantees.
Landlord ↔ Tenant lean methodology
- Overall (STATE)
- 18 Strongly Tenant-Friendly
- State California
- 18 Strongly Tenant-Friendly · D+13
- County
- — inherits STATE
- City
- — inherits STATE
ZIP-level market 95341
- Home prices YoY
- -29.2%
- Rents YoY
- 1.7%
- Active inventory
- 170
- Price-to-rent
- 3.9×
Monthly cashflow live
- Estimated rent
- $1,483 high interval (Pro) →
- Mortgage (P&I)
- −$367
- Tax est. 1.5%
- −$87 /mo · $1,050/yr
- Insurance
- −$29
- Flood insurance flood zone
- −$122 /mo · $1,468/yr
- HOA
- −$0
- Vacancy / Maint / Mgmt
- −$311
- Net cashflow
- $565
Break-even live
UW: 25.0% down · 7.5% · 30yr · 1.5% tax · 5.0% vac · 8.0% maint · 8.0% mgmt
Financing live
Cash to close
- Down payment
- $17,500
- Closing costs
- $2,100
- Reserves months
- —
- Total cash needed
- —
Loan-product check · same deal, 3 products live
Conventional
25% down · 7.5% · 30yr
- Down + closing
- —
- Monthly P&I
- —
- Monthly cashflow
- —
- DSCR
- —
- Eligible?
- —
Personal DTI + credit; lowest rate.
DSCR
20% down · 8.5% · 30yr
- Down + closing
- —
- Monthly P&I
- —
- Monthly cashflow
- —
- DSCR
- —
- Eligible?
- —
No personal income docs; deal must DSCR.
Hard money
10% down · 12.0% · 12mo
- Down + closing
- —
- Monthly P&I
- —
- Monthly cashflow
- —
- DSCR
- —
- Eligible?
- —
Short-term bridge; refi at stabilization.
Rent comps 7 comps
| Address | Beds | Baths | Sqft | Rent | $/sqft | DOM | Units | Dist |
|---|---|---|---|---|---|---|---|---|
| 134 S Parsons Ave Apt F Merced, CA | 1.0 | 1.0 | 600 | $1,195 | $1.99 | 13d | 1 | 0.50mi |
| 1532 Ellen Ct Unit 1532 Merced, CA | 2.0 | 1.0 | 840 | $1,200 | $1.43 | 13d | 1 | 0.75mi |
| 1557 Ellen Ct Unit 1557 Merced, CA | 2.0 | 1.0 | 756 | $1,200 | $1.59 | 13d | 1 | 0.78mi |
| Ellen Ct Merced, CA | 2.0 | 1.0 | 840 | $1,095 | $1.30 | 3d | 1 | 0.79mi |
| 1560 Ellen Ct Apt 4 Merced, CA | 2.0 | 1.0 | 750 | $1,200 | $1.60 | 13d | 1 | 0.79mi |
| 1976 Edwards Ave Unit 1 Merced, CA | 2.0 | 1.0 | 850 | $1,125 | $1.32 | 13d | 1 | 0.97mi |
| 2157 Yosemite Pkwy Unit 32 Merced, CA | 2.0 | 1.5 | 864 | $1,400 | $1.62 | 13d | 1 | 0.98mi |
Listing history 2 events
-
2026-06-18days on market $69,999 Active 2 DOM
-
2026-06-17$69,999 Active 1 DOM
ⓘ Source: listings_history table (triggers on properties + properties_extension) + one-shot
backfill from property_details.listing_events for pre-trigger history.
Climate risk First Street
- Flood 7/10 Severe FEMA zone AO · 76% chance over 30 yrs
- Wildfire 7/10 Severe
- Heat 7/10 Severe 7 d/yr ≥104°F today · 17 d/yr by 30 yrs out
- Wind 1/10 Low
- Air quality 10/10 Extreme 38 unhealthy d/yr today · 40 by 30 yrs out
Nearby sold comps map
Loading sold comps map…
Walkable amenities ~0.75 mi
Loading nearby amenities…
Taxation est. · year 1
- Rental income
- $17,795
- − Mortgage interest
- −$3,921
- − Property taxes
- −$1,050
- − Insurance
- −$1,817
- − Repairs & maintenance
- −$1,424
- − Management
- −$1,424
- − Depreciation
- −$2,036
- Taxable income
- $6,123
- Est. tax owed @ 24.0%
- −$1,470
- After-tax cash flow
- $5,316/yr
For passive investors: Depreciation is non-cash, so a rental often shows a tax loss while cash-flowing — sheltering income. Rental losses are passive: they offset passive income freely, and up to $25,000/yr can offset ordinary (W-2) income if you actively participate and your MAGI is under $100k (phasing out to $0 by $150k); unused losses carry forward. On sale, claimed depreciation is recaptured at up to 25%, and gains may owe capital-gains tax (a 1031 exchange can defer both). Figures are a year-1 estimate at your 24.0% rate — not tax advice; consult a CPA.
Schools (NCES district)
- District
- Merced Union High
- NCES district ID
- 0624660
- Math proficiency
- 20% ▲ 3.00%
- Reading proficiency
- 46% ▼ -1.00%
- Median HH income
- $44,977
- Composite
- 28.11/100
- National rank
- #6823
- State rank
- #301 of 517 in CA
Livability — Merced
- Score
- 73/100
- State rank
- #153
- US rank
- #5111
Category grades
Schools grade is shown separately in the Schools card above.
Census & demographics
- Census place
- Merced, CA
- County
- Merced County · 205,386 people
- City population
- 112,228
- Metro
- Merced, CA
- Population (ZIP)
- 36,385
- Household income
- $57,342
- Rent vs Own
- Severe rent burden
- 1419.0
Population outlook (Merced County) Hauer SSP2
- Today (2025)
- 285,501 people
- By 2030
- 293,437 · +2.8%
- By 2040
- 308,808 · +8.2%
- By 2050
- 321,011 · +12.4%
- By 2075
- 338,497 · +18.6%
- By 2100
- 330,493 · +15.8%
Race, ethnicity, and origin ACS 2023
- Neighborhood character
- Predominantly Hispanic (73%)
- Race & ethnicity
- Hispanic / Latino 73% White 12% Two or more races 11% Asian 8% Black 3%
- Hispanic origin (detail)
- Mexican 70%
- Common ancestry
- Russian 2%
- Foreign-born
- 30% · Canada
- Languages at home
- 37% English-only · Spanish 55% Other Asian/Pacific 6% Other Indo-European 1%
Political lean MEDSL · Merced
- 2024 margin
- Toss-up / Even · D 46.5% · R 50.9% · Other 2.6%
- 2008→2024 swing
- -12.7pp toward R · 2008: 8.3pp · 2024: -4.4pp
- All cycles
- 2024: R+4.4 2020: D+10.6 2016: D+7.9 2012: D+5.4 2008: D+8.3
Not yet ingested
- Civics
- —
Market trends
- HPI YoY
- ▼ -129.65%
- Current HPI
- 314.4223
- Rent YoY
- ▲ 1.68%
- Metro
- Merced, CA
- State GDP YoY
- ▲ 3.21%
- F500 in state
- 116
Industry mix (Fortune 500 HQ in CA)
| Industry | F500 HQs | Revenue |
|---|---|---|
| Technology | 27 | $1,492B |
|
||
| Financial Services | 3 | $174B |
|
||
| Retail | 3 | $44B |
|
||
| Insurance | 3 | $26B |
|
||
| Media / Entertainment | 2 | $115B |
|
||
| Pharmaceuticals / Biotech | 2 | $62B |
|
||
Price history
+259.0% since first listed5 events — show timeline
- 2026-06-16 Listed $69,999 CRMLS
- 2004-02-27 Listing Removed — CRMLS
- 2003-12-08 Sold (MLS) $17,000 CRMLS
- 2003-09-05 Listed $19,500 CRMLS
- 2003-08-27 Listed $19,500 CRMLS
Property tax history
-2.0%/yrLatest (2020): $132 · +1.9% YoY. Source: county tax records.
Cash-flow waterfall
monthlySold comps — $/sqft
last 12 mo · ≤1 miLoading sold comps…