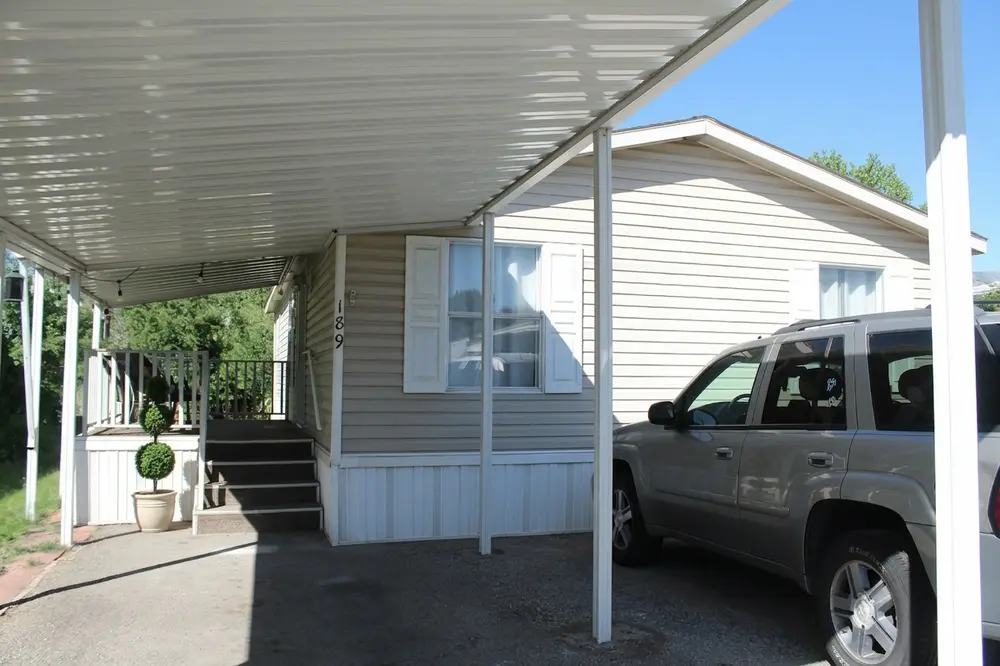
5100 S 1050 W · Riverdale, UT
Flood risk 1/10 · Minimal
- FEMA flood zone
- X (unshaded)
- Chance of flooding over 30 yrs
- 0.0%
- Est. flood insurance / yr
- $507 – $1,088
Fire risk 5/10 · Moderate
- Est. fire insurance / yr
- $453 – $841
Heat risk 4/10 · Minor
- Hot days now (above 93°F)
- 7 days/yr
- Hot days in 30 yrs
- 17 days/yr
Wind risk 1/10 · Minimal
- Chance of severe wind over 30 yrs
- —
Air-quality risk 4/10 · Minor
- Unhealthy air days now
- 4 days/yr
- Unhealthy air days in 30 yrs
- 5 days/yr
Risk factors via First Street. Map © Google.
Why this score? — see what drove the B grade
The composite is a weighted blend of 9 inputs, each scored 0–100. Each bar is that input's sub-score; the figure is the points it added to the 100-point composite (weight × sub-score).
- Cash flow +30.0/30.0
- 1% rule +10.0/10.0
- DSCR +10.0/10.0
- ARV discount +7.5/15.0
- Livability +4.0/5.0
- Rent growth +3.7/5.0
- Schools +3.2/10.0
- Condition / age +2.5/5.0
- Appreciation +0.0/10.0
$60,000
🖨 Deal sheet (PDF) 📄 Offer letter ✓ Due diligence
Listing remarks MLS
There are no remarks available.
Key facts
- Quick access to i-15
- 0.5 acre lot
- Built 2003
Tags
Property features AI
Exterior
- Home design: House; 960 square feet
- Exterior features: Half‑acre lot
Neighborhood map
What this means for you Summary
Snapshot
- This is a 3-bed/2.0-bath single-family listed at $60k.
Deal economics
- At list price, monthly cash flow is $1k ($13k/yr) — positive.
- The deal already cash-flows at list — no discount required.
- Meets the 1% rule at list price ($2k rent vs $60k).
- Recommended offer: $59k (1.5% below list) — sets the bar for market timing.
Location & tenants
- Location reads 81/100 on livability (#33 in UT, #1,547 nationally) — a professional / high-income tenant draw. Strengths: amenities A+, commute A+, housing A+; Watch: crime F.
- Weber District (suburban): math 36% / reading 35% proficiency, ranked #56 of 80 in UT (top 70%) — families likely to look elsewhere, expect single-tenant / working-renter base with shorter leases.
- Zoned schools: Washington Terrace School (math 33% / reading 36%, grade F, #395 of 585 statewide, top 69%, 493 students, 51% FRL); T.H. Bell Jr High (math 12% / reading 16%, grade F, #136 of 138 statewide, top 99%, 670 students, 42% FRL); Bonneville High (math 15% / reading 36%, grade F, #139 of 171 statewide, top 81%, 1,361 students, 29% FRL).
- Market conditions: Rents rising fast (+4.7%/yr); 215 active listings in the ZIP; 1 comparable units currently listed for rent nearby; solid renter incomes; 1,630 units permitted in Weber County in 2024 (521 in 5+ unit buildings).
Forward outlook
- Local home prices are declining (-3.0%/yr); year-one equity from $415 of loan paydown is wiped out by about $2k of value loss. Plan a longer hold.
- Weber County population projected at +24% by 2050 — long-run rental-demand tailwind backs the buy-and-hold thesis.
- At projected returns (-3.0% appreciation + 4.7% rent growth), your $17k cash investment doubles in ~2 years — after that, you're playing with house money.
Negotiation context
- It's been on market 17 days — a 2% lower offer ($59k) is reasonable based on typical stale-listing flexibility.
- 25 sale attempts since 29y ago with the ask held roughly flat each time — persistent listings suggest the price (not the market) is what's stuck; bring a comps-based counter.
Risks & watch-outs
- Climate carrying-cost: moderate wildfire risk — expect insurance premiums to compound above CPI over the hold.
Questions for the listing agent
- Is there a deadline driving the sale (1031 exchange, divorce, estate, relocation)? That informs how much negotiation room exists.
- Schools are D-rated, which usually means shorter tenancies and higher turnover. Who's the typical renter profile here, and what's been the actual vacancy rate?
- Crime grade is F in this area — have there been break-ins, vandalism, or insurance claims at this property in the last 3 years? What carrier currently insures it and at what premium?
- What's the average days-on-market for RENTAL listings here right now (not sales)? A rising rental-DOM trend means longer vacancies and softer asking-rent achievability than the comps imply.
- What's the recent tenant-quality profile in this submarket — average credit score on applications, eviction rate, late-payment / NSF rate, and stable-employment percentage? A property-management company in the area should have these aggregated.
- How much new for-sale + rental construction is in the pipeline within 1–3 miles? Heavy new supply typically softens prices + rents 12–24 months out; constrained supply supports both.
Investment metrics
- 1% rule
- 3.15% ✓
- Cap rate
- 27.85%
- Cash-on-cash
- 76.98%
- DSCR
- 4.43
- GRM
- 2.6
CMA / ARV
No comps found within radius.
Projected returns pro-forma
-3.0% appreciation · 4.67% rent growth · sell at horizon
- IRR
- 78.9%
- Equity multiple
- 4.70×
- Total profit
- $62,175
- Equity at exit
- $8,946
- IRR
- 82.8%
- Equity multiple
- 10.31×
- Total profit
- $156,345
- Equity at exit
- $5,188
Cash invested: $16,800 (down + closing). Projections, not guarantees.
Landlord ↔ Tenant lean methodology
- Overall (STATE)
- 86 Strongly Landlord-Friendly
- State Utah
- 86 Strongly Landlord-Friendly · R+15
- County
- — inherits STATE
- City
- — inherits STATE
ZIP-level market 84405
- Rents YoY
- 4.7%
- Active inventory
- 215
- Price-to-rent
- 2.6×
Monthly cashflow live
- Estimated rent
- $1,889 medium interval (Pro) →
- Mortgage (P&I)
- −$315
- Tax est. 1.5%
- −$75 /mo · $900/yr
- Insurance
- −$25
- HOA
- −$0
- Vacancy / Maint / Mgmt
- −$397
- Net cashflow
- $1,078
Break-even live
Sensitivity live
| Price | -10% $1,119 | -5% $1,098 | +0% $1,078 | +5% $1,057 | +10% $1,036 |
|---|---|---|---|---|---|
| Rent | -10% $929 | -5% $1,003 | +0% $1,078 | +5% $1,152 | +10% $1,227 |
| Rate | -1.0pp $1,108 | -0.5pp $1,093 | base $1,078 | +0.5pp $1,062 | +1.0pp $1,046 |
UW: 25.0% down · 7.5% · 30yr · 1.5% tax · 5.0% vac · 8.0% maint · 8.0% mgmt
Financing live
Cash to close
- Down payment
- $15,000
- Closing costs
- $1,800
- Reserves months
- —
- Total cash needed
- —
Loan-product check · same deal, 3 products live
Conventional
25% down · 7.5% · 30yr
- Down + closing
- —
- Monthly P&I
- —
- Monthly cashflow
- —
- DSCR
- —
- Eligible?
- —
Personal DTI + credit; lowest rate.
DSCR
20% down · 8.5% · 30yr
- Down + closing
- —
- Monthly P&I
- —
- Monthly cashflow
- —
- DSCR
- —
- Eligible?
- —
No personal income docs; deal must DSCR.
Hard money
10% down · 12.0% · 12mo
- Down + closing
- —
- Monthly P&I
- —
- Monthly cashflow
- —
- DSCR
- —
- Eligible?
- —
Short-term bridge; refi at stabilization.
Rent comps 1 comps
| Address | Beds | Baths | Sqft | Rent | $/sqft | DOM | Units | Dist |
|---|---|---|---|---|---|---|---|---|
| 918 W 4350 S Ogden, UT | 4.0 | 1.5 | 1800 | $2,350 | $1.31 | 25d | 1 | 1.02mi |
Listing history 12 events
-
2026-06-22days on market $60,000 Active 17 DOM
-
2026-06-18days on market $60,000 Active 14 DOM
-
2026-06-17days on market $60,000 Active 13 DOM
-
2026-06-16days on market $60,000 Active 12 DOM
-
2026-06-15days on market $60,000 Active 11 DOM
-
2026-06-14days on market $60,000 Active 9 DOM
-
2026-06-10days on market $60,000 Active 6 DOM
-
2026-06-09days on market $60,000 Active 5 DOM
-
2026-06-08days on market $60,000 Active 4 DOM
-
2026-06-07days on market $60,000 Active 3 DOM
-
2026-06-05remarks 699-char remark
-
2026-06-05$60,000 Active 1 DOM
ⓘ Source: listings_history table (triggers on properties + properties_extension) + one-shot
backfill from property_details.listing_events for pre-trigger history.
Climate risk First Street
- Flood 1/10 Low FEMA zone X (unshaded) · 0% chance over 30 yrs
- Wildfire 5/10 Major
- Heat 4/10 Moderate 7 d/yr ≥93°F today · 17 d/yr by 30 yrs out
- Wind 1/10 Low
- Air quality 4/10 Moderate 4 unhealthy d/yr today · 5 by 30 yrs out
Nearby sold comps map
Loading sold comps map…
Walkable amenities ~0.75 mi
Loading nearby amenities…
Taxation est. · year 1
- Rental income
- $22,669
- − Mortgage interest
- −$3,361
- − Property taxes
- −$900
- − Insurance
- −$300
- − Repairs & maintenance
- −$1,814
- − Management
- −$1,814
- − Depreciation
- −$1,745
- Taxable income
- $12,736
- Est. tax owed @ 24.0%
- −$3,057
- After-tax cash flow
- $9,876/yr
For passive investors: Depreciation is non-cash, so a rental often shows a tax loss while cash-flowing — sheltering income. Rental losses are passive: they offset passive income freely, and up to $25,000/yr can offset ordinary (W-2) income if you actively participate and your MAGI is under $100k (phasing out to $0 by $150k); unused losses carry forward. On sale, claimed depreciation is recaptured at up to 25%, and gains may owe capital-gains tax (a 1031 exchange can defer both). Figures are a year-1 estimate at your 24.0% rate — not tax advice; consult a CPA.
Schools (NCES district)
- District
- Weber District
- NCES district ID
- 4901200
- Math proficiency
- 36% ▼ -4.00%
- Reading proficiency
- 35% ▼ -5.00%
- Median HH income
- $65,750
- Composite
- 32.28/100
- National rank
- #5757
- State rank
- #56 of 80 in UT
Livability — Riverdale
- Score
- 81/100
- State rank
- #33
- US rank
- #1547
Category grades
Schools grade is shown separately in the Schools card above.
Census & demographics
- Census place
- Riverdale, UT
- County
- Weber County · 260,557 people
- Metro
- Ogden-Clearfield, UT
- Population (ZIP)
- 34,818
- Household income
- $84,106
- Rent vs Own
- Severe rent burden
- 693.0
Population outlook (Weber County) Hauer SSP2
- Today (2025)
- 274,329 people
- By 2030
- 288,577 · +5.2%
- By 2040
- 314,848 · +14.8%
- By 2050
- 338,710 · +23.5%
- By 2075
- 384,412 · +40.1%
- By 2100
- 409,305 · +49.2%
Race, ethnicity, and origin ACS 2023
- Neighborhood character
- Predominantly White (79%)
- Race & ethnicity
- White 79% Hispanic / Latino 13% Two or more races 7% Asian 2% Black 1%
- Hispanic origin (detail)
- Mexican 11%
- Common ancestry
- Italian 5% Iranian 3% Slovak 2%
- Foreign-born
- 5% · Canada
- Languages at home
- 89% English-only · Spanish 8% Other Indo-European 1% Other Asian/Pacific 1%
Political lean MEDSL · Weber
- 2024 margin
- Strong R (+23.5) · D 36.8% · R 60.3% · Other 2.9%
- 2008→2024 swing
- +4.1pp toward D · 2008: -27.6pp · 2024: -23.5pp
- All cycles
- 2024: R+23.5 2020: R+22.7 2016: R+20.0 2012: R+46.0 2008: R+27.6
Not yet ingested
- Civics
- —
Market trends
- HPI YoY
- ▼ -253.19%
- Current HPI
- 288.6978
- Rent YoY
- ▲ 4.67%
- Metro
- Ogden-Clearfield, UT
- State GDP YoY
- ▲ 3.54%
- F500 in state
- 2
Industry mix (Fortune 500 HQ in UT)
| Industry | F500 HQs | Revenue |
|---|---|---|
| Financial Services | 1 | $3B |
|
||
Price history
+201.5% since first listed56 events — show timeline
- 2026-06-04 Listed $60,000 ForSaleByOwner.com
- 2025-05-22 Listing Removed — WFRMLS
- 2025-04-16 Listed $40,000 WFRMLS
- 2020-12-11 Sold (MLS) — WFRMLS
- 2020-11-13 Pending — WFRMLS
- 2020-10-27 Relisted — WFRMLS
- 2020-10-07 Pending — WFRMLS
- 2020-09-25 Price Changed $42,000 WFRMLS
- 2020-09-04 Price Changed $46,000 WFRMLS
- 2020-09-04 Listed $4,600 WFRMLS
- 2019-04-04 Sold (MLS) — WFRMLS
- 2019-03-09 Contingent — WFRMLS
- 2019-01-18 Listed $28,000 WFRMLS
- 2013-04-29 Sold (Public Records) — Public Records
- 2009-06-01 Sold (MLS) — WFRMLS
- 2009-04-21 Listed $30,000 WFRMLS
- 2009-02-20 Listing Removed — WFRMLS
- 2008-05-01 Listing Removed — WFRMLS
- 2008-02-20 Listed $30,000 WFRMLS
- 2007-12-10 Listed $45,000 WFRMLS
- 2007-05-09 Listing Removed — WFRMLS
- 2007-01-18 Listed $9,000 WFRMLS
- 2006-02-15 Listing Removed — WFRMLS
- 2006-02-06 Listing Removed — WFRMLS
- 2006-02-04 Listed $153,500 WFRMLS
- 2006-01-18 Listed $153,500 WFRMLS
- 2005-02-05 Listing Removed — WFRMLS
- 2004-11-05 Listed $199,900 WFRMLS
- 2002-10-18 Listing Removed — WFRMLS
- 2002-09-30 Listing Removed — WFRMLS
- 2002-07-23 Listing Removed — WFRMLS
- 2002-07-04 Listing Removed — WFRMLS
- 2002-05-21 Sold (Public Records) — Public Records
- 2002-04-18 Listed $13,250 WFRMLS
- 2002-03-13 Listing Removed — WFRMLS
- 2002-03-07 Listed $39,900 WFRMLS
- 2002-01-23 Listed $15,000 WFRMLS
- 2002-01-04 Listing Removed — WFRMLS
- 2001-11-30 Listing Removed — WFRMLS
- 2001-10-04 Listed $13,250 WFRMLS
- 2001-07-04 Listed $10,500 WFRMLS
- 2001-04-16 Listed $19,900 WFRMLS
- 2001-04-01 Listing Removed — WFRMLS
- 2001-03-13 Listed $24,900 WFRMLS
- 2001-03-12 Listing Removed — WFRMLS
- 2001-02-06 Listed $16,000 WFRMLS
- 2001-01-05 Listed $18,000 WFRMLS
- 2000-09-28 Sold (Public Records) — Public Records
- 2000-09-28 Sold (Public Records) — Public Records
- 2000-05-18 Listing Removed — WFRMLS
- 2000-05-17 Listed $26,500 WFRMLS
- 1999-10-08 Sold (MLS) — WFRMLS
- 1999-06-02 Listed $19,000 WFRMLS
- 1998-06-08 Listing Removed — WFRMLS
- 1998-04-08 Listed $70,000 WFRMLS
- 1997-04-21 Listed $19,900 WFRMLS
Property tax history
-1.5%/yrLatest (2017): $32,938 · -1.1% YoY. Source: county tax records.
Cash-flow waterfall
monthlySold comps — $/sqft
last 12 mo · ≤1 miLoading sold comps…