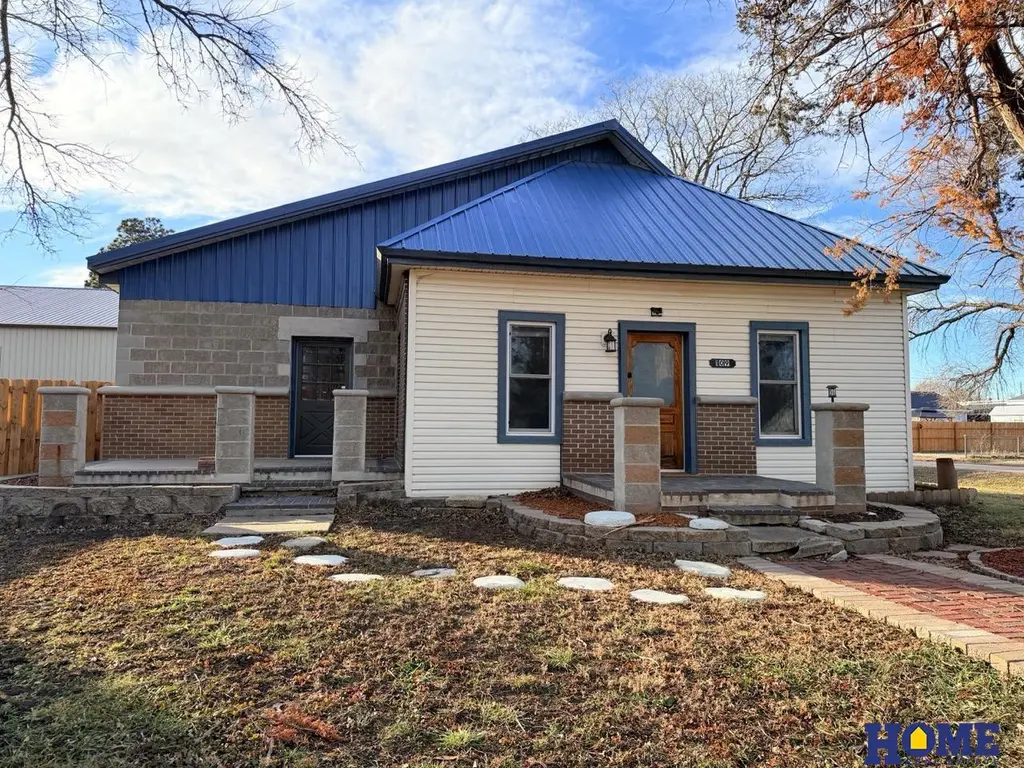
109 Ryan St · Garland, NE
Flood risk 1/10 · Minimal
- FEMA flood zone
- X (unshaded)
- Chance of flooding over 30 yrs
- 0.0%
- Est. flood insurance / yr
- $507 – $1,088
Fire risk 7/10 · Major
- Est. fire insurance / yr
- $1,161 – $2,155
Heat risk 3/10 · Minor
- Hot days now (above 104°F)
- 7 days/yr
- Hot days in 30 yrs
- 16 days/yr
Wind risk 2/10 · Minimal
- Chance of severe wind over 30 yrs
- —
Air-quality risk 1/10 · Minimal
- Unhealthy air days now
- 0 days/yr
- Unhealthy air days in 30 yrs
- 0 days/yr
Risk factors via First Street. Map © Google.
Why this score? — see what drove the C- grade
The composite is a weighted blend of 9 inputs, each scored 0–100. Each bar is that input's sub-score; the figure is the points it added to the 100-point composite (weight × sub-score).
- ARV discount +12.8/15.0
- Cash flow +12.6/30.0
- Schools +5.9/10.0
- Appreciation +5.0/10.0
- DSCR +3.8/10.0
- Livability +3.2/5.0
- 1% rule +2.9/10.0
- Rent growth +2.5/5.0
- Condition / age +2.5/5.0
$199,000
🖨 Deal sheet 📄 Offer letter ✓ Due diligence
Listing remarks MLS
This beautifully remodeled 3-bed, 2-bath home at 109 Ryan St., Garland, NE offers exceptional quality, durability, and full accessibility throughout. Designed for wheelchair access, it features zero-step entry from van-height parking to all four exterior doors with smooth roll-in access from frost-free concrete/brick porches. Inside are wide 3-0 doors, an open floor plan, and barrier-free transitions. The main-floor primary suite includes a 16’ x 30’ reinforced tornado-safe room, roll-in tile shower, and zero-threshold bath with generous turning space. The kitchen offers accessible work areas, roll-friendly pantry, and stainless appliances. Main-floor laundry adds convenience. Upgrades include a new 50-year roof, new windows, updated plumbing and electrical, propane heat, and city water. Seller will add a front ramp or build a van-accessible garage upon request. Ideal for ADA-style, step-free, low-maintenance living.
Key facts
- Wheelchair access
- Open floor plan
- Zero-step entry
Tags
Neighborhood map
What this means for you Summary
Snapshot
- This is a 3-bed/2.0-bath single-family listed at $199k.
Deal economics
- At list price, monthly cash flow is $-25 ($-296/yr) — negative.
- To cash-flow at today's rent, offer at most $195k (2.2% below list).
- To meet the 1% rule (rent ≥ 1% of price), the offer needs to be $158k (20.6% below list).
- Recommended offer: $158k (20.6% below list) — sets the bar for 1% rule.
Location & tenants
- Location reads 64/100 on livability (#371 in NE) — a middle-class / working-renter tenant base. Strengths: cost of living A+, housing A+; Watch: health & safety C-, schools D-, amenities F.
- Seward Public Schools (town): math 73% / reading 63% proficiency, ranked #5 of 111 in NE (top 4%) — acceptable for families but not a draw, mixed tenant base, ~2y average lease; only 16% free/reduced lunch — higher-income household profile.
- Market conditions: 4 active listings in the ZIP; 94 units permitted in Seward County in 2024 (48 in 5+ unit buildings).
Forward outlook
- In year one you build about $1k of equity ($1k loan paydown + $-55 appreciation (-0.0% local appreciation)).
Negotiation context
- It's been on market 75 days — a 6% lower offer ($187k) is reasonable based on typical stale-listing flexibility.
- 9 sale attempts since 7y ago with the ask held roughly flat each time — persistent listings suggest the price (not the market) is what's stuck; bring a comps-based counter.
- Current owner paid $22k; list at $199k implies a 826% gain — meaningful room to come down on a strong offer.
Risks & watch-outs
- Watch-outs: built in 1900 — expect roof / HVAC / electrical / plumbing capex.
- Climate carrying-cost: major wildfire risk — expect insurance premiums to compound above CPI over the hold.
Questions for the listing agent
- What do current leases actually rent for vs. the listed asking? Can we see a recent rent roll and the last 12 months of T-12 income?
- It's been on market 75 days. Have you received any prior offers? Is the seller open to a 21% concession, seller financing, or rate buy-down credit?
- Built in 1900 — when were the roof, HVAC, electrical panel, plumbing, and water heater last replaced?
- Why hasn't it sold? Are there any deal-killer items the seller is aware of (foundation, flood, title, zoning, code violations)?
- Is there a deadline driving the sale (1031 exchange, divorce, estate, relocation)? That informs how much negotiation room exists.
- Schools are D-rated, which usually means shorter tenancies and higher turnover. Who's the typical renter profile here, and what's been the actual vacancy rate?
- What's the average days-on-market for RENTAL listings here right now (not sales)? A rising rental-DOM trend means longer vacancies and softer asking-rent achievability than the comps imply.
- What's the recent tenant-quality profile in this submarket — average credit score on applications, eviction rate, late-payment / NSF rate, and stable-employment percentage? A property-management company in the area should have these aggregated.
- How much new for-sale + rental construction is in the pipeline within 1–3 miles? Heavy new supply typically softens prices + rents 12–24 months out; constrained supply supports both.
Investment metrics
- 1% rule
- 0.79% ✗
- Cap rate
- 6.14%
- Cash-on-cash
- -0.53%
- DSCR
- 0.98
- GRM
- 10.5
CMA / ARV
- ARV (median comp)
- $225,750
- List price
- $199,000
- Delta
- -11.85%
- Verdict
- UNDERPRICED
- Comps
- 3 within 1.0 mi
Show comp detail 1 sale within ~0.75 mi
| Address | Dist | Beds/Ba | Sqft | Sold | Price | $/sf | Match |
|---|---|---|---|---|---|---|---|
| 642 Frazier St | 0.32mi | 2/2.0 (-1) | 1,326 (-3%) | 20mo | $217,000 | $164 | 58 |
Match score weights: distance 35% · size 25% · config 20% · recency 20%. Top-matched comps best support the ARV.
Projected returns pro-forma
-0.03% appreciation · 3.0% rent growth · sell at horizon
- IRR
- -2.9%
- Equity multiple
- 0.86×
- Total profit
- $-7,690
- Equity at exit
- $57,508
- IRR
- 2.8%
- Equity multiple
- 1.30×
- Total profit
- $16,938
- Equity at exit
- $68,908
Cash invested: $55,720 (down + closing). Projections, not guarantees.
Landlord ↔ Tenant lean methodology
- Overall (STATE)
- 83 Strongly Landlord-Friendly
- State Nebraska
- 83 Strongly Landlord-Friendly · R+13
- County
- — inherits STATE
- City
- — inherits STATE
ZIP-level market 68360
- Home prices YoY
- -0.0%
- Active inventory
- 4
- Price-to-rent
- 10.5×
Monthly cashflow live
- Estimated rent
- $1,580 medium interval (Pro) →
- Mortgage (P&I)
- −$1,044
- Tax from tax record
- −$146 /mo · $1,757/yr
- Insurance
- −$83
- HOA
- −$0
- Vacancy / Maint / Mgmt
- −$332
- Net cashflow
- $-25
Break-even live
UW: 25.0% down · 7.5% · 30yr · 1.5% tax · 5.0% vac · 8.0% maint · 8.0% mgmt
Financing live
Cash to close
- Down payment
- $49,750
- Closing costs
- $5,970
- Reserves months
- —
- Total cash needed
- —
Loan-product check · same deal, 3 products live
Conventional
25% down · 7.5% · 30yr
- Down + closing
- —
- Monthly P&I
- —
- Monthly cashflow
- —
- DSCR
- —
- Eligible?
- —
Personal DTI + credit; lowest rate.
DSCR
20% down · 8.5% · 30yr
- Down + closing
- —
- Monthly P&I
- —
- Monthly cashflow
- —
- DSCR
- —
- Eligible?
- —
No personal income docs; deal must DSCR.
Hard money
10% down · 12.0% · 12mo
- Down + closing
- —
- Monthly P&I
- —
- Monthly cashflow
- —
- DSCR
- —
- Eligible?
- —
Short-term bridge; refi at stabilization.
Listing history 34 events
-
2026-06-18days on market $199,000 Active 75 DOM
-
2026-06-17days on market $199,000 Active 74 DOM
-
2026-06-16days on market $199,000 Active 73 DOM
-
2026-06-15days on market $199,000 Active 72 DOM
-
2026-06-14days on market $199,000 Active 70 DOM
-
2026-06-10days on market $199,000 Active 67 DOM
-
2026-06-09days on market $199,000 Active 66 DOM
-
2026-06-08days on market $199,000 Active 65 DOM
-
2026-06-07days on market $199,000 Active 64 DOM
-
2026-06-03days on market $199,000 Active 60 DOM
-
2026-06-02days on market $199,000 Active 59 DOM
-
2026-06-01days on market $199,000 Active 58 DOM
-
2026-05-31days on market $199,000 Active 57 DOM
-
2026-05-30days on market $199,000 Active 56 DOM
-
2026-04-04$199,000 New 942-char remark
Show marketing remark (942 chars)
This beautifully remodeled 3-bed, 2-bath home at 109 Ryan St., Garland, NE offers exceptional quality, durability, and full accessibility throughout. Designed for wheelchair access, it features zero-step entry from van-height parking to all four exterior doors with smooth roll-in access from frost-free concrete/brick porches. Inside are wide 3-0 doors, an open floor plan, and barrier-free transitions. The main-floor primary suite includes a 16’ x 30’ reinforced tornado-safe room, roll-in tile shower, and zero-threshold bath with generous turning space. The kitchen offers accessible work areas, roll-friendly pantry, and stainless appliances. Main-floor laundry adds convenience. Upgrades include a new 50-year roof, new windows, updated plumbing and electrical, propane heat, and city water. Seller will add a front ramp or build a van-accessible garage upon request. Ideal for ADA-style, step-free, low-maintenance living.
-
2026-03-20status Pending
-
2026-03-19historical
-
2026-02-20$199,000 New
-
2026-02-20historical
-
2026-01-15$209,900 New
-
2026-01-01historical
-
2025-11-06$210,000 New
-
2025-11-06historical
-
2025-09-29$210,000 New
-
2025-09-29historical
-
2025-08-21$200,000 New
-
2025-08-01historical
-
2025-03-07price $238,000
-
2025-02-04$248,900 New
-
2020-04-06historical
-
2020-02-01$63,500
-
2020-01-01historical
-
2019-08-04$72,500
-
2004-09-01soldstatus $21,500
ⓘ Source: listings_history table (triggers on properties + properties_extension) + one-shot
backfill from property_details.listing_events for pre-trigger history.
Tax reassessment forecast NE · Resets to sale price
- Current annual tax
- $1,757 · $146/mo
- Projected year-2 tax
- $3,443 · $287/mo
- Expected delta
- +$1,685/yr (+$140/mo · 95.9%)
ⓘ Screening estimate from a state-policy table — verify with the county assessor before closing.
Climate risk First Street
- Flood 1/10 Low FEMA zone X (unshaded) · 0% chance over 30 yrs
- Wildfire 7/10 Severe
- Heat 3/10 Moderate 7 d/yr ≥104°F today · 16 d/yr by 30 yrs out
- Wind 2/10 Low
- Air quality 1/10 Low 0 unhealthy d/yr today · 0 by 30 yrs out
Nearby sold comps map
Loading sold comps map…
Walkable amenities ~0.75 mi
Loading nearby amenities…
Taxation est. · year 1
- Rental income
- $18,961
- − Mortgage interest
- −$11,147
- − Property taxes
- −$1,757
- − Insurance
- −$995
- − Repairs & maintenance
- −$1,517
- − Management
- −$1,517
- − Depreciation
- −$5,789
- Taxable loss
- −$3,761
- Est. tax savings @ 24.0%
- +$903
- After-tax cash flow
- $607/yr
For passive investors: Depreciation is non-cash, so a rental often shows a tax loss while cash-flowing — sheltering income. Rental losses are passive: they offset passive income freely, and up to $25,000/yr can offset ordinary (W-2) income if you actively participate and your MAGI is under $100k (phasing out to $0 by $150k); unused losses carry forward. On sale, claimed depreciation is recaptured at up to 25%, and gains may owe capital-gains tax (a 1031 exchange can defer both). Figures are a year-1 estimate at your 24.0% rate — not tax advice; consult a CPA.
Schools (NCES district)
- District
- Seward Public Schools
- NCES district ID
- 3176560
- Math proficiency
- 73% ▼ -1.00%
- Reading proficiency
- 63% ▼ -8.00%
- Median HH income
- $61,041
- Composite
- 58.82/100
- National rank
- #975
- State rank
- #5 of 111 in NE
Livability — Garland
- Score
- 64/100
- State rank
- #371
- US rank
- #13771
Category grades
Schools grade is shown separately in the Schools card above.
Census & demographics
- Census place
- Garland, NE
- Population (ZIP)
- 394
Population outlook (Seward County) Hauer SSP2
- Today (2025)
- 17,435 people
- By 2030
- 17,568 · +0.8%
- By 2040
- 17,692 · +1.5%
- By 2050
- 17,709 · +1.6%
- By 2075
- 18,052 · +3.5%
- By 2100
- 18,296 · +4.9%
Race, ethnicity, and origin ACS 2023
- Neighborhood character
- Predominantly White (98%)
- Race & ethnicity
- White 98% Hispanic / Latino 2%
- Common ancestry
- Romanian 4% Portuguese 2% Russian 2%
- Languages at home
- 96% English-only · Spanish 4% German/W. Germanic 1%
Political lean MEDSL · Seward
- 2024 margin
- Solid R (+46.6) · D 26.0% · R 72.6% · Other 1.4%
- 2008→2024 swing
- -20.8pp toward R · 2008: -25.8pp · 2024: -46.6pp
- All cycles
- 2024: R+46.6 2020: R+44.0 2016: R+46.0 2012: R+34.7 2008: R+25.8
Not yet ingested
- Civics
- —
Market trends
- HPI YoY
- ▬ -0.03%
- Current HPI
- 200.5187
- Rent YoY
- —
- Metro
- —
- State GDP YoY
- ▲ 0.68%
- F500 in state
- 2
Industry mix (Fortune 500 HQ in NE)
| Industry | F500 HQs | Revenue |
|---|---|---|
| Conglomerate | 1 | $371B |
|
||
Price history
+825.6% since first listed20 events — show timeline
- 2026-04-04 Listed $199,000 GPRMLS
- 2026-03-20 Pending — GPRMLS
- 2026-03-19 Listing Removed — GPRMLS
- 2026-02-20 Listing Removed — GPRMLS
- 2026-02-20 Listed $199,000 GPRMLS
- 2026-01-15 Listed $209,900 GPRMLS
- 2026-01-01 Listing Removed — GPRMLS
- 2025-11-06 Listing Removed — GPRMLS
- 2025-11-06 Listed $210,000 GPRMLS
- 2025-09-29 Listing Removed — GPRMLS
- 2025-09-29 Listed $210,000 GPRMLS
- 2025-08-21 Listed $200,000 GPRMLS
- 2025-08-01 Listing Removed — GPRMLS
- 2025-03-07 Price Changed $238,000 GPRMLS
- 2025-02-04 Listed $248,900 GPRMLS
- 2020-04-06 Listing Removed — GPRMLS
- 2020-02-01 Listed $63,500 GPRMLS
- 2020-01-01 Listing Removed — GPRMLS
- 2019-08-04 Listed $72,500 GPRMLS
- 2004-09-01 Sold (Public Records) $21,500 Public Records
Property tax history
+7.5%/yrLatest (2025): $1,757 · +92.8% YoY. Source: county tax records.
Cash-flow waterfall
monthlySold comps — $/sqft
last 12 mo · ≤1 miLoading sold comps…