3482 Westcrest Rd · West Valley City, UT
Flood risk 5/10 · Moderate
- FEMA flood zone
- X (unshaded)
- Chance of flooding over 30 yrs
- 0.51%
- Est. flood insurance / yr
- $507 – $1,088
Fire risk 1/10 · Minimal
- Est. fire insurance / yr
- $453 – $841
Heat risk 4/10 · Minor
- Hot days now (above 95°F)
- 7 days/yr
- Hot days in 30 yrs
- 19 days/yr
Wind risk 1/10 · Minimal
- Chance of severe wind over 30 yrs
- —
Air-quality risk 3/10 · Minor
- Unhealthy air days now
- 3 days/yr
- Unhealthy air days in 30 yrs
- 4 days/yr
Risk factors via First Street. Map © Google.
Why this score? — see what drove the F grade
The composite is a weighted blend of 9 inputs, each scored 0–100. Each bar is that input's sub-score; the figure is the points it added to the 100-point composite (weight × sub-score).
- 1% rule +10.0/10.0
- ARV discount +7.5/15.0
- Livability +3.8/5.0
- Schools +2.6/10.0
- Rent growth +2.3/5.0
- Condition / age +2.2/5.0
- Cash flow +0.0/30.0
- DSCR +0.0/10.0
- Appreciation +0.0/10.0
$40,000
🖨 Deal sheet (PDF) 📄 Offer letter ✓ Due diligence
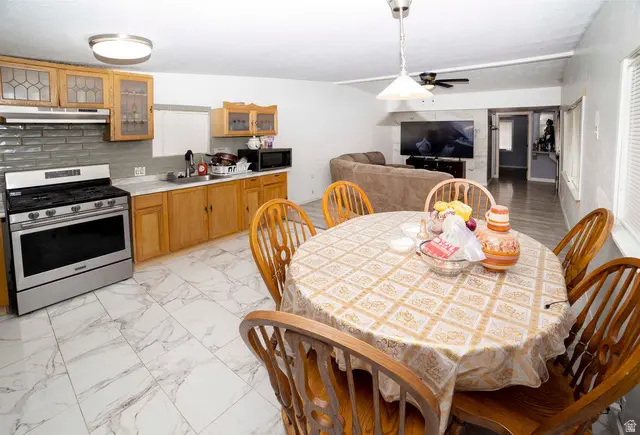
Listing remarks
Check out this lovely mobile home conveniently located near schools, parks, and shopping with easy access to the freeway.
Key facts
- Near schools
- Near shopping
- Near parks
Tags
Property features AI
Finance
- HOA & community: Homeowners association with a monthly fee of $820; Association covers sewer and trash
Exterior
- Utilities: Natural gas connected; Electricity connected; Sewer connected; Culinary water
- Home design: Southwest architectural style; Residential, multi-family zoning; Built and currently standing
- Construction: Aluminum exterior construction
- Exterior features: Asphalt roof
Interior
- Bedrooms: 2 bedrooms on the main level
- Flooring: Carpet; Tile
- Bathrooms: 2 full bathrooms
- Heating & cooling: Forced air heating; Evaporative cooling
- Interior features: Blinds; 7 total rooms; No basement
Neighborhood map
What this means for you Summary
Snapshot
- This is a 2-bed/2.0-bath manufactured listed at $40k. Condition is rated fair.
Deal economics
- At list price, monthly cash flow is $-267 ($-3k/yr) — negative.
- To cash-flow at today's rent, offer at most $1k (96.4% below list).
- Meets the 1% rule at list price ($1k rent vs $40k).
- Recommended offer: $1k (96.4% below list) — sets the bar for cash-flow.
Location & tenants
- Location reads 76/100 on livability (#55 in UT, #3,285 nationally) — a middle-class / working-renter tenant base. Strengths: commute A+, housing A+, employment A-; Watch: crime D-, amenities F, health & safety D-.
- Granite District (suburban): math 26% / reading 32% proficiency, ranked #69 of 80 in UT (top 86%) — low school quality limits family demand, transient renter base, plan for 1-2y turnover.
- Zoned schools: Monroe School (math 20% / reading 26%, grade F, #501 of 585 statewide, top 86%, 563 students, 81% FRL); West Lake Jr High (math 14% / reading 22%, grade F, #132 of 138 statewide, top 96%, 701 students, 73% FRL); Granger High (math 7% / reading 22%, grade F, #167 of 171 statewide, top 98%, 3,481 students, 63% FRL) — zoned schools average 72% FRL vs 45% district-wide (27 pts higher); higher-poverty schools than district average — tighter screening recommended.
- Market conditions: Rents soft (-0.8%/yr); 154 active listings in the ZIP; 20 comparable units currently listed for rent nearby; rentals at typical pace (median 19d on market — plan ~3-4 weeks tenant-placement turnaround); solid renter incomes; 4,970 units permitted in Salt Lake County in 2024 (1,963 in 5+ unit buildings).
- This rent is only 13% of the median local income ($94k/yr) — well below the 30% rent-burden line; pricing power to push rent on renewal without tenant pushback.
Forward outlook
- Local home prices are declining (-3.0%/yr); year-one equity from $277 of loan paydown is wiped out by about $1k of value loss. Plan a longer hold.
- Salt Lake County population projected at +37% by 2050 — long-run rental-demand tailwind backs the buy-and-hold thesis.
Negotiation context
- It's been on market 24 days — a 2% lower offer ($39k) is reasonable based on typical stale-listing flexibility.
- 6 sale attempts since 3y ago with the ask held roughly flat each time — persistent listings suggest the price (not the market) is what's stuck; bring a comps-based counter.
Risks & watch-outs
- Watch-outs: HOA is 78% of rent.
- Climate carrying-cost: moderate flood risk — expect insurance premiums to compound above CPI over the hold.
Questions for the listing agent
- What do current leases actually rent for vs. the listed asking? Can we see a recent rent roll and the last 12 months of T-12 income?
- Have any recent inspections been done? Can we get a copy of the seller's disclosures and any deferred-maintenance estimates?
- Built in 1972 — when were the roof, HVAC, electrical panel, plumbing, and water heater last replaced?
- What does the HOA fee cover, when was the last increase, and are there any pending special assessments or reserve-fund shortfalls?
- Is there a deadline driving the sale (1031 exchange, divorce, estate, relocation)? That informs how much negotiation room exists.
- Schools are F-rated, which usually means shorter tenancies and higher turnover. Who's the typical renter profile here, and what's been the actual vacancy rate?
- Crime grade is D in this area — have there been break-ins, vandalism, or insurance claims at this property in the last 3 years? What carrier currently insures it and at what premium?
- The area grade is low — what's the realistic commute time and amenity access for the typical tenant pool here? Any planned neighborhood developments (good or bad) we should know about?
- What's the average days-on-market for RENTAL listings here right now (not sales)? A rising rental-DOM trend means longer vacancies and softer asking-rent achievability than the comps imply.
- What's the recent tenant-quality profile in this submarket — average credit score on applications, eviction rate, late-payment / NSF rate, and stable-employment percentage? A property-management company in the area should have these aggregated.
- How much new for-sale + rental construction is in the pipeline within 1–3 miles? Heavy new supply typically softens prices + rents 12–24 months out; constrained supply supports both.
Investment metrics
- 1% rule
- 2.63% ✓
- Cap rate
- -1.70%
- Cash-on-cash
- -28.56%
- DSCR
- -0.27
- GRM
- 3.2
CMA / ARV
No comps found within radius.
Projected returns pro-forma
-3.0% appreciation · 0.0% rent growth · sell at horizon
- IRR
- —
- Equity multiple
- -1.32×
- Total profit
- $-26,016
- Equity at exit
- $5,964
- IRR
- —
- Equity multiple
- -3.85×
- Total profit
- $-54,300
- Equity at exit
- $3,458
Cash invested: $11,200 (down + closing). Projections, not guarantees.
Landlord ↔ Tenant lean methodology
- Overall (STATE)
- 86 Strongly Landlord-Friendly
- State Utah
- 86 Strongly Landlord-Friendly · R+15
- County
- — inherits STATE
- City
- — inherits STATE
ZIP-level market 84120
- Rents YoY
- -0.8%
- Active inventory
- 154
- Price-to-rent
- 3.2×
Monthly cashflow live
- Estimated rent
- $1,050 high interval (Pro) →
- Mortgage (P&I)
- −$210
- Tax est. 1.5%
- −$50 /mo · $600/yr
- Insurance
- −$17
- HOA
- −$820
- Lot rent leased land?
- −$0
- Vacancy / Maint / Mgmt
- −$221
- Net cashflow
- $-267
Break-even live
Sensitivity live
| Price | -10% $-239 | -5% $-253 | +0% $-267 | +5% $-280 | +10% $-294 |
|---|---|---|---|---|---|
| Rent | -10% $-350 | -5% $-308 | +0% $-267 | +5% $-225 | +10% $-184 |
| Rate | -1.0pp $-246 | -0.5pp $-256 | base $-267 | +0.5pp $-277 | +1.0pp $-287 |
UW: 25.0% down · 7.5% · 30yr · 1.5% tax · 5.0% vac · 8.0% maint · 8.0% mgmt
Financing live
Cash to close
- Down payment
- $10,000
- Closing costs
- $1,200
- Reserves months
- —
- Total cash needed
- —
Loan-product check · same deal, 3 products live
Conventional
25% down · 7.5% · 30yr
- Down + closing
- —
- Monthly P&I
- —
- Monthly cashflow
- —
- DSCR
- —
- Eligible?
- —
Personal DTI + credit; lowest rate.
DSCR
20% down · 8.5% · 30yr
- Down + closing
- —
- Monthly P&I
- —
- Monthly cashflow
- —
- DSCR
- —
- Eligible?
- —
No personal income docs; deal must DSCR.
Hard money
10% down · 12.0% · 12mo
- Down + closing
- —
- Monthly P&I
- —
- Monthly cashflow
- —
- DSCR
- —
- Eligible?
- —
Short-term bridge; refi at stabilization.
Rent comps 20 comps
| Address | Beds | Baths | Sqft | Rent | $/sqft | DOM | Units | Dist |
|---|---|---|---|---|---|---|---|---|
| 4168 W 3280 S Unit 01 Salt Lake City, UT | 2.0 | 1.0 | 986 | $1,125 | $1.14 | 6d | 1 | 0.29mi |
| 4154 W 3280 S Unit 01 West Valley City, UT | 2.0 | 1.0 | 986 | $1,095 | $1.11 | 16d | 1 | 0.30mi |
| 4047 W 3275 S Unit D West Valley City, UT | 2.0 | 1.0 | 1000 | $1,100 | $1.10 | 18d | 1 | 0.35mi |
| 4035 W 3275 S Apt A West Valley City, UT | 2.0 | 1.0 | 900 | $1,100 | $1.22 | 26d | 1 | 0.38mi |
| 3670 Atlas Way Unit 3670 West Valley City, UT | 3.0 | 1.0 | 1000 | $1,500 | $1.50 | 18d | 1 | 0.54mi |
| 3854 W Rockwood Way West Valley City, UT | 2.0 | 1.0 | 783 | $1,299 | $1.66 | 26d | 1 | 0.56mi |
| 3856 W 3500 S West Valley City, UT | 1.0–2.0 | 1.0–2.0 | 860 | $1,352 | $1.57 | 4d | 20 | 0.58mi |
| 3523 Westlake Dr West Valley City, UT | 2.0 | 1.0 | 1100 | $1,195 | $1.09 | 16d | 1 | 0.98mi |
| 3523 Westlake Dr West Valley City, UT | 2.0 | 1.0 | 1100 | $1,195 | $1.09 | 14d | 1 | 0.98mi |
| 3510 Lancer Way West Valley City, UT | 1.0–2.0 | 1.0 | 618 | $1,026 | $1.66 | 26d | 1 | 0.98mi |
| 3521 W 3100 S West Valley City, UT | 1.0–2.0 | 1.0 | 573 | $1,618 | $2.82 | 4d | 6 | 1.02mi |
| 4139 S 4080 W West Valley City, UT | 1.0–3.0 | 1.0 | 892 | $1,662 | $1.86 | 4d | 25 | 1.13mi |
| 3965 W 4100 S West Valley City, UT | 2.0 | 1.5 | 944 | $1,200 | $1.27 | 26d | 1 | 1.14mi |
| 3702 W 4040 S Unit 1 West Valley City, UT | 2.0 | 1.0 | 1100 | $1,550 | $1.41 | 26d | 1 | 1.16mi |
| 3538 Parkway Blvd Unit BOULEVARD3 Salt Lake City, UT | 2.0 | 1.0 | 716 | $1,300 | $1.82 | 26d | 1 | 1.35mi |
| 4943 W 4100 S Unit 1 West Valley City, UT | 2.0 | 1.0 | 900 | $1,099 | $1.22 | 26d | 1 | 1.35mi |
| 3524 Parkway Blvd Unit 3 Salt Lake City, UT | 2.0 | 1.0 | 900 | $1,200 | $1.33 | 26d | 1 | 1.36mi |
| 3523 W 2670 S Unit 4 Salt Lake City, UT | 2.0 | 1.0 | 900 | $1,100 | $1.22 | 6d | 1 | 1.38mi |
| 4218 S 4800 W West Valley City, UT | 2.0 | 1.0 | 1079 | $1,450 | $1.34 | 16d | 1 | 1.41mi |
| 3043 W 3500 S West Valley City, UT | 2.0 | 1.0 | 950 | $1,149 | $1.21 | 26d | 1 | 1.48mi |
HOA detail
- Monthly dues
- $820 · $9,840/yr
Listing history 14 events
-
2026-06-22days on market $40,000 Active 24 DOM
-
2026-06-21days on market $40,000 Active 23 DOM
-
2026-06-18days on market $40,000 Active 20 DOM
-
2026-06-17days on market $40,000 Active 19 DOM
-
2026-06-16days on market $40,000 Active 18 DOM
-
2026-06-15days on market $40,000 Active 17 DOM
-
2026-06-13days on market $40,000 Active 15 DOM
-
2026-06-09days on market $40,000 Active 11 DOM
-
2026-06-08days on market $40,000 Active 10 DOM
-
2026-06-07days on market $40,000 Active 9 DOM
-
2026-06-03days on market $40,000 Active 5 DOM
-
2026-06-02days on market $40,000 Active 4 DOM
-
2026-06-01days on market $40,000 Active 3 DOM
-
2026-05-31days on market $40,000 Active 2 DOM
ⓘ Source: listings_history table (triggers on properties + properties_extension) + one-shot
backfill from property_details.listing_events for pre-trigger history.
Climate risk First Street
- Flood 5/10 Major FEMA zone X (unshaded) · 51% chance over 30 yrs
- Wildfire 1/10 Low
- Heat 4/10 Moderate 7 d/yr ≥95°F today · 19 d/yr by 30 yrs out
- Wind 1/10 Low
- Air quality 3/10 Moderate 3 unhealthy d/yr today · 4 by 30 yrs out
Nearby sold comps map
Loading sold comps map…
Walkable amenities ~0.75 mi
Loading nearby amenities…
Taxation est. · year 1
- Rental income
- $12,606
- − Mortgage interest
- −$2,241
- − Property taxes
- −$600
- − Insurance
- −$200
- − Repairs & maintenance
- −$1,008
- − Management
- −$1,008
- − HOA
- −$9,840
- − Depreciation
- −$1,164
- Taxable loss
- −$3,455
- Est. tax savings @ 24.0%
- +$829
- After-tax cash flow
- $-2,369/yr
For passive investors: Depreciation is non-cash, so a rental often shows a tax loss while cash-flowing — sheltering income. Rental losses are passive: they offset passive income freely, and up to $25,000/yr can offset ordinary (W-2) income if you actively participate and your MAGI is under $100k (phasing out to $0 by $150k); unused losses carry forward. On sale, claimed depreciation is recaptured at up to 25%, and gains may owe capital-gains tax (a 1031 exchange can defer both). Figures are a year-1 estimate at your 24.0% rate — not tax advice; consult a CPA.
Condition & rehab AI · 2 photos
This mobile home is in fair condition with some cosmetic updates needed, such as painting and landscaping, to improve its resale and rental value.
Repairs flagged
- Minor Painting — The paint appears faded and could benefit from a fresh coat.
- Minor Landscaping — The landscaping appears sparse and could be improved with some updates.
Value-add opportunities
- Both Painting the interior and exterior — Fresh paint can improve the home's curb appeal and interior aesthetics.
- Both Landscaping improvements — A well-maintained landscape can enhance the home's curb appeal and attract potential buyers/tenants.
Renovation cost estimate screening
| Repair item | Severity | Est. cost |
|---|---|---|
| Painting · The paint appears faded and could benefit from a fresh coat. | Minor | $500–3,000 |
| Landscaping · The landscaping appears sparse and could be improved with some updates. | Minor | $500–3,000 |
| Total estimated repair cost · 2 items | $1,000–6,000 |
Value-add ROI direction
- Both Painting the interior and exterior — Fresh paint can improve the home's curb appeal and interior aesthetics. ↑
- Both Landscaping improvements — A well-maintained landscape can enhance the home's curb appeal and attract potential buyers/tenants. ↑
ⓘ Cost ranges are severity-bucket heuristics (US national rule-of-thumb). Get contractor quotes + a written scope before underwriting a rehab budget.
Schools (NCES district)
- District
- Granite District
- NCES district ID
- 4900360
- Math proficiency
- 26% ▼ -8.00%
- Reading proficiency
- 32% ▼ -3.00%
- Median HH income
- $55,971
- Composite
- 25.93/100
- National rank
- #7336
- State rank
- #69 of 80 in UT
Livability — West Valley City
- Score
- 76/100
- State rank
- #55
- US rank
- #3285
Category grades
Schools grade is shown separately in the Schools card above.
Census & demographics
- Census place
- West Valley City, UT
- County
- Salt Lake County · 1,195,750 people
- City population
- 132,995
- Metro
- Salt Lake City, UT
- Population (ZIP)
- 50,799
- Household income
- $94,306
- Rent vs Own
- Severe rent burden
- 551.0
Population outlook (Salt Lake County) Hauer SSP2
- Today (2025)
- 1,305,860 people
- By 2030
- 1,402,611 · +7.4%
- By 2040
- 1,594,533 · +22.1%
- By 2050
- 1,787,244 · +36.9%
- By 2075
- 2,224,138 · +70.3%
- By 2100
- 2,551,390 · +95.4%
Race, ethnicity, and origin ACS 2023
- Neighborhood character
- Diverse neighborhood (Simpson 0.66)
- Race & ethnicity
- White 42% Hispanic / Latino 40% Two or more races 11% Asian 6% Pacific Islander 5% Black 2% Native American 1%
- Hispanic origin (detail)
- Mexican 31%
- Common ancestry
- Slovak 2% Iranian 1% Italian 1%
- Foreign-born
- 24% · Canada, Vietnam, Jamaica
- Languages at home
- 59% English-only · Spanish 29% Other Asian/Pacific 5% Vietnamese 3%
Political lean MEDSL · Salt Lake
- 2024 margin
- D (+10.2) · D 53.7% · R 43.5% · Other 2.8%
- 2008→2024 swing
- +10.1pp toward D · 2008: 0.1pp · 2024: 10.2pp
- All cycles
- 2024: D+10.2 2020: D+11.0 2016: D+10.2 2012: R+19.3 2008: D+0.1
Not yet ingested
- Civics
- —
Market trends
- HPI YoY
- ▼ -364.74%
- Current HPI
- 313.9459
- Rent YoY
- ▼ -0.82%
- Metro
- Salt Lake City, UT
- State GDP YoY
- ▲ 3.54%
- F500 in state
- 2
Industry mix (Fortune 500 HQ in UT)
| Industry | F500 HQs | Revenue |
|---|---|---|
| Financial Services | 1 | $3B |
|
||
Price history
-46.7% since first listed13 events — show timeline
- 2026-05-29 Listed $40,000 WFRMLS
- 2026-05-01 Listing Removed — WFRMLS
- 2025-10-30 Listed $45,000 WFRMLS
- 2025-09-06 Listing Removed — WFRMLS
- 2025-03-05 Listed $55,000 WFRMLS
- 2025-02-02 Listing Removed — WFRMLS
- 2024-08-21 Price Changed $60,000 WFRMLS
- 2024-08-15 Relisted — WFRMLS
- 2024-08-02 Listing Removed — WFRMLS
- 2024-02-01 Listed $70,000 WFRMLS
- 2023-12-16 Listing Removed — WFRMLS
- 2023-07-26 Price Changed $70,000 WFRMLS
- 2023-06-15 Listed $75,000 WFRMLS
Cash-flow waterfall
monthlySold comps — $/sqft
last 12 mo · ≤1 miLoading sold comps…