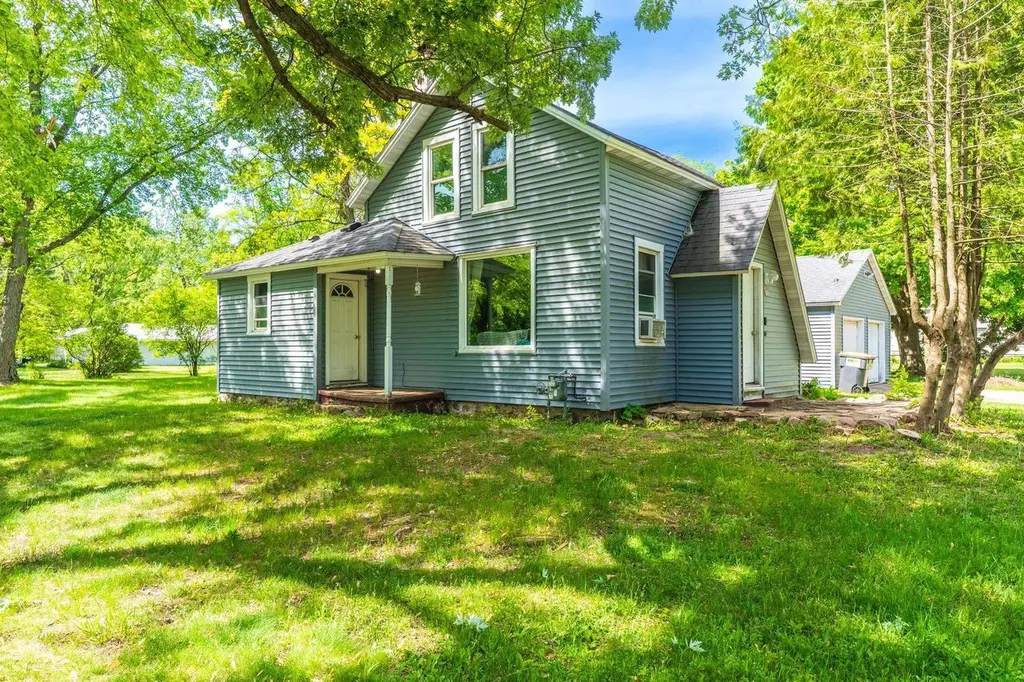
325 E Chester St · Plainfield, WI
Flood risk 3/10 · Minor
- FEMA flood zone
- X (unshaded)
- Chance of flooding over 30 yrs
- 0.1%
- Est. flood insurance / yr
- $473 – $860
Fire risk 3/10 · Minor
- Est. fire insurance / yr
- $636 – $1,182
Heat risk 1/10 · Minimal
- Hot days now (above 96°F)
- 7 days/yr
- Hot days in 30 yrs
- 13 days/yr
Wind risk 2/10 · Minimal
- Chance of severe wind over 30 yrs
- —
Air-quality risk 2/10 · Minimal
- Unhealthy air days now
- 0 days/yr
- Unhealthy air days in 30 yrs
- 1 days/yr
Risk factors via First Street. Map © Google.
Why this score? — see what drove the C- grade
The composite is a weighted blend of 9 inputs, each scored 0–100. Each bar is that input's sub-score; the figure is the points it added to the 100-point composite (weight × sub-score).
- ARV discount +15.0/15.0
- Cash flow +11.8/30.0
- Appreciation +8.7/10.0
- DSCR +3.5/10.0
- 1% rule +3.2/10.0
- Livability +3.1/5.0
- Rent growth +2.5/5.0
- Condition / age +2.5/5.0
- Schools +1.9/10.0
$129,900
🖨 Deal sheet (PDF) 📄 Offer letter ✓ Due diligence
Listing remarks
Charming 4-bedroom, 1-bath home situated on a spacious 0.39-acre corner lot in a convenient location close to local parks and within walking distance to schools. This home offers a lot of character and features main-floor laundry for added convenience. Enjoy the large backyard, complete with a small garden area, providing plenty of space for outdoor activities, entertaining, or relaxing. The detached 2-car garage offers ample storage and parking. Don't miss this opportunity to own a property that combines classic charm, a desirable lot, and a great location.
Key facts
- Large backyard
- Main-floor laundry
- Corner lot
Tags
Property features AI
Exterior
- Parking: Attached 2-car garage
- Utilities: Municipal water; Municipal sewer; Natural gas
- Home design: 1.5-story single-family home; Shingle roof
- Construction: Stone foundation
- Exterior features: Vinyl exterior; Lot under 1/2 acre (0.39 acre); Residential zoning
Interior
- Kitchen: Kitchen (11 x 10); Refrigerator; Range/Oven
- Bedrooms: Primary bedroom on the main level (13 x 10); Second bedroom on the main level (8 x 12); Third bedroom on the upper level (12 x 10); Fourth bedroom on the upper level (17 x 7)
- Flooring: Carpet; Vinyl
- Bathrooms: 1 full bathroom
- Heating & cooling: Forced air heating (natural gas); Window/wall air conditioning
- Interior features: Carpet; Vinyl floors; Ceiling fans
- Laundry & utility: Washer; Dryer; Unfinished basement utility/storage (stone foundation)
Neighborhood map
What this means for you Summary
Snapshot
- This is a 4-bed/1.0-bath single-family listed at $130k.
Deal economics
- At list price, monthly cash flow is $-36 ($-428/yr) — negative.
- To cash-flow at today's rent, offer at most $124k (4.8% below list).
- To meet the 1% rule (rent ≥ 1% of price), the offer needs to be $107k (17.6% below list).
- Recommended offer: $107k (17.6% below list) — sets the bar for 1% rule.
Location & tenants
- Location reads 62/100 on livability (#627 in WI) — a middle-class / working-renter tenant base. Strengths: cost of living A+, housing A+; Watch: employment D, health & safety D, amenities F.
- Tri-County Area School District (rural): math 21% / reading 23% proficiency, ranked #326 of 342 in WI (top 95%) — low school quality limits family demand, transient renter base, plan for 1-2y turnover.
- Zoned schools: Tri-County Elementary (math 37% / reading 37%, grade F, #562 of 1,041 statewide, top 58%, 265 students, 63% FRL); Tri-County Middle (math 17% / reading 22%, grade F, #347 of 383 statewide, top 92%, 133 students, 67% FRL); Tri-County High (math 15% / reading 15%, grade F, #414 of 483 statewide, top 87%, 177 students, 55% FRL).
- Market conditions: 6 active listings in the ZIP; 127 units permitted in Waushara County in 2024 (15 in 5+ unit buildings).
Forward outlook
- In year one you build about $10k of equity ($898 loan paydown + $9k appreciation (7.3% local appreciation)).
- Waushara County population projected at -25% by 2050 — secular population decline; favor cash flow + early exit over multi-decade hold.
- At projected returns (7.3% appreciation + 3.0% rent growth), your $36k cash investment doubles in ~4 years — after that, you're playing with house money.
- By year 4, paydown + projected appreciation supports a ~$36k cash-out refi (75% LTV) — recoverable capital for the next deal without selling this one.
Negotiation context
- It's been on market 17 days — a 2% lower offer ($128k) is reasonable based on typical stale-listing flexibility.
- Current owner paid $62k; list at $130k implies a 111% gain — meaningful room to come down on a strong offer.
Risks & watch-outs
- Watch-outs: built in 1900 — expect roof / HVAC / electrical / plumbing capex.
Questions for the listing agent
- What do current leases actually rent for vs. the listed asking? Can we see a recent rent roll and the last 12 months of T-12 income?
- Built in 1900 — when were the roof, HVAC, electrical panel, plumbing, and water heater last replaced?
- Is there a deadline driving the sale (1031 exchange, divorce, estate, relocation)? That informs how much negotiation room exists.
- Schools are F-rated, which usually means shorter tenancies and higher turnover. Who's the typical renter profile here, and what's been the actual vacancy rate?
- What's the average days-on-market for RENTAL listings here right now (not sales)? A rising rental-DOM trend means longer vacancies and softer asking-rent achievability than the comps imply.
- What's the recent tenant-quality profile in this submarket — average credit score on applications, eviction rate, late-payment / NSF rate, and stable-employment percentage? A property-management company in the area should have these aggregated.
- How much new for-sale + rental construction is in the pipeline within 1–3 miles? Heavy new supply typically softens prices + rents 12–24 months out; constrained supply supports both.
Investment metrics
- 1% rule
- 0.82% ✗
- Cap rate
- 5.96%
- Cash-on-cash
- -1.18%
- DSCR
- 0.95
- GRM
- 10.1
CMA / ARV
- ARV (on-the-fly)
- $217,560
- Comps found
- 4
Show comp detail 4 sales within ~0.75 mi
| Address | Dist | Beds/Ba | Sqft | Sold | Price | $/sf | Match |
|---|---|---|---|---|---|---|---|
| 315 S Main St | 0.19mi | 4/1.0 | 1,505 (-3%) | 6mo | $70,000 | $47 | 81 |
| 206 E North St | 0.20mi | 4/2.0 | 1,608 (+4%) | 20mo | $159,900 | $99 | 64 |
| 722 E East Rd | 0.25mi | 3/2.0 (-1) | 1,628 (+5%) | 23mo | $279,900 | $172 | 52 |
| 127 S 3rd Ave | 0.61mi | 3/2.0 (-1) | 1,702 (+10%) | 0mo | $238,000 | $140 | 46 |
Match score weights: distance 35% · size 25% · config 20% · recency 20%. Top-matched comps best support the ARV.
Projected returns pro-forma
7.31% appreciation · 3.0% rent growth · sell at horizon
- IRR
- 17.5%
- Equity multiple
- 2.25×
- Total profit
- $45,582
- Equity at exit
- $92,662
- IRR
- 16.8%
- Equity multiple
- 4.68×
- Total profit
- $133,999
- Equity at exit
- $178,466
Cash invested: $36,372 (down + closing). Projections, not guarantees.
Landlord ↔ Tenant lean methodology
- Overall (STATE)
- 73 Landlord-Friendly
- State Wisconsin
- 73 Landlord-Friendly · R+2
- County
- — inherits STATE
- City
- — inherits STATE
ZIP-level market 54966
- Home prices YoY
- 3.3%
- Active inventory
- 6
- Price-to-rent
- 10.1×
Monthly cashflow live
- Estimated rent
- $1,070 medium interval (Pro) →
- Mortgage (P&I)
- −$681
- Tax from tax record
- −$146 /mo · $1,746/yr
- Insurance
- −$54
- HOA
- −$0
- Vacancy / Maint / Mgmt
- −$225
- Net cashflow
- $-36
Break-even live
Sensitivity live
| Price | -10% $38 | -5% $1 | +0% $-36 | +5% $-72 | +10% $-109 |
|---|---|---|---|---|---|
| Rent | -10% $-120 | -5% $-78 | +0% $-36 | +5% $7 | +10% $49 |
| Rate | -1.0pp $30 | -0.5pp $-3 | base $-36 | +0.5pp $-69 | +1.0pp $-104 |
UW: 25.0% down · 7.5% · 30yr · 1.5% tax · 5.0% vac · 8.0% maint · 8.0% mgmt
Financing live
Cash to close
- Down payment
- $32,475
- Closing costs
- $3,897
- Reserves months
- —
- Total cash needed
- —
Loan-product check · same deal, 3 products live
Conventional
25% down · 7.5% · 30yr
- Down + closing
- —
- Monthly P&I
- —
- Monthly cashflow
- —
- DSCR
- —
- Eligible?
- —
Personal DTI + credit; lowest rate.
DSCR
20% down · 8.5% · 30yr
- Down + closing
- —
- Monthly P&I
- —
- Monthly cashflow
- —
- DSCR
- —
- Eligible?
- —
No personal income docs; deal must DSCR.
Hard money
10% down · 12.0% · 12mo
- Down + closing
- —
- Monthly P&I
- —
- Monthly cashflow
- —
- DSCR
- —
- Eligible?
- —
Short-term bridge; refi at stabilization.
Listing history 14 events
-
2026-06-22days on market $129,900 Active 17 DOM
-
2026-06-21days on market $129,900 Active 16 DOM
-
2026-06-19days on market $129,900 Active 14 DOM
-
2026-06-18price $129,900 Active 13 DOM
-
2026-06-18days on market $139,900 Active 13 DOM
-
2026-06-17days on market $139,900 Active 12 DOM
-
2026-06-16days on market $139,900 Active 11 DOM
-
2026-06-15days on market $139,900 Active 10 DOM
-
2026-06-14days on market $139,900 Active 8 DOM
-
2026-06-12days on market $139,900 Active 7 DOM
-
2026-06-09days on market $139,900 Active 4 DOM
-
2026-06-08days on market $139,900 Active 3 DOM
-
2026-06-07remarks 564-char remark
-
2026-06-07$139,900 Active 2 DOM
ⓘ Source: listings_history table (triggers on properties + properties_extension) + one-shot
backfill from property_details.listing_events for pre-trigger history.
Tax reassessment forecast WI · Partial reset (capped growth)
- Current annual tax
- $1,746 · $146/mo
- Projected year-2 tax
- $2,075 · $173/mo
- Expected delta
- +$328/yr (+$27/mo · 18.8%)
ⓘ Screening estimate from a state-policy table — verify with the county assessor before closing.
Climate risk First Street
- Flood 3/10 Moderate FEMA zone X (unshaded) · 10% chance over 30 yrs
- Wildfire 3/10 Moderate
- Heat 1/10 Low 7 d/yr ≥96°F today · 13 d/yr by 30 yrs out
- Wind 2/10 Low
- Air quality 2/10 Low 0 unhealthy d/yr today · 1 by 30 yrs out
Nearby sold comps map
Loading sold comps map…
Walkable amenities ~0.75 mi
Loading nearby amenities…
Taxation est. · year 1
- Rental income
- $12,839
- − Mortgage interest
- −$7,276
- − Property taxes
- −$1,746
- − Insurance
- −$650
- − Repairs & maintenance
- −$1,027
- − Management
- −$1,027
- − Depreciation
- −$3,779
- Taxable loss
- −$2,667
- Est. tax savings @ 24.0%
- +$640
- After-tax cash flow
- $212/yr
For passive investors: Depreciation is non-cash, so a rental often shows a tax loss while cash-flowing — sheltering income. Rental losses are passive: they offset passive income freely, and up to $25,000/yr can offset ordinary (W-2) income if you actively participate and your MAGI is under $100k (phasing out to $0 by $150k); unused losses carry forward. On sale, claimed depreciation is recaptured at up to 25%, and gains may owe capital-gains tax (a 1031 exchange can defer both). Figures are a year-1 estimate at your 24.0% rate — not tax advice; consult a CPA.
Schools (NCES district)
- District
- Tri-County Area School District
- NCES district ID
- 5511820
- Math proficiency
- 21% ▼ -14.00%
- Reading proficiency
- 23% ▼ -8.00%
- Median HH income
- $45,347
- Composite
- 19.13/100
- National rank
- #8831
- State rank
- #326 of 342 in WI
Livability — Plainfield
- Score
- 62/100
- State rank
- #627
- US rank
- #16463
Category grades
Schools grade is shown separately in the Schools card above.
Census & demographics
- Census place
- Plainfield, WI
- City population
- 2,155
- Population (ZIP)
- 2,155
Population outlook (Waushara County) Hauer SSP2
- Today (2025)
- 22,669 people
- By 2030
- 21,697 · -4.3%
- By 2040
- 19,329 · -14.7%
- By 2050
- 17,051 · -24.8%
- By 2075
- 13,928 · -38.6%
- By 2100
- 11,483 · -49.3%
Race, ethnicity, and origin ACS 2023
- Neighborhood character
- Predominantly White (81%)
- Race & ethnicity
- White 81% Hispanic / Latino 14% Two or more races 7% Asian 1%
- Hispanic origin (detail)
- Mexican 12% Puerto Rican 2%
- Common ancestry
- Romanian 10% Portuguese 6% Lithuanian 4%
- Foreign-born
- 5% · Canada
- Languages at home
- 88% English-only · Spanish 11% Other Asian/Pacific 1%
Political lean MEDSL · Waushara
- 2024 margin
- Solid R (+35.2) · D 31.8% · R 67.0% · Other 1.1%
- 2008→2024 swing
- -36.0pp toward R · 2008: 0.8pp · 2024: -35.2pp
- All cycles
- 2024: R+35.2 2020: R+34.1 2016: R+32.3 2012: R+10.2 2008: D+0.8
Not yet ingested
- Civics
- —
Market trends
- HPI YoY
- ▲ 7.31%
- Current HPI
- 226.345
- Rent YoY
- —
- Metro
- —
- State GDP YoY
- ▲ 2.10%
- F500 in state
- 20
Industry mix (Fortune 500 HQ in WI)
| Industry | F500 HQs | Revenue |
|---|---|---|
| Industrial Machinery | 4 | $23B |
|
||
| Industrial Technology | 2 | $36B |
|
||
| Insurance | 1 | $36B |
|
||
| Professional Services | 1 | $19B |
|
||
| Utilities | 1 | $9B |
|
||
| Consumer Goods | 1 | $3B |
|
||
Price history
+126.7% since first listed2 events — show timeline
- 2026-06-05 Listed $139,900 CWMLS
- 2007-06-11 Sold (Public Records) $61,700 Public Records
Property tax history
+2.1%/yrLatest (2025): $1,746 · +3.6% YoY. Source: county tax records.
Cash-flow waterfall
monthlySold comps — $/sqft
last 12 mo · ≤1 miLoading sold comps…