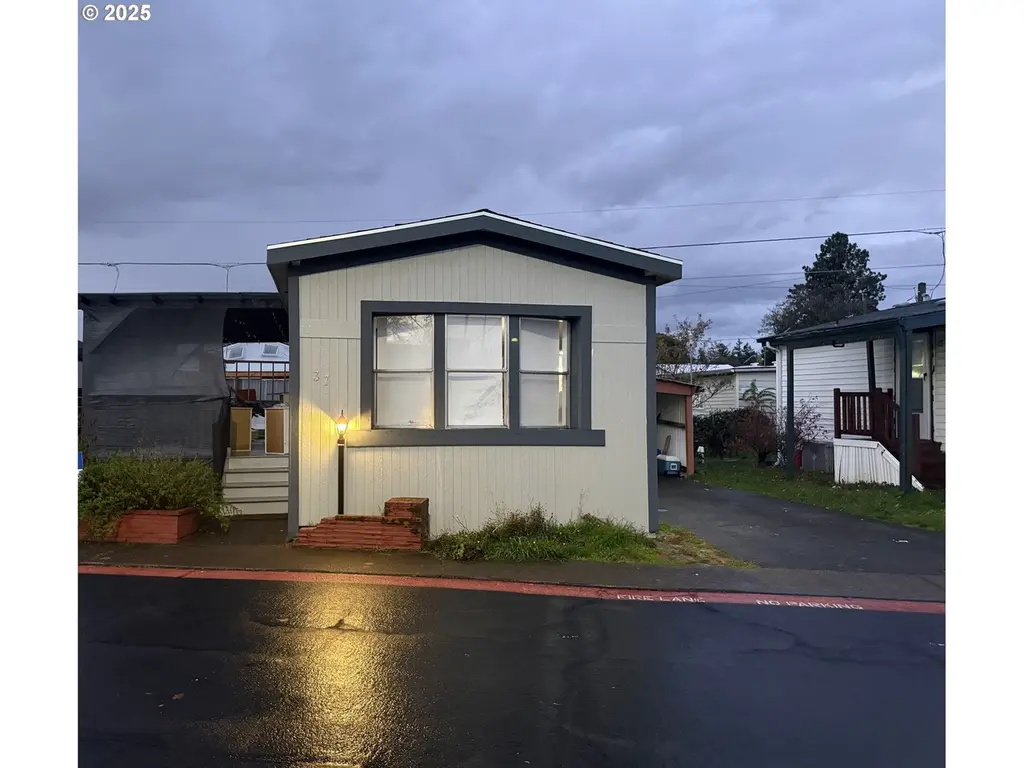
8951 SE Fuller Rd #37 · Portland, OR
Flood risk 1/10 · Minimal
- FEMA flood zone
- X (unshaded)
- Chance of flooding over 30 yrs
- 0.0%
- Est. flood insurance / yr
- $473 – $860
Fire risk 1/10 · Minimal
- Est. fire insurance / yr
- $498 – $926
Heat risk 3/10 · Minor
- Hot days now (above 92°F)
- 7 days/yr
- Hot days in 30 yrs
- 15 days/yr
Wind risk 1/10 · Minimal
- Chance of severe wind over 30 yrs
- —
Air-quality risk 10/10 · Severe
- Unhealthy air days now
- 19 days/yr
- Unhealthy air days in 30 yrs
- 21 days/yr
Risk factors via First Street. Map © Google.
Why this score? — see what drove the C+ grade
The composite is a weighted blend of 9 inputs, each scored 0–100. Each bar is that input's sub-score; the figure is the points it added to the 100-point composite (weight × sub-score).
- Cash flow +30.0/30.0
- 1% rule +10.0/10.0
- DSCR +10.0/10.0
- Livability +3.9/5.0
- Schools +3.2/10.0
- Rent growth +3.0/5.0
- Condition / age +2.5/5.0
- ARV discount +0.0/15.0
- Appreciation +0.0/10.0
$84,999
🖨 Deal sheet (PDF) 📄 Offer letter ✓ Due diligence
Listing remarks MLS
SPACE RENT IS ONE OF THE LOWEST IN TOWN: $860/MONTH. Welcome Home! Discover this beautifully updated manufactured home tucked away in a peaceful and private park setting. Every detail has been thoughtfully refreshed — from the modern countertops and remodeled bathroom to the new flooring and fresh finishes throughout. No surface has been left untouched, giving this home a truly move-in-ready feel. Enjoy the spacious main living area — perfect for entertaining guests or relaxing after a long day. With generously sized bedrooms, bright natural light, and a warm, inviting layout, this home combines comfort and style in one affordable package. Ready and waiting for its new owner — come tour it today before it’s gone!
Key facts
- Built 1982
- Listed 227 days
Neighborhood map
What this means for you Summary
Snapshot
- This is a 2-bed/1.0-bath other listed at $85k.
Deal economics
- At list price, monthly cash flow is $835 ($10k/yr) — positive.
- The deal already cash-flows at list — no discount required.
- Meets the 1% rule at list price ($2k rent vs $85k).
- Recommended offer: $75k (12.0% below list) — sets the bar for market timing.
- Cap rate 18.1% vs local median 2.2% in Portland — top-decile yield for the area; either an underpriced asset or a hidden risk that comps aren't pricing in. Stress-test before assuming the spread holds.
Location & tenants
- Location reads 77/100 on livability (#72 in OR, #3,256 nationally) — a middle-class / working-renter tenant base. Strengths: amenities A+, commute A+, health & safety A+; Watch: crime F, cost of living F.
- North Clackamas SD 12 (suburban): math 29% / reading 43% proficiency, ranked #22 of 58 in OR (top 38%) — families likely to look elsewhere, expect single-tenant / working-renter base with shorter leases.
- Zoned schools: Milwaukie El Puente Elementary School (math 34% / reading 15%, grade F, #309 of 412 statewide, top 77%, 418 students, 0% FRL); Rowe Middle School (math 12% / reading 27%, grade F, #124 of 128 statewide, top 98%, 722 students, 70% FRL); Milwaukie High School (904 students, 93% FRL) — zoned schools average 54% FRL vs 34% district-wide (20 pts higher); higher-poverty schools than district average — tighter screening recommended.
- Zoned-school proficiency averages 22% at this address vs 36% district-wide (-14 pts) — the specific schools serving this property underperform the North Clackamas SD 12 average; the district grade overstates school quality for this exact location.
- Market conditions: Rents rising (+1.9%/yr); 353 active listings in the ZIP; 40 comparable units currently listed for rent nearby; rentals at typical pace (median 26d on market — plan ~3-4 weeks tenant-placement turnaround); solid renter incomes; 946 units permitted in Clackamas County in 2024 (188 in 5+ unit buildings).
Forward outlook
- Local home prices are declining (-3.0%/yr); year-one equity from $587 of loan paydown is wiped out by about $3k of value loss. Plan a longer hold.
- Clackamas County population projected at +25% by 2050 — long-run rental-demand tailwind backs the buy-and-hold thesis.
- At projected returns (-3.0% appreciation + 1.9% rent growth), your $24k cash investment doubles in ~3 years — after that, you're playing with house money.
Negotiation context
- It's been on market 227 days — a 12% lower offer ($75k) is reasonable based on typical stale-listing flexibility.
Questions for the listing agent
- It's been on market 227 days. Have you received any prior offers? Is the seller open to a 12% concession, seller financing, or rate buy-down credit?
- Why hasn't it sold? Are there any deal-killer items the seller is aware of (foundation, flood, title, zoning, code violations)?
- Is there a deadline driving the sale (1031 exchange, divorce, estate, relocation)? That informs how much negotiation room exists.
- Crime grade is F in this area — have there been break-ins, vandalism, or insurance claims at this property in the last 3 years? What carrier currently insures it and at what premium?
- What's the average days-on-market for RENTAL listings here right now (not sales)? A rising rental-DOM trend means longer vacancies and softer asking-rent achievability than the comps imply.
- What's the recent tenant-quality profile in this submarket — average credit score on applications, eviction rate, late-payment / NSF rate, and stable-employment percentage? A property-management company in the area should have these aggregated.
- How much new for-sale + rental construction is in the pipeline within 1–3 miles? Heavy new supply typically softens prices + rents 12–24 months out; constrained supply supports both.
Investment metrics
- 1% rule
- 1.98% ✓
- Cap rate
- 18.09%
- Cash-on-cash
- 42.13%
- DSCR
- 2.87
- GRM
- 4.2
CMA / ARV
- ARV (median comp)
- $56,753
- List price
- $84,999
- Delta
- 49.77%
- Verdict
- OVERPRICED
- Comps
- 2 within 1.0 mi
Projected returns pro-forma
-3.0% appreciation · 1.89% rent growth · sell at horizon
- IRR
- 37.6%
- Equity multiple
- 2.58×
- Total profit
- $37,546
- Equity at exit
- $12,674
- IRR
- 43.6%
- Equity multiple
- 4.93×
- Total profit
- $93,617
- Equity at exit
- $7,349
Cash invested: $23,800 (down + closing). Projections, not guarantees.
Landlord ↔ Tenant lean methodology
- Overall (CITY)
- 0 Strongly Tenant-Friendly
- State Oregon
- 28 Tenant-Leaning · D+6
- County
- — inherits STATE
- City Portland
- 0 Strongly Tenant-Friendly · D+39
ZIP-level market 97086
- Rents YoY
- 1.9%
- Active inventory
- 353
- Price-to-rent
- 4.2×
Monthly cashflow live
- Estimated rent
- $1,685 high interval (Pro) →
- Mortgage (P&I)
- −$446
- Tax from tax record
- −$15 /mo · $176/yr
- Insurance
- −$35
- HOA
- −$0
- Vacancy / Maint / Mgmt
- −$354
- Net cashflow
- $835
Break-even live
Sensitivity live
| Price | -10% $884 | -5% $860 | +0% $835 | +5% $715 | +10% $685 |
|---|---|---|---|---|---|
| Rent | -10% $702 | -5% $769 | +0% $835 | +5% $902 | +10% $969 |
| Rate | -1.0pp $878 | -0.5pp $857 | base $835 | +0.5pp $813 | +1.0pp $791 |
UW: 25.0% down · 7.5% · 30yr · 1.5% tax · 5.0% vac · 8.0% maint · 8.0% mgmt
Financing live
Cash to close
- Down payment
- $21,250
- Closing costs
- $2,550
- Reserves months
- —
- Total cash needed
- —
Loan-product check · same deal, 3 products live
Conventional
25% down · 7.5% · 30yr
- Down + closing
- —
- Monthly P&I
- —
- Monthly cashflow
- —
- DSCR
- —
- Eligible?
- —
Personal DTI + credit; lowest rate.
DSCR
20% down · 8.5% · 30yr
- Down + closing
- —
- Monthly P&I
- —
- Monthly cashflow
- —
- DSCR
- —
- Eligible?
- —
No personal income docs; deal must DSCR.
Hard money
10% down · 12.0% · 12mo
- Down + closing
- —
- Monthly P&I
- —
- Monthly cashflow
- —
- DSCR
- —
- Eligible?
- —
Short-term bridge; refi at stabilization.
Rent comps 40 comps
| Address | Beds | Baths | Sqft | Rent | $/sqft | DOM | Units | Dist |
|---|---|---|---|---|---|---|---|---|
| 8942 SE 79th Pl Unit 8942 Portland, OR | 2.0 | 1.0 | 1000 | $1,495 | $1.50 | 0d | 1 | 0.33mi |
| 8950 SE 79th Pl Portland, OR | 2.0 | 1.0 | 1000 | $1,472 | $1.47 | 25d | 4 | 0.34mi |
| 8950 SE 79th Pl Portland, OR | 2.0 | 1.0 | 1000 | $1,495 | $1.50 | 23d | 1 | 0.34mi |
| 8495 SE Otty Rd Unit duplex Happy Valley, OR | 3.0 | 1.0 | 924 | $2,100 | $2.27 | 45d | 1 | 0.44mi |
| 7686 SE Overland St Unit 7686 Milwaukie, OR | 1.0 | 1.0 | 928 | $2,095 | $2.26 | 23d | 1 | 0.51mi |
| 7707 SE Otty St Portland, OR | 3.0 | 1.0 | 828 | $2,245 | $2.71 | 19d | 1 | 0.58mi |
| 9701 SE Johnson Creek Blvd Happy Valley, OR | 1.0–2.0 | 1.0–2.0 | 937 | $2,359 | $2.52 | 0d | 20 | 0.64mi |
| 8860 SE Flavel St Unit 48 Portland, OR | 2.0 | 1.0 | 806 | $1,549 | $1.92 | 45d | 1 | 0.70mi |
| 8860 SE Flavel St Unit 46 Portland, OR | 2.0 | 1.0 | 806 | $1,469 | $1.82 | 45d | 1 | 0.70mi |
| 8860 SE Flavel St Unit 51 Portland, OR | 2.0 | 1.0 | 806 | $1,449 | $1.80 | 45d | 1 | 0.70mi |
| 8860 SE Flavel St Unit 6 Portland, OR | 2.0 | 1.0 | 806 | $1,449 | $1.80 | 0d | 1 | 0.70mi |
| 7911 SE King Rd Unit 50 Milwaukie, OR | 2.0 | 1.5 | 920 | $1,595 | $1.73 | 22d | 1 | 0.72mi |
| 7911 SE King Rd Portland, OR | 1.0 | 1.0 | 540 | $1,350 | $2.50 | 19d | 1 | 0.72mi |
| 7911 SE King Rd Portland, OR | 2.0 | 1.5 | 920 | $1,700 | $1.85 | 23d | 1 | 0.72mi |
| 7911 SE King Rd Portland, OR | 2.0 | 1.5 | 920 | $1,700 | $1.85 | 45d | 1 | 0.72mi |
| 7911 SE King Rd Portland, OR | 1.0 | 1.0 | 540 | $1,300 | $2.41 | 25d | 1 | 0.72mi |
| 8300 SE Flavel St Unit 102 Portland, OR | 2.0 | 1.0 | 1011 | $1,650 | $1.63 | 45d | 1 | 0.73mi |
| 7911 SE King Rd Unit 42 Milwaukie, OR | 2.0 | 1.5 | 920 | $1,595 | $1.73 | 18d | 1 | 0.73mi |
| 8824 SE Flavel St Unit 8824-4 Portland, OR | 2.0 | 1.0 | 720 | $1,569 | $2.18 | 45d | 1 | 0.73mi |
| 8824 SE Flavel St Unit 8824-5 Portland, OR | 2.0 | 1.0 | 720 | $1,529 | $2.12 | 25d | 1 | 0.73mi |
| 8304 SE Flavel St Portland, OR | 2.0 | 1.0 | 650 | $1,695 | $2.61 | 45d | 1 | 0.73mi |
| 7911 SE King Rd Unit 38 Milwaukie, OR | 2.0 | 1.5 | 920 | $1,495 | $1.62 | 25d | 1 | 0.76mi |
| 7915 SE King Rd Portland, OR | 2.0 | 1.0 | 925 | $1,800 | $1.95 | 0d | 2 | 0.77mi |
| 8756 SE Henderson St Unit 147-8753 Portland, OR | 2.0 | 1.5 | 1100 | $2,095 | $1.90 | 45d | 1 | 0.77mi |
| 9118 SE Flavel St Portland, OR | 1.0–2.0 | 1.0 | 800 | $1,395 | $1.74 | 13d | 3 | 0.77mi |
| 9118 SE Flavel St Unit 23 Portland, OR | 1.0 | 1.0 | 750 | $1,195 | $1.59 | 9d | 1 | 0.78mi |
| 9118 SE Flavel St Unit 30 Portland, OR | 2.0 | 1.0 | 850 | $1,395 | $1.64 | 6d | 1 | 0.78mi |
| 9118 SE Flavel St Unit 10 Portland, OR | 1.0 | 1.0 | 750 | $1,195 | $1.59 | 25d | 1 | 0.78mi |
| 9118 SE Flavel St Unit 10 Portland, OR | 1.0 | 1.0 | 750 | $1,195 | $1.59 | 23d | 1 | 0.78mi |
| 9118 SE Flavel St Unit 28 Portland, OR | 2.0 | 1.0 | 850 | $1,395 | $1.64 | 25d | 1 | 0.78mi |
| 7828 SE Aspen Summit Dr Portland, OR | 1.0–3.0 | 1.0–2.0 | 1000 | $2,136 | $2.13 | 0d | 21 | 0.78mi |
| 7911 SE King Rd Unit 10 Milwaukie, OR | 1.0 | 1.0 | 540 | $1,300 | $2.41 | 19d | 1 | 0.79mi |
| 8104 SE 72nd Ave Portland, OR | 2.0 | 1.0 | 1000 | $2,195 | $2.19 | 5d | 1 | 0.80mi |
| 7911 SE King Rd Apt 22 Milwaukie, OR | 1.0 | 1.0 | 540 | $1,250 | $2.31 | 25d | 1 | 0.81mi |
| 8057 SE Monroe St Portland, OR | 2.0 | 2.0 | 900 | $1,799 | $2.00 | 0d | 1 | 0.92mi |
| 7008 SE 86th Ave Portland, OR | 3.0 | 1.0 | 1008 | $2,345 | $2.33 | 46d | 1 | 0.96mi |
| 7946 SE Monroe St Unit 7958 Milwaukie, OR | 2.0 | 1.0 | 775 | $1,499 | $1.93 | 45d | 1 | 0.97mi |
| 10411 SE Cook Ct Portland, OR | 2.0 | 2.0 | 893 | $1,765 | $1.98 | 45d | 1 | 0.97mi |
| 10411 SE Cook Ct Portland, OR | 1.0 | 1.0 | 699 | $1,530 | $2.19 | 46d | 1 | 0.97mi |
| 10411 SE Cook Ct Portland, OR | 2.0 | 2.0 | 893 | $1,885 | $2.11 | 16d | 1 | 0.97mi |
Listing history 17 events
-
2026-06-21days on market $84,999 Active 227 DOM
-
2026-06-18days on market $84,999 Active 224 DOM
-
2026-06-17days on market $84,999 Active 223 DOM
-
2026-06-16days on market $84,999 Active 222 DOM
-
2026-06-15days on market $84,999 Active 221 DOM
-
2026-06-13days on market $84,999 Active 219 DOM
-
2026-06-09days on market $84,999 Active 215 DOM
-
2026-06-08days on market $84,999 Active 214 DOM
-
2026-06-07days on market $84,999 Active 213 DOM
-
2026-06-05days on market $84,999 Active 210 DOM
-
2026-06-03days on market $84,999 Active 209 DOM
-
2026-06-02days on market $84,999 Active 208 DOM
-
2026-06-01days on market $84,999 Active 207 DOM
-
2026-05-31days on market $84,999 Active 206 DOM
-
2026-03-29price $84,999 746-char remark
Show marketing remark (746 chars)
SPACE RENT IS ONE OF THE LOWEST IN TOWN: $860/MONTH. Welcome Home! Discover this beautifully updated manufactured home tucked away in a peaceful and private park setting. Every detail has been thoughtfully refreshed — from the modern countertops and remodeled bathroom to the new flooring and fresh finishes throughout. No surface has been left untouched, giving this home a truly move-in-ready feel. Enjoy the spacious main living area — perfect for entertaining guests or relaxing after a long day. With generously sized bedrooms, bright natural light, and a warm, inviting layout, this home combines comfort and style in one affordable package. Ready and waiting for its new owner — come tour it today before it’s gone!
-
2026-01-02price $89,999 746-char remark
Show marketing remark (746 chars)
SPACE RENT IS ONE OF THE LOWEST IN TOWN: $860/MONTH. Welcome Home! Discover this beautifully updated manufactured home tucked away in a peaceful and private park setting. Every detail has been thoughtfully refreshed — from the modern countertops and remodeled bathroom to the new flooring and fresh finishes throughout. No surface has been left untouched, giving this home a truly move-in-ready feel. Enjoy the spacious main living area — perfect for entertaining guests or relaxing after a long day. With generously sized bedrooms, bright natural light, and a warm, inviting layout, this home combines comfort and style in one affordable package. Ready and waiting for its new owner — come tour it today before it’s gone!
-
2025-11-06$99,997 Active 746-char remark
Show marketing remark (746 chars)
SPACE RENT IS ONE OF THE LOWEST IN TOWN: $860/MONTH. Welcome Home! Discover this beautifully updated manufactured home tucked away in a peaceful and private park setting. Every detail has been thoughtfully refreshed — from the modern countertops and remodeled bathroom to the new flooring and fresh finishes throughout. No surface has been left untouched, giving this home a truly move-in-ready feel. Enjoy the spacious main living area — perfect for entertaining guests or relaxing after a long day. With generously sized bedrooms, bright natural light, and a warm, inviting layout, this home combines comfort and style in one affordable package. Ready and waiting for its new owner — come tour it today before it’s gone!
ⓘ Source: listings_history table (triggers on properties + properties_extension) + one-shot
backfill from property_details.listing_events for pre-trigger history.
Tax reassessment forecast OR · Resets to sale price
- Current annual tax
- $176 · $15/mo
- Projected year-2 tax
- $824 · $69/mo
- Expected delta
- +$649/yr (+$54/mo · 368.7%)
ⓘ Screening estimate from a state-policy table — verify with the county assessor before closing.
Climate risk First Street
- Flood 1/10 Low FEMA zone X (unshaded) · 0% chance over 30 yrs
- Wildfire 1/10 Low
- Heat 3/10 Moderate 7 d/yr ≥92°F today · 15 d/yr by 30 yrs out
- Wind 1/10 Low
- Air quality 10/10 Extreme 19 unhealthy d/yr today · 21 by 30 yrs out
Nearby sold comps map
Loading sold comps map…
Walkable amenities ~0.75 mi
Loading nearby amenities…
Taxation est. · year 1
- Rental income
- $20,222
- − Mortgage interest
- −$4,761
- − Property taxes
- −$176
- − Insurance
- −$425
- − Repairs & maintenance
- −$1,618
- − Management
- −$1,618
- − Depreciation
- −$2,473
- Taxable income
- $9,152
- Est. tax owed @ 24.0%
- −$2,196
- After-tax cash flow
- $7,829/yr
For passive investors: Depreciation is non-cash, so a rental often shows a tax loss while cash-flowing — sheltering income. Rental losses are passive: they offset passive income freely, and up to $25,000/yr can offset ordinary (W-2) income if you actively participate and your MAGI is under $100k (phasing out to $0 by $150k); unused losses carry forward. On sale, claimed depreciation is recaptured at up to 25%, and gains may owe capital-gains tax (a 1031 exchange can defer both). Figures are a year-1 estimate at your 24.0% rate — not tax advice; consult a CPA.
Schools (NCES district)
- District
- North Clackamas SD 12
- NCES district ID
- 4108830
- Math proficiency
- 29% ▼ -14.00%
- Reading proficiency
- 43% ▼ -13.00%
- Median HH income
- $60,217
- Composite
- 32.1/100
- National rank
- #5807
- State rank
- #22 of 58 in OR
Livability — Portland
- Score
- 77/100
- State rank
- #72
- US rank
- #3256
Category grades
Schools grade is shown separately in the Schools card above.
Census & demographics
- County
- Clackamas County · 361,406 people
- City population
- 774,334
- Metro
- Portland-Vancouver-Hillsboro, OR-WA
- Population (ZIP)
- 34,567
- Household income
- $102,359
- Rent vs Own
- Severe rent burden
- 1281.0
Population outlook (Clackamas County) Hauer SSP2
- Today (2025)
- 458,456 people
- By 2030
- 485,185 · +5.8%
- By 2040
- 532,932 · +16.2%
- By 2050
- 574,445 · +25.3%
- By 2075
- 665,497 · +45.2%
- By 2100
- 697,488 · +52.1%
Race, ethnicity, and origin ACS 2023
- Neighborhood character
- Diverse neighborhood (Simpson 0.57)
- Race & ethnicity
- White 63% Asian 17% Two or more races 12% Hispanic / Latino 9% Black 2%
- Hispanic origin (detail)
- Mexican 6%
- Common ancestry
- Italian 4% Portuguese 4% Lithuanian 2%
- Foreign-born
- 18% · Canada, Vietnam, China
- Languages at home
- 79% English-only · Spanish 5% Vietnamese 3% Chinese 3%
Political lean MEDSL · Clackamas
- 2024 margin
- Lean D (+9.7) · D 53.4% · R 43.6% · Other 3.0%
- 2008→2024 swing
- -0.6pp no change · 2008: 10.4pp · 2024: 9.7pp
- All cycles
- 2024: D+9.7 2020: D+11.1 2016: D+6.1 2012: D+3.5 2008: D+10.4
Not yet ingested
- Civics
- —
Market trends
- HPI YoY
- ▼ -279.06%
- Current HPI
- 261.5208
- Rent YoY
- ▲ 1.89%
- Metro
- Portland-Vancouver-Hillsboro, OR-WA
- State GDP YoY
- ▲ 2.05%
- F500 in state
- 2
Industry mix (Fortune 500 HQ in OR)
| Industry | F500 HQs | Revenue |
|---|---|---|
| Consumer Goods | 1 | $51B |
|
||
Price history
-15.0% since first listed3 events — show timeline
- 2026-03-29 Price Changed $84,999 RMLS
- 2026-01-02 Price Changed $89,999 RMLS
- 2025-11-06 Listed $99,997 RMLS
Property tax history
+1.9%/yrLatest (2018): $176 · +12.5% YoY. Source: county tax records.
Cash-flow waterfall
monthlySold comps — $/sqft
last 12 mo · ≤1 miLoading sold comps…