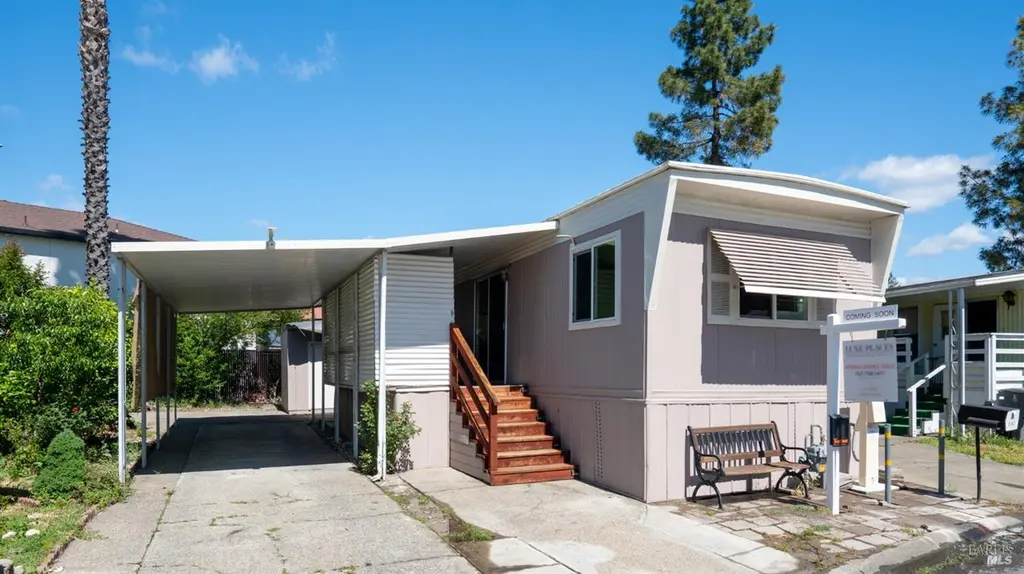
3162 Loretta Way · Santa Rosa, CA
Flood risk 1/10 · Minimal
- FEMA flood zone
- X (unshaded)
- Chance of flooding over 30 yrs
- 0.0%
- Est. flood insurance / yr
- $507 – $1,088
Fire risk 5/10 · Moderate
- Est. fire insurance / yr
- $659 – $1,223
Heat risk 4/10 · Minor
- Hot days now (above 92°F)
- 7 days/yr
- Hot days in 30 yrs
- 15 days/yr
Wind risk 1/10 · Minimal
- Chance of severe wind over 30 yrs
- —
Air-quality risk 10/10 · Severe
- Unhealthy air days now
- 21 days/yr
- Unhealthy air days in 30 yrs
- 21 days/yr
Risk factors via First Street. Map © Google.
Why this score? — see what drove the B grade
The composite is a weighted blend of 9 inputs, each scored 0–100. Each bar is that input's sub-score; the figure is the points it added to the 100-point composite (weight × sub-score).
- Cash flow +30.0/30.0
- 1% rule +10.0/10.0
- DSCR +10.0/10.0
- ARV discount +9.8/15.0
- Livability +3.8/5.0
- Condition / age +3.8/5.0
- Schools +3.7/10.0
- Rent growth +2.5/5.0
- Appreciation +0.0/10.0
$135,000
🖨 Deal sheet 📄 Offer letter ✓ Due diligence
Listing remarks
Welcome to this beautifully maintained 2 bedroom 1 bath plus extra room home nestled in a desirable family friendly park in Northwest Santa Rosa. Pride of ownership shows throughout, offering a clean comfortable space at ready for its next owner to move right in. With its excellent condition, functional layout, and affordable space rent, this home presents an incredible opportunity for comfortable living in sought after location.
Key facts
- 3 parking spots
- Built 1969
- Listed 42 days
Property features AI
Finance
- Financial info: Land lease amount: $686 per month
- HOA & community: No association; Not a senior community; Located in Coddingtown Mobile Home Park
Exterior
- Parking: 3 parking spaces; Other parking features
- Security: Smoke detector
- Utilities: Individual electric meter; Individual gas meter; Public sewer
- Home design: Manufactured home in a park; Single wide
- Construction: Aluminum skirting; Manufactured by Fuqua Homes; Unknown make
- Exterior features: Front porch
Interior
- Kitchen: Free-standing refrigerator; Breakfast area
- Bedrooms: 2 bedrooms
- Flooring: Laminate
- Bathrooms: 1 full bathroom with jetted tub
- Heating & cooling: Wall furnace; No central cooling
- Interior features: Smoke detector; Bonus room; Living room; Dining area located in the kitchen; Breakfast area
- Laundry & utility: Washer included; Dryer included; Additional laundry feature
Neighborhood map
What this means for you Summary
Snapshot
- This is a 2-bed/1.0-bath manufactured listed at $135k. Condition is rated good.
Deal economics
- At list price, monthly cash flow is $1k ($13k/yr) — positive.
- The deal already cash-flows at list — no discount required.
- Meets the 1% rule at list price ($3k rent vs $135k).
- Recommended offer: $131k (3.0% below list) — sets the bar for market timing.
- Cap rate 16.2% vs local median 2.5% in Santa Rosa — top-decile yield for the area; either an underpriced asset or a hidden risk that comps aren't pricing in. Stress-test before assuming the spread holds.
Location & tenants
- Location reads 75/100 on livability (#112 in CA, #3,940 nationally) — a middle-class / working-renter tenant base. Strengths: amenities A+, commute A+, employment A+; Watch: schools C-, cost of living F.
- Santa Rosa High (urban): math 31% / reading 47% proficiency, ranked #703 of 1,400 in CA (top 50%) — families likely to look elsewhere, expect single-tenant / working-renter base with shorter leases.
- Market conditions: Rents flat; 199 active listings in the ZIP; 19 comparable units currently listed for rent nearby; rentals at typical pace (median 14d on market — plan ~3-4 weeks tenant-placement turnaround); solid renter incomes; 1,039 units permitted in Sonoma County in 2024 (185 in 5+ unit buildings).
- This rent runs 32% of the median local income ($98k/yr) — at the standard rent-burdened threshold; future hikes will face affordability resistance.
Forward outlook
- Local home prices are declining (-3.0%/yr); year-one equity from $933 of loan paydown is wiped out by about $4k of value loss. Plan a longer hold.
- Sonoma County population projected at +8% by 2050 — modest demand growth; plan on rents tracking national, not racing it.
- At projected returns (-3.0% appreciation + 0.1% rent growth), your $38k cash investment doubles in ~4 years — after that, you're playing with house money.
Negotiation context
- It's been on market 42 days — a 3% lower offer ($131k) is reasonable based on typical stale-listing flexibility.
Risks & watch-outs
- Climate carrying-cost: moderate wildfire risk — expect insurance premiums to compound above CPI over the hold.
Questions for the listing agent
- It's been on market 42 days. Have you received any prior offers? Is the seller open to a 3% concession, seller financing, or rate buy-down credit?
- Built in 1969 — when were the roof, HVAC, electrical panel, plumbing, and water heater last replaced?
- Is there a deadline driving the sale (1031 exchange, divorce, estate, relocation)? That informs how much negotiation room exists.
- What's the average days-on-market for RENTAL listings here right now (not sales)? A rising rental-DOM trend means longer vacancies and softer asking-rent achievability than the comps imply.
- What's the recent tenant-quality profile in this submarket — average credit score on applications, eviction rate, late-payment / NSF rate, and stable-employment percentage? A property-management company in the area should have these aggregated.
- How much new for-sale + rental construction is in the pipeline within 1–3 miles? Heavy new supply typically softens prices + rents 12–24 months out; constrained supply supports both.
Investment metrics
- 1% rule
- 1.92% ✓
- Cap rate
- 16.22%
- Cash-on-cash
- 35.46%
- DSCR
- 2.58
- GRM
- 4.3
CMA / ARV
- ARV (on-the-fly)
- $142,209
- Comps found
- 1
Show comp detail 1 sale within ~0.75 mi
| Address | Dist | Beds/Ba | Sqft | Sold | Price | $/sf | Match |
|---|---|---|---|---|---|---|---|
| 3162 Loretta Way | 0.00mi | 2/1.0 | 687 (0%) | 1mo | $142,200 | $207 | 99 |
Match score weights: distance 35% · size 25% · config 20% · recency 20%. Top-matched comps best support the ARV.
Projected returns pro-forma
-3.0% appreciation · 0.1% rent growth · sell at horizon
- IRR
- 27.8%
- Equity multiple
- 2.11×
- Total profit
- $41,946
- Equity at exit
- $20,129
- IRR
- 33.5%
- Equity multiple
- 3.64×
- Total profit
- $99,798
- Equity at exit
- $11,672
Cash invested: $37,800 (down + closing). Projections, not guarantees.
Landlord ↔ Tenant lean methodology
- Overall (STATE)
- 18 Strongly Tenant-Friendly
- State California
- 18 Strongly Tenant-Friendly · D+13
- County
- — inherits STATE
- City
- — inherits STATE
ZIP-level market 95403
- Rents YoY
- 0.1%
- Active inventory
- 199
- Price-to-rent
- 4.3×
Monthly cashflow live
- Estimated rent
- $2,595 high interval (Pro) →
- Mortgage (P&I)
- −$708
- Tax est. 1.5%
- −$169 /mo · $2,025/yr
- Insurance
- −$56
- HOA
- −$0
- Vacancy / Maint / Mgmt
- −$545
- Net cashflow
- $1,117
Break-even live
UW: 25.0% down · 7.5% · 30yr · 1.5% tax · 5.0% vac · 8.0% maint · 8.0% mgmt
Financing live
Cash to close
- Down payment
- $33,750
- Closing costs
- $4,050
- Reserves months
- —
- Total cash needed
- —
Loan-product check · same deal, 3 products live
Conventional
25% down · 7.5% · 30yr
- Down + closing
- —
- Monthly P&I
- —
- Monthly cashflow
- —
- DSCR
- —
- Eligible?
- —
Personal DTI + credit; lowest rate.
DSCR
20% down · 8.5% · 30yr
- Down + closing
- —
- Monthly P&I
- —
- Monthly cashflow
- —
- DSCR
- —
- Eligible?
- —
No personal income docs; deal must DSCR.
Hard money
10% down · 12.0% · 12mo
- Down + closing
- —
- Monthly P&I
- —
- Monthly cashflow
- —
- DSCR
- —
- Eligible?
- —
Short-term bridge; refi at stabilization.
Rent comps 19 comps
| Address | Beds | Baths | Sqft | Rent | $/sqft | DOM | Units | Dist |
|---|---|---|---|---|---|---|---|---|
| 561 Renaissance Way Santa Rosa, CA | 1.0–2.0 | 1.0–2.0 | 876 | $2,995 | $3.42 | 14d | 18 | 0.26mi |
| 3610 Mendocino Ave Santa Rosa, CA | 2.0 | 1.0–2.0 | 828 | $3,995 | $4.82 | 14d | 177 | 0.26mi |
| 850 Russell Ave Santa Rosa, CA | 1.0 | 1.0 | 567 | $1,653 | $2.91 | 14d | 1 | 0.43mi |
| 2705 Range Ave Santa Rosa, CA | 1.0–2.0 | 1.0–2.0 | 838 | $2,750 | $3.28 | 14d | 6 | 0.54mi |
| 1163 Hopper Ave Santa Rosa, CA | 1.0–2.0 | 1.0–2.0 | 773 | $2,625 | $3.40 | 8d | 2 | 0.61mi |
| 1319 Miller Dr Santa Rosa, CA | 1.0 | 1.0 | 685 | $1,950 | $2.85 | 14d | 1 | 0.79mi |
| 2323 McBride Ln Unit 1 Santa Rosa, CA | 1.0 | 1.0 | 600 | $1,750 | $2.92 | 14d | 1 | 0.85mi |
| 2980 Bay Village Cir Santa Rosa, CA | 1.0–3.0 | 1.0–2.0 | 924 | $2,778 | $3.01 | 14d | 7 | 0.90mi |
| 1333 W Steele Ln Santa Rosa, CA | 1.0–3.0 | 1.0–2.0 | 850 | $2,450 | $2.88 | 14d | 4 | 0.93mi |
| 1952 W Steele Ln Santa Rosa, CA | 1.0–2.0 | 1.0 | 758 | $1,710 | $2.26 | 14d | 1 | 1.00mi |
| 2002 Pinercrest Dr Santa Rosa, CA | 1.0–2.0 | 1.0–2.0 | 792 | $2,350 | $2.97 | 14d | 1 | 1.06mi |
| 3076 Marlow Rd Santa Rosa, CA | 1.0–2.0 | 1.0–2.0 | 750 | $2,449 | $3.27 | 14d | 5 | 1.07mi |
| 2001 Piner Rd Santa Rosa, CA | 1.0–2.0 | 1.0–2.0 | 901 | $2,473 | $2.74 | 14d | 5 | 1.12mi |
| 2001 Range Ave Santa Rosa, CA | 1.0 | 1.0 | 600 | $1,795 | $2.99 | 14d | 2 | 1.28mi |
| 933 Edwards Ave Santa Rosa, CA | 1.0 | 1.0 | 660 | $1,695 | $2.57 | 21d | 1 | 1.29mi |
| 900 Edwards Ave Unit X Santa Rosa, CA | 1.0 | 1.0 | 560 | $1,700 | $3.04 | 21d | 1 | 1.36mi |
| 1841 Salem Ave Unit 20 Santa Rosa, CA | 1.0 | 1.0 | 550 | $1,595 | $2.90 | 14d | 1 | 1.37mi |
| 4627 Thomas Lake Harris Dr Santa Rosa, CA | 1.0–3.0 | 1.0–2.0 | 1096 | $3,745 | $3.42 | 8d | 4 | 1.38mi |
| 555 Dexter St Apt E Santa Rosa, CA | 2.0 | 1.0 | 700 | $1,995 | $2.85 | 14d | 1 | 1.49mi |
Listing history 3 events
-
2026-05-16status Pending
-
2026-04-16historical Contingent (Show)
-
2026-04-05$135,000 Active
ⓘ Source: listings_history table (triggers on properties + properties_extension) + one-shot
backfill from property_details.listing_events for pre-trigger history.
Climate risk First Street
- Flood 1/10 Low FEMA zone X (unshaded) · 0% chance over 30 yrs
- Wildfire 5/10 Major
- Heat 4/10 Moderate 7 d/yr ≥92°F today · 15 d/yr by 30 yrs out
- Wind 1/10 Low
- Air quality 10/10 Extreme 21 unhealthy d/yr today · 21 by 30 yrs out
Nearby sold comps map
Loading sold comps map…
Walkable amenities ~0.75 mi
Loading nearby amenities…
Taxation est. · year 1
- Rental income
- $31,138
- − Mortgage interest
- −$7,562
- − Property taxes
- −$2,025
- − Insurance
- −$675
- − Repairs & maintenance
- −$2,491
- − Management
- −$2,491
- − Depreciation
- −$3,927
- Taxable income
- $11,967
- Est. tax owed @ 24.0%
- −$2,872
- After-tax cash flow
- $10,532/yr
For passive investors: Depreciation is non-cash, so a rental often shows a tax loss while cash-flowing — sheltering income. Rental losses are passive: they offset passive income freely, and up to $25,000/yr can offset ordinary (W-2) income if you actively participate and your MAGI is under $100k (phasing out to $0 by $150k); unused losses carry forward. On sale, claimed depreciation is recaptured at up to 25%, and gains may owe capital-gains tax (a 1031 exchange can defer both). Figures are a year-1 estimate at your 24.0% rate — not tax advice; consult a CPA.
Condition & rehab AI · 1 photo
This well-maintained manufactured home in a desirable location offers a clean and comfortable space with good curb appeal and minimal repairs needed.
Value-add opportunities
- Both Paint exterior siding — Fresh paint can enhance curb appeal and the home's overall appearance.
- Both Replace awnings — Awnings can provide shade and protect the exterior siding from the sun and rain.
- Both Upgrade HVAC system — A modern HVAC system can improve comfort and energy efficiency, attracting more buyers or renters.
Renovation cost estimate screening
Value-add ROI direction
- Both Paint exterior siding — Fresh paint can enhance curb appeal and the home's overall appearance. ↑
- Both Replace awnings — Awnings can provide shade and protect the exterior siding from the sun and rain. ↑
- Both Upgrade HVAC system — A modern HVAC system can improve comfort and energy efficiency, attracting more buyers or renters. ↑
ⓘ Cost ranges are severity-bucket heuristics (US national rule-of-thumb). Get contractor quotes + a written scope before underwriting a rehab budget.
Schools (NCES district)
- District
- Santa Rosa High
- NCES district ID
- 0635830
- Math proficiency
- 31% —
- Reading proficiency
- 47% —
- Median HH income
- $62,000
- Composite
- 37.25/100
- National rank
- #8972
- State rank
- #703 of 1400 in CA
Livability — Santa Rosa
- Score
- 75/100
- State rank
- #112
- US rank
- #3940
Category grades
Schools grade is shown separately in the Schools card above.
Census & demographics
- Census place
- Santa Rosa, CA
- County
- Sonoma County · 449,805 people
- City population
- 210,074
- Metro
- Santa Rosa-Petaluma, CA
- Population (ZIP)
- 45,806
- Household income
- $98,191
- Rent vs Own
- Severe rent burden
- 1770.0
Population outlook (Sonoma County) Hauer SSP2
- Today (2025)
- 539,935 people
- By 2030
- 554,870 · +2.8%
- By 2040
- 573,262 · +6.2%
- By 2050
- 580,715 · +7.6%
- By 2075
- 579,229 · +7.3%
- By 2100
- 547,835 · +1.5%
Race, ethnicity, and origin ACS 2023
- Neighborhood character
- Diverse neighborhood (Simpson 0.61)
- Race & ethnicity
- White 50% Hispanic / Latino 37% Two or more races 13% Asian 5% Native American 2% Black 2%
- Hispanic origin (detail)
- Mexican 31%
- Common ancestry
- Italian 3% Slovak 2% Lithuanian 2%
- Foreign-born
- 20% · Canada, Vietnam, South Korea
- Languages at home
- 67% English-only · Spanish 26% Other Indo-European 1% Vietnamese 1%
Political lean MEDSL · Sonoma
- 2024 margin
- Solid D (+46.2) · D 71.4% · R 25.2% · Other 3.3%
- 2008→2024 swing
- -3.4pp toward R · 2008: 49.6pp · 2024: 46.2pp
- All cycles
- 2024: D+46.2 2020: D+51.5 2016: D+47.9 2012: D+44.9 2008: D+49.6
Not yet ingested
- Civics
- —
Market trends
- HPI YoY
- ▼ -679.94%
- Current HPI
- 254.3106
- Rent YoY
- ▲ 0.10%
- Metro
- Santa Rosa-Petaluma, CA
- State GDP YoY
- ▲ 3.21%
- F500 in state
- 116
Industry mix (Fortune 500 HQ in CA)
| Industry | F500 HQs | Revenue |
|---|---|---|
| Technology | 27 | $1,492B |
|
||
| Financial Services | 3 | $174B |
|
||
| Retail | 3 | $44B |
|
||
| Insurance | 3 | $26B |
|
||
| Media / Entertainment | 2 | $115B |
|
||
| Pharmaceuticals / Biotech | 2 | $62B |
|
||
Price history
3 events — show timeline
- 2026-05-16 Pending — BAREIS
- 2026-04-16 Contingent — BAREIS
- 2026-04-05 Listed $135,000 BAREIS
Cash-flow waterfall
monthlySold comps — $/sqft
last 12 mo · ≤1 miLoading sold comps…