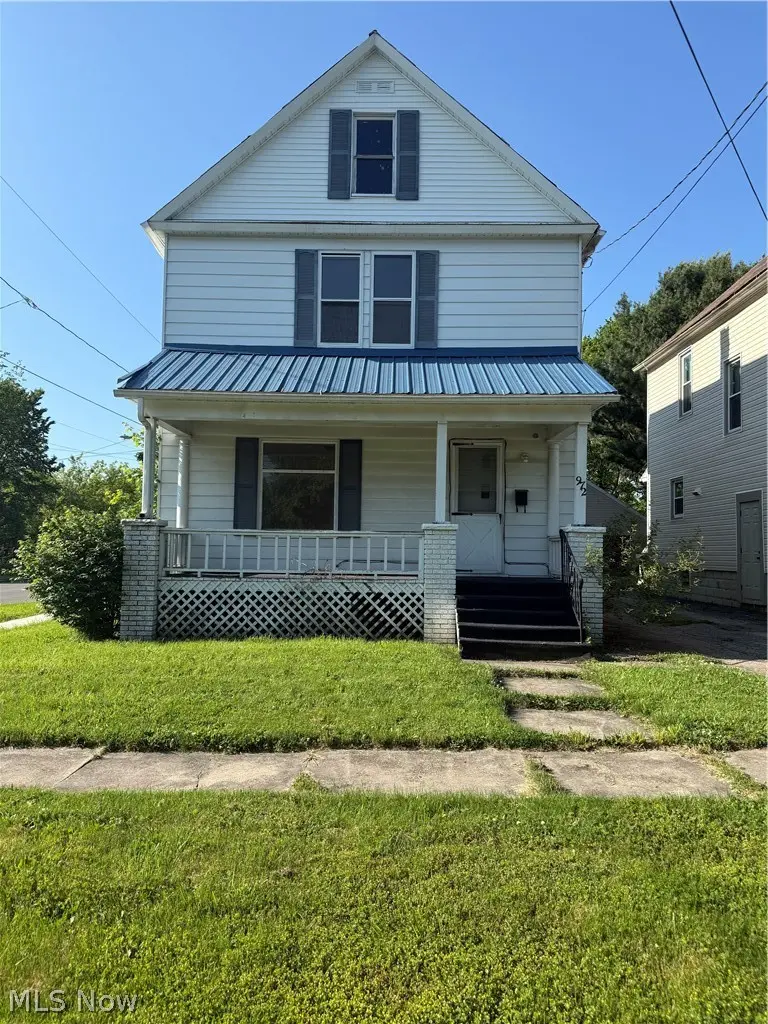
972 Front St SW · Warren, OH
Flood risk 6/10 · Moderate
- FEMA flood zone
- X (unshaded)
- Chance of flooding over 30 yrs
- 0.71%
- Est. flood insurance / yr
- $473 – $860
Fire risk 1/10 · Minimal
- Est. fire insurance / yr
- $713 – $1,323
Heat risk 3/10 · Minor
- Hot days now (above 98°F)
- 7 days/yr
- Hot days in 30 yrs
- 17 days/yr
Wind risk 1/10 · Minimal
- Chance of severe wind over 30 yrs
- —
Air-quality risk 3/10 · Minor
- Unhealthy air days now
- 1 days/yr
- Unhealthy air days in 30 yrs
- 4 days/yr
Risk factors via First Street. Map © Google.
Why this score? — see what drove the A- grade
The composite is a weighted blend of 9 inputs, each scored 0–100. Each bar is that input's sub-score; the figure is the points it added to the 100-point composite (weight × sub-score).
- Cash flow +30.0/30.0
- ARV discount +15.0/15.0
- 1% rule +10.0/10.0
- DSCR +10.0/10.0
- Appreciation +4.4/10.0
- Livability +3.7/5.0
- Rent growth +2.5/5.0
- Condition / age +2.5/5.0
- Schools +2.2/10.0
$54,999
🖨 Deal sheet 📄 Offer letter ✓ Due diligence
Listing remarks MLS
3 Bedroom 2 story home with natural woodwork. Eat in kitchen with formal dining room. Spacious rooms. Full basement. Large attic for storage. Nice back porch. Corner lot. Great Investment Property with good potential!
Key facts
- 5,889 sq ft lot
- Garage
- Built 1901
Neighborhood map
What this means for you Summary
Snapshot
- This is a 3-bed/1.0-bath single-family listed at $55k.
Deal economics
- At list price, monthly cash flow is $485 ($6k/yr) — positive.
- The deal already cash-flows at list — no discount required.
- Meets the 1% rule at list price ($1k rent vs $55k).
- Cap rate 16.9% vs local median 6.0% in Warren — top-decile yield for the area; either an underpriced asset or a hidden risk that comps aren't pricing in. Stress-test before assuming the spread holds.
Location & tenants
- Location reads 73/100 on livability (#312 in OH) — a middle-class / working-renter tenant base. Strengths: cost of living A+, health & safety A+, housing A; Watch: crime D-, commute F, employment F.
- Warren City (urban): math 22% / reading 32% proficiency, ranked #599 of 656 in OH (top 91%) — low school quality limits family demand, transient renter base, plan for 1-2y turnover; 75% free/reduced lunch — lower-income household profile, screen leases tightly.
- Market conditions: 42 active listings in the ZIP; 5 comparable units currently listed for rent nearby; rentals leasing fast (median 14d on market — plan ~1-2 weeks tenant-placement turnaround); lower-income renter base — watch delinquency; 129 units permitted in Trumbull County in 2024 (0 in 5+ unit buildings).
- This rent runs 37% of the median local income ($34k/yr) — at the standard rent-burdened threshold; future hikes will face affordability resistance.
Forward outlook
- Local home prices are declining (-1.1%/yr); year-one equity from $380 of loan paydown is wiped out by about $626 of value loss. Plan a longer hold.
- Trumbull County population projected at -22% by 2050 — secular population decline; favor cash flow + early exit over multi-decade hold.
- At projected returns (-1.1% appreciation + 3.0% rent growth), your $15k cash investment doubles in ~3 years — after that, you're playing with house money.
Negotiation context
- Only 14 days on market — expect competitive offers; lowballing is unlikely to land.
- 3 sale attempts since 10y ago with the ask held roughly flat each time — persistent listings suggest the price (not the market) is what's stuck; bring a comps-based counter.
- Current owner paid $10k; list at $55k implies a 479% gain — meaningful room to come down on a strong offer.
Risks & watch-outs
- Watch-outs: built in 1901 — expect roof / HVAC / electrical / plumbing capex.
- Climate carrying-cost: major flood risk — expect insurance premiums to compound above CPI over the hold.
Questions for the listing agent
- Built in 1901 — when were the roof, HVAC, electrical panel, plumbing, and water heater last replaced?
- Is there a deadline driving the sale (1031 exchange, divorce, estate, relocation)? That informs how much negotiation room exists.
- Crime grade is D in this area — have there been break-ins, vandalism, or insurance claims at this property in the last 3 years? What carrier currently insures it and at what premium?
- What's the average days-on-market for RENTAL listings here right now (not sales)? A rising rental-DOM trend means longer vacancies and softer asking-rent achievability than the comps imply.
- What's the recent tenant-quality profile in this submarket — average credit score on applications, eviction rate, late-payment / NSF rate, and stable-employment percentage? A property-management company in the area should have these aggregated.
- How much new for-sale + rental construction is in the pipeline within 1–3 miles? Heavy new supply typically softens prices + rents 12–24 months out; constrained supply supports both.
Investment metrics
- 1% rule
- 1.87% ✓
- Cap rate
- 16.86%
- Cash-on-cash
- 37.75%
- DSCR
- 2.68
- GRM
- 4.5
CMA / ARV
- ARV (on-the-fly)
- $71,280
- Comps found
- 4
Show comp detail 4 sales within ~0.75 mi
| Address | Dist | Beds/Ba | Sqft | Sold | Price | $/sf | Match |
|---|---|---|---|---|---|---|---|
| 336 Parkman Rd SW | 0.06mi | 4/1.0 (+1) | 1,253 (-5%) | 2mo | $20,000 | $16 | 82 |
| 759 Tod Ave SW | 0.37mi | 3/1.0 | 1,256 (-5%) | 7mo | $99,900 | $80 | 69 |
| 666 Dickey Ave NW | 0.50mi | 3/1.5 | 1,171 (-11%) | 6mo | $63,000 | $54 | 51 |
| 1175 Mcmyler St NW | 0.49mi | 3/2.0 | 1,126 (-15%) | 12mo | $58,000 | $52 | 39 |
Match score weights: distance 35% · size 25% · config 20% · recency 20%. Top-matched comps best support the ARV.
Projected returns pro-forma
-1.14% appreciation · 3.0% rent growth · sell at horizon
- IRR
- 36.8%
- Equity multiple
- 2.71×
- Total profit
- $26,356
- Equity at exit
- $12,909
- IRR
- 41.3%
- Equity multiple
- 5.33×
- Total profit
- $66,745
- Equity at exit
- $13,246
Cash invested: $15,400 (down + closing). Projections, not guarantees.
Landlord ↔ Tenant lean methodology
- Overall (STATE)
- 73 Landlord-Friendly
- State Ohio
- 73 Landlord-Friendly · R+6
- County
- — inherits STATE
- City
- — inherits STATE
ZIP-level market 44485
- Home prices YoY
- -0.5%
- Active inventory
- 42
- Price-to-rent
- 4.5×
Monthly cashflow live
- Estimated rent
- $1,028 high interval (Pro) →
- Mortgage (P&I)
- −$288
- Tax from tax record
- −$16 /mo · $194/yr
- Insurance
- −$23
- HOA
- −$0
- Vacancy / Maint / Mgmt
- −$216
- Net cashflow
- $485
Break-even live
UW: 25.0% down · 7.5% · 30yr · 1.5% tax · 5.0% vac · 8.0% maint · 8.0% mgmt
Financing live
Cash to close
- Down payment
- $13,750
- Closing costs
- $1,650
- Reserves months
- —
- Total cash needed
- —
Loan-product check · same deal, 3 products live
Conventional
25% down · 7.5% · 30yr
- Down + closing
- —
- Monthly P&I
- —
- Monthly cashflow
- —
- DSCR
- —
- Eligible?
- —
Personal DTI + credit; lowest rate.
DSCR
20% down · 8.5% · 30yr
- Down + closing
- —
- Monthly P&I
- —
- Monthly cashflow
- —
- DSCR
- —
- Eligible?
- —
No personal income docs; deal must DSCR.
Hard money
10% down · 12.0% · 12mo
- Down + closing
- —
- Monthly P&I
- —
- Monthly cashflow
- —
- DSCR
- —
- Eligible?
- —
Short-term bridge; refi at stabilization.
Rent comps 5 comps
| Address | Beds | Baths | Sqft | Rent | $/sqft | DOM | Units | Dist |
|---|---|---|---|---|---|---|---|---|
| 437 Nevada Ave NW Warren, OH | 2.0 | 1.0 | 1016 | $750 | $0.74 | 13d | 1 | 0.73mi |
| 407 Washington St NE Niles, OH | 3.0 | 1.5 | 1388 | $1,250 | $0.90 | 13d | 1 | 1.15mi |
| 1388 Beechcrest St NW Warren, OH | 3.0 | 2.0 | 1297 | $1,195 | $0.92 | 13d | 1 | 1.34mi |
| 600 Commerce Ave NW Warren, OH | 2.0 | 1.0 | 900 | $900 | $1.00 | 13d | 3 | 1.44mi |
| 341 Charles AVE Warren, OH | 3.0 | 1.0 | 1232 | $1,100 | $0.89 | 43d | 1 | 1.47mi |
Listing history 12 events
-
2026-06-19days on market $54,999 Active 14 DOM
-
2026-06-18days on market $54,999 Active 13 DOM
-
2026-06-17days on market $54,999 Active 12 DOM
-
2026-06-16days on market $54,999 Active 11 DOM
-
2026-06-15days on market $54,999 Active 10 DOM
-
2026-06-14days on market $54,999 Active 8 DOM
-
2026-06-13days on market $54,999 Active 7 DOM
-
2026-06-10days on market $54,999 Active 5 DOM
-
2026-06-09days on market $54,999 Active 4 DOM
-
2026-06-08days on market $54,999 Active 3 DOM
-
2026-06-07remarks 343-char remark
-
2026-06-07$54,999 Active 2 DOM
ⓘ Source: listings_history table (triggers on properties + properties_extension) + one-shot
backfill from property_details.listing_events for pre-trigger history.
Tax reassessment forecast OH · Partial reset (capped growth)
- Current annual tax
- $194 · $16/mo
- Projected year-2 tax
- $526 · $44/mo
- Expected delta
- +$332/yr (+$28/mo · 171.7%)
ⓘ Screening estimate from a state-policy table — verify with the county assessor before closing.
Climate risk First Street
- Flood 6/10 Major FEMA zone X (unshaded) · 71% chance over 30 yrs
- Wildfire 1/10 Low
- Heat 3/10 Moderate 7 d/yr ≥98°F today · 17 d/yr by 30 yrs out
- Wind 1/10 Low
- Air quality 3/10 Moderate 1 unhealthy d/yr today · 4 by 30 yrs out
Nearby sold comps map
Loading sold comps map…
Walkable amenities ~0.75 mi
Loading nearby amenities…
Taxation est. · year 1
- Rental income
- $12,334
- − Mortgage interest
- −$3,081
- − Property taxes
- −$194
- − Insurance
- −$275
- − Repairs & maintenance
- −$987
- − Management
- −$987
- − Depreciation
- −$1,600
- Taxable income
- $5,211
- Est. tax owed @ 24.0%
- −$1,251
- After-tax cash flow
- $4,563/yr
For passive investors: Depreciation is non-cash, so a rental often shows a tax loss while cash-flowing — sheltering income. Rental losses are passive: they offset passive income freely, and up to $25,000/yr can offset ordinary (W-2) income if you actively participate and your MAGI is under $100k (phasing out to $0 by $150k); unused losses carry forward. On sale, claimed depreciation is recaptured at up to 25%, and gains may owe capital-gains tax (a 1031 exchange can defer both). Figures are a year-1 estimate at your 24.0% rate — not tax advice; consult a CPA.
Schools (NCES district)
- District
- Warren City
- NCES district ID
- 3904499
- Math proficiency
- 22% ▼ -16.00%
- Reading proficiency
- 32% ▼ -9.00%
- Median HH income
- $28,222
- Composite
- 21.6/100
- National rank
- #8299
- State rank
- #599 of 656 in OH
Livability — Warren
- Score
- 73/100
- State rank
- #312
- US rank
- #5068
Category grades
Schools grade is shown separately in the Schools card above.
Census & demographics
- Census place
- Warren, OH
- County
- Trumbull · 193,293 people
- City population
- 25,805
- Metro
- Youngstown-Warren, OH
- Population (ZIP)
- 15,194
- Household income
- $33,720
- Rent vs Own
- Severe rent burden
- 14.2
Population outlook (Trumbull County) Hauer SSP2
- Today (2025)
- 191,696 people
- By 2030
- 184,015 · -4.0%
- By 2040
- 166,810 · -13.0%
- By 2050
- 149,857 · -21.8%
- By 2075
- 115,769 · -39.6%
- By 2100
- 83,617 · -56.4%
Race, ethnicity, and origin ACS 2023
- Neighborhood character
- Diverse neighborhood (Simpson 0.57)
- Race & ethnicity
- White 54% Black 38% Two or more races 5% Hispanic / Latino 3%
- Common ancestry
- Lithuanian 1% Slovak 1% Iranian 1%
- Foreign-born
- 1%
- Languages at home
- 99% English-only · Other Indo-European 1%
Political lean MEDSL · Trumbull
- 2024 margin
- R (+16.8) · D 41.2% · R 58.0%
- 2008→2024 swing
- -39.2pp toward R · 2008: 22.4pp · 2024: -16.8pp
- All cycles
- 2024: R+16.8 2020: R+10.6 2016: R+6.4 2012: D+22.2 2008: D+22.4
Not yet ingested
- Civics
- —
Market trends
- HPI YoY
- ▼ -1.14%
- Current HPI
- 212.5324
- Rent YoY
- —
- Metro
- —
- State GDP YoY
- ▲ 1.98%
- F500 in state
- 48
Industry mix (Fortune 500 HQ in OH)
| Industry | F500 HQs | Revenue |
|---|---|---|
| Insurance | 3 | $145B |
|
||
| Industrial Machinery | 3 | $49B |
|
||
| Financial Services | 3 | $24B |
|
||
| Consumer Goods | 2 | $93B |
|
||
| Aerospace / Defense | 2 | $47B |
|
||
| Utilities | 2 | $33B |
|
||
Price history
+455.5% since first listed7 events — show timeline
- 2026-06-05 Listed $54,999 MLSNOW
- 2020-03-13 Listing Removed — MLSNOW
- 2020-02-05 Price Changed $32,900 MLSNOW
- 2019-11-13 Listed $37,500 MLSNOW
- 2016-12-15 Sold (MLS) $9,500 MLSNOW
- 2016-12-06 Pending — MLSNOW
- 2016-11-18 Listed $9,900 MLSNOW
Property tax history
-6.0%/yrLatest (2025): $194 · +1.9% YoY. Source: county tax records.
Cash-flow waterfall
monthlySold comps — $/sqft
last 12 mo · ≤1 miLoading sold comps…