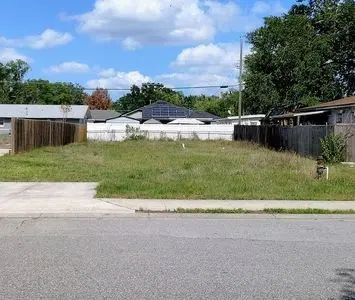
1503 Melanie Dr · Union Park, FL
Flood risk 1/10 · Minimal
- FEMA flood zone
- X (unshaded)
- Chance of flooding over 30 yrs
- 0.0%
- Est. flood insurance / yr
- $507 – $1,088
Fire risk 3/10 · Minor
- Est. fire insurance / yr
- $947 – $1,759
Heat risk 9/10 · Severe
- Hot days now (above 108°F)
- 7 days/yr
- Hot days in 30 yrs
- 23 days/yr
Wind risk 9/10 · Severe
- Chance of severe wind over 30 yrs
- 99.0%
Air-quality risk 2/10 · Minimal
- Unhealthy air days now
- 0 days/yr
- Unhealthy air days in 30 yrs
- 1 days/yr
Risk factors via First Street. Map © Google.
Why this score? — see what drove the B- grade
The composite is a weighted blend of 9 inputs, each scored 0–100. Each bar is that input's sub-score; the figure is the points it added to the 100-point composite (weight × sub-score).
- Cash flow +30.0/30.0
- DSCR +10.0/10.0
- 1% rule +8.5/10.0
- ARV discount +7.5/15.0
- Schools +4.1/10.0
- Livability +4.0/5.0
- Rent growth +3.2/5.0
- Condition / age +2.5/5.0
- Appreciation +0.0/10.0
$140,000
🖨 Deal sheet 📄 Offer letter ✓ Due diligence
Listing remarks MLS
Great lot in Cheney Heights area. Close to highways, shopping entertainment and parks. Bring your ideas, designs, and best offers!
Key facts
- Clear lot
- Built 1965
- Listed 31 days
Tags
Neighborhood map
What this means for you Summary
Snapshot
- This is a 3-bed/1.0-bath land listed at $140k.
Deal economics
- At list price, monthly cash flow is $585 ($7k/yr) — positive.
- The deal already cash-flows at list — no discount required.
- Meets the 1% rule at list price ($2k rent vs $140k).
- Recommended offer: $136k (3.0% below list) — sets the bar for market timing.
- Cap rate 11.3% vs local median 4.2% in Union Park — top-decile yield for the area; either an underpriced asset or a hidden risk that comps aren't pricing in. Stress-test before assuming the spread holds.
Location & tenants
- Location reads 79/100 on livability (#153 in FL, #2,308 nationally) — a middle-class / working-renter tenant base. Strengths: housing A+, cost of living A, commute A-; Watch: amenities F, health & safety F.
- Orange (suburban): math 46% / reading 51% proficiency, ranked #43 of 73 in FL (top 59%) — families likely to look elsewhere, expect single-tenant / working-renter base with shorter leases.
- Market conditions: Rents rising (+2.8%/yr); 279 active listings in the ZIP; 18 comparable units currently listed for rent nearby; rentals leasing fast (median 8d on market — plan ~1-2 weeks tenant-placement turnaround); solid renter incomes; 8,053 units permitted in Orange County in 2024 (3,133 in 5+ unit buildings).
Forward outlook
- Local home prices are declining (-3.0%/yr); year-one equity from $968 of loan paydown is wiped out by about $4k of value loss. Plan a longer hold.
- Orange County population projected at +52% by 2050 — long-run rental-demand tailwind backs the buy-and-hold thesis.
- At projected returns (-3.0% appreciation + 2.8% rent growth), your $39k cash investment doubles in ~7 years — after that, you're playing with house money.
Negotiation context
- It's been on market 32 days — a 3% lower offer ($136k) is reasonable based on typical stale-listing flexibility.
- 6 sale attempts since 22y ago with the ask held roughly flat each time — persistent listings suggest the price (not the market) is what's stuck; bring a comps-based counter.
- Current owner paid $65k; list at $140k implies a 115% gain — meaningful room to come down on a strong offer.
Risks & watch-outs
- Climate carrying-cost: severe wind risk, 99% chance of damaging wind over 30y; extreme-heat days projected 7→23/yr by 2055 (HVAC capex compounding) — expect insurance premiums to compound above CPI over the hold.
Questions for the listing agent
- It's been on market 32 days. Have you received any prior offers? Is the seller open to a 3% concession, seller financing, or rate buy-down credit?
- Built in 1965 — when were the roof, HVAC, electrical panel, plumbing, and water heater last replaced?
- Is there a deadline driving the sale (1031 exchange, divorce, estate, relocation)? That informs how much negotiation room exists.
- Schools are B-rated — typically a magnet for longer-tenancy family renters. What's the average tenant stay here, and is there a school-zone premium baked into asking?
- What's the average days-on-market for RENTAL listings here right now (not sales)? A rising rental-DOM trend means longer vacancies and softer asking-rent achievability than the comps imply.
- What's the recent tenant-quality profile in this submarket — average credit score on applications, eviction rate, late-payment / NSF rate, and stable-employment percentage? A property-management company in the area should have these aggregated.
- How much new for-sale + rental construction is in the pipeline within 1–3 miles? Heavy new supply typically softens prices + rents 12–24 months out; constrained supply supports both.
Investment metrics
- 1% rule
- 1.35% ✓
- Cap rate
- 11.31%
- Cash-on-cash
- 17.90%
- DSCR
- 1.80
- GRM
- 6.2
CMA / ARV
No comps found within radius.
Projected returns pro-forma
-3.0% appreciation · 2.77% rent growth · sell at horizon
- IRR
- 9.2%
- Equity multiple
- 1.36×
- Total profit
- $14,116
- Equity at exit
- $20,874
- IRR
- 18.2%
- Equity multiple
- 2.49×
- Total profit
- $58,433
- Equity at exit
- $12,105
Cash invested: $39,200 (down + closing). Projections, not guarantees.
Landlord ↔ Tenant lean methodology
- Overall (STATE)
- 87 Strongly Landlord-Friendly
- State Florida
- 87 Strongly Landlord-Friendly · R+3
- County
- — inherits STATE
- City
- — inherits STATE
ZIP-level market 32825
- Rents YoY
- 2.8%
- Active inventory
- 279
- Price-to-rent
- 6.2×
Monthly cashflow live
- Estimated rent
- $1,884 high interval (Pro) →
- Mortgage (P&I)
- −$734
- Tax from tax record
- −$111 /mo · $1,328/yr
- Insurance
- −$58
- HOA
- −$0
- Vacancy / Maint / Mgmt
- −$396
- Net cashflow
- $585
Break-even live
UW: 25.0% down · 7.5% · 30yr · 1.5% tax · 5.0% vac · 8.0% maint · 8.0% mgmt
Financing live
Cash to close
- Down payment
- $35,000
- Closing costs
- $4,200
- Reserves months
- —
- Total cash needed
- —
Loan-product check · same deal, 3 products live
Conventional
25% down · 7.5% · 30yr
- Down + closing
- —
- Monthly P&I
- —
- Monthly cashflow
- —
- DSCR
- —
- Eligible?
- —
Personal DTI + credit; lowest rate.
DSCR
20% down · 8.5% · 30yr
- Down + closing
- —
- Monthly P&I
- —
- Monthly cashflow
- —
- DSCR
- —
- Eligible?
- —
No personal income docs; deal must DSCR.
Hard money
10% down · 12.0% · 12mo
- Down + closing
- —
- Monthly P&I
- —
- Monthly cashflow
- —
- DSCR
- —
- Eligible?
- —
Short-term bridge; refi at stabilization.
Rent comps 18 comps
| Address | Beds | Baths | Sqft | Rent | $/sqft | DOM | Units | Dist |
|---|---|---|---|---|---|---|---|---|
| 933 Vista Palma Way Orlando, FL | 3.0 | 2.0 | 1016 | $2,150 | $2.12 | 23d | 1 | 0.53mi |
| 2282 Grenwich Ave #2282 Orlando, FL | 2.0 | 2.0 | 978 | $1,345 | $1.38 | 23d | 1 | 0.62mi |
| 9201 Nelson Park Cir Orlando, FL | 1.0–3.0 | 1.0–2.0 | 844 | $1,839 | $2.18 | 2d | 25 | 0.71mi |
| 1222 Tino Ct Orlando, FL | 2.0 | 2.0 | 1000 | $1,575 | $1.57 | 7d | 1 | 0.82mi |
| 2300 Econ Cir Orlando, FL | 1.0–2.0 | 1.0–2.0 | 897 | $1,558 | $1.74 | 14d | 1 | 0.82mi |
| 10039 Massey St Orlando, FL | 2.0 | 2.0 | 948 | $1,595 | $1.68 | 2d | 1 | 0.86mi |
| 10041 Massey St Alafaya, FL | 2.0 | 2.0 | 948 | $1,595 | $1.68 | 23d | 1 | 0.87mi |
| 1312 Ravida Cir Orlando, FL | 2.0 | 2.0 | 1044 | $1,650 | $1.58 | 3d | 1 | 0.96mi |
| 1000 Avida Village Cir Orlando, FL | 1.0–3.0 | 1.0–2.0 | 977 | $2,488 | $2.55 | 1d | 22 | 1.07mi |
| 8211 Sun Spring Cir #41 Orlando, FL | 2.0 | 2.0 | 1064 | $1,499 | $1.41 | 4d | 1 | 1.19mi |
| 2211 River Park Cir Orlando, FL | 1.0–3.0 | 1.0–2.0 | 888 | $1,928 | $2.17 | 21d | 1 | 1.22mi |
| 8215 Sun Spring Cir #23 Orlando, FL | 2.0 | 2.0 | 1064 | $1,550 | $1.46 | 21d | 1 | 1.24mi |
| 8225 Claire Ann Dr #203 Orlando, FL | 2.0 | 2.0 | 1046 | $1,725 | $1.65 | 3d | 1 | 1.38mi |
| 7909 Richwood Dr Orlando, FL | 2.0 | 2.0 | 936 | $1,950 | $2.08 | 21d | 1 | 1.38mi |
| 8103 Lillies Way #107 Orlando, FL | 2.0 | 2.0 | 1000 | $1,600 | $1.60 | 7d | 1 | 1.39mi |
| 604 Laurel Cove Ct Orlando, FL | 1.0–3.0 | 1.0–2.0 | 892 | $1,968 | $2.21 | 1d | 15 | 1.42mi |
| 949 Crowsnest Cir Orlando, FL | 1.0–2.0 | 1.0–2.0 | 822 | $1,754 | $2.13 | 1d | 31 | 1.43mi |
| 8137 Claire Ann Dr #207 Orlando, FL | 2.0 | 2.0 | 1046 | $1,750 | $1.67 | 21d | 1 | 1.44mi |
Listing history 32 events
-
2026-06-18days on market $140,000 Active 32 DOM
-
2026-06-17days on market $140,000 Active 31 DOM
-
2026-06-16days on market $140,000 Active 30 DOM
-
2026-06-15days on market $140,000 Active 29 DOM
-
2026-06-13days on market $140,000 Active 27 DOM
-
2026-06-13days on market $140,000 Active 26 DOM
-
2026-06-09days on market $140,000 Active 23 DOM
-
2026-06-08days on market $140,000 Active 22 DOM
-
2026-06-07days on market $140,000 Active 21 DOM
-
2026-06-04days on market $140,000 Active 18 DOM
-
2026-06-03days on market $140,000 Active 17 DOM
-
2026-06-02days on market $140,000 Active 16 DOM
-
2026-06-02days on market $140,000 Active 15 DOM
-
2026-05-31days on market $140,000 Active 14 DOM
-
2026-05-18$140,000 Active
-
2023-07-11soldstatus $65,000 Closed 130-char remark
Show marketing remark (130 chars)
Great lot in Cheney Heights area. Close to highways, shopping entertainment and parks. Bring your ideas, designs, and best offers!
-
2023-06-14status Pending 130-char remark
Show marketing remark (130 chars)
Great lot in Cheney Heights area. Close to highways, shopping entertainment and parks. Bring your ideas, designs, and best offers!
-
2023-06-02$60,000 Active 130-char remark
Show marketing remark (130 chars)
Great lot in Cheney Heights area. Close to highways, shopping entertainment and parks. Bring your ideas, designs, and best offers!
-
2021-03-08soldstatus $138,000
-
2021-03-02soldstatus $138,000 Sold 22-char remark
Show marketing remark (22 chars)
For data purposes only
-
2021-01-21status Pending 22-char remark
Show marketing remark (22 chars)
For data purposes only
-
2021-01-13$138,000 Active 22-char remark
Show marketing remark (22 chars)
For data purposes only
-
2006-11-28historical
-
2006-09-27$168,000
-
2005-08-16soldstatus $140,000
-
2005-07-29soldstatus $140,000
-
2005-05-12$140,000
-
2005-01-26soldstatus $122,500
-
2005-01-10soldstatus $122,500
-
2004-06-14$120,000
-
2004-03-11soldstatus $57,000
-
1995-02-27soldstatus $54,000
ⓘ Source: listings_history table (triggers on properties + properties_extension) + one-shot
backfill from property_details.listing_events for pre-trigger history.
Tax reassessment forecast FL · Resets to sale price
- Current annual tax
- $1,328 · $111/mo
- Projected year-2 tax
- $1,328 · $111/mo
- Expected delta
- $0/yr ($0/mo · 0.0%)
ⓘ Screening estimate from a state-policy table — verify with the county assessor before closing.
Climate risk First Street
- Flood 1/10 Low FEMA zone X (unshaded) · 0% chance over 30 yrs
- Wildfire 3/10 Moderate
- Heat 9/10 Extreme 7 d/yr ≥108°F today · 23 d/yr by 30 yrs out
- Wind 9/10 Extreme 99% chance of damaging wind over 30 yrs
- Air quality 2/10 Low 0 unhealthy d/yr today · 1 by 30 yrs out
Nearby sold comps map
Loading sold comps map…
Walkable amenities ~0.75 mi
Loading nearby amenities…
Taxation est. · year 1
- Rental income
- $22,603
- − Mortgage interest
- −$7,842
- − Property taxes
- −$1,328
- − Insurance
- −$700
- − Repairs & maintenance
- −$1,808
- − Management
- −$1,808
- − Depreciation
- −$4,073
- Taxable income
- $5,043
- Est. tax owed @ 24.0%
- −$1,210
- After-tax cash flow
- $5,808/yr
For passive investors: Depreciation is non-cash, so a rental often shows a tax loss while cash-flowing — sheltering income. Rental losses are passive: they offset passive income freely, and up to $25,000/yr can offset ordinary (W-2) income if you actively participate and your MAGI is under $100k (phasing out to $0 by $150k); unused losses carry forward. On sale, claimed depreciation is recaptured at up to 25%, and gains may owe capital-gains tax (a 1031 exchange can defer both). Figures are a year-1 estimate at your 24.0% rate — not tax advice; consult a CPA.
Schools (NCES district)
- District
- Orange
- NCES district ID
- 1201440
- Math proficiency
- 46% ▼ -9.00%
- Reading proficiency
- 51% ▼ -2.00%
- Median HH income
- $49,350
- Composite
- 41.47/100
- National rank
- #3461
- State rank
- #43 of 73 in FL
Livability — Union Park
- Score
- 79/100
- State rank
- #153
- US rank
- #2308
Category grades
Schools grade is shown separately in the Schools card above.
Census & demographics
- County
- Orange County · 1,471,359 people
- Metro
- Orlando-Kissimmee-Sanford, FL
- Population (ZIP)
- 63,698
- Household income
- $81,651
- Rent vs Own
- Severe rent burden
- 1458.0
Population outlook (Orange County) Hauer SSP2
- Today (2025)
- 1,618,226 people
- By 2030
- 1,787,404 · +10.5%
- By 2040
- 2,125,621 · +31.4%
- By 2050
- 2,454,016 · +51.6%
- By 2075
- 3,173,711 · +96.1%
- By 2100
- 3,607,781 · +122.9%
Race, ethnicity, and origin ACS 2023
- Neighborhood character
- Diverse neighborhood (Simpson 0.66)
- Race & ethnicity
- Hispanic / Latino 47% White 32% Two or more races 23% Black 11% Asian 7%
- Hispanic origin (detail)
- Mexican 2% Puerto Rican 25% Cuban 6% Dominican 3%
- Common ancestry
- Lithuanian 1% Romanian 1% Slovak 1%
- Foreign-born
- 20% · Canada, Vietnam, Jamaica
- Languages at home
- 56% English-only · Spanish 35% Other Indo-European 3% Vietnamese 2%
Political lean MEDSL · Orange
- 2024 margin
- D (+13.6) · D 56.1% · R 42.5% · Other 1.3%
- 2008→2024 swing
- -5.0pp toward R · 2008: 18.6pp · 2024: 13.6pp
- All cycles
- 2024: D+13.6 2020: D+23.1 2016: D+24.6 2012: D+18.2 2008: D+18.6
Not yet ingested
- Civics
- —
Market trends
- HPI YoY
- ▼ -171.52%
- Current HPI
- 315.8496
- Rent YoY
- ▲ 2.77%
- Metro
- Orlando-Kissimmee-Sanford, FL
- State GDP YoY
- ▲ 3.28%
- F500 in state
- 36
Industry mix (Fortune 500 HQ in FL)
| Industry | F500 HQs | Revenue |
|---|---|---|
| Industrial Technology | 2 | $29B |
|
||
| Insurance | 2 | $17B |
|
||
| Retail | 1 | $60B |
|
||
| Technology Distribution | 1 | $58B |
|
||
| Homebuilding | 1 | $35B |
|
||
| Technology Manufacturing | 1 | $35B |
|
||
Price history
+159.3% since first listed18 events — show timeline
- 2026-05-18 Listed $140,000 FSBO.com
- 2023-07-11 Sold (MLS) $65,000 Stellar MLS as Distributed by MLS Grid
- 2023-06-14 Pending — Stellar MLS as Distributed by MLS Grid
- 2023-06-02 Listed $60,000 Stellar MLS as Distributed by MLS Grid
- 2021-03-08 Sold (Public Records) $138,000 Public Records
- 2021-03-02 Sold (MLS) $138,000 Stellar MLS as Distributed by MLS Grid
- 2021-01-21 Pending — Stellar MLS as Distributed by MLS Grid
- 2021-01-13 Listed $138,000 Stellar MLS as Distributed by MLS Grid
- 2006-11-28 Listing Removed — Stellar MLS as Distributed by MLS Grid
- 2006-09-27 Listed $168,000 Stellar MLS as Distributed by MLS Grid
- 2005-08-16 Sold (Public Records) $140,000 Public Records
- 2005-07-29 Sold (MLS) $140,000 Stellar MLS as Distributed by MLS Grid
- 2005-05-12 Listed $140,000 Stellar MLS as Distributed by MLS Grid
- 2005-01-26 Sold (Public Records) $122,500 Public Records
- 2005-01-10 Sold (MLS) $122,500 Stellar MLS as Distributed by MLS Grid
- 2004-06-14 Listed $120,000 Stellar MLS as Distributed by MLS Grid
- 2004-03-11 Sold (Public Records) $57,000 Public Records
- 1995-02-27 Sold (Public Records) $54,000 Public Records
Property tax history
+0.5%/yrLatest (2025): $1,328 · +16.8% YoY. Source: county tax records.
Cash-flow waterfall
monthlySold comps — $/sqft
last 12 mo · ≤1 miLoading sold comps…