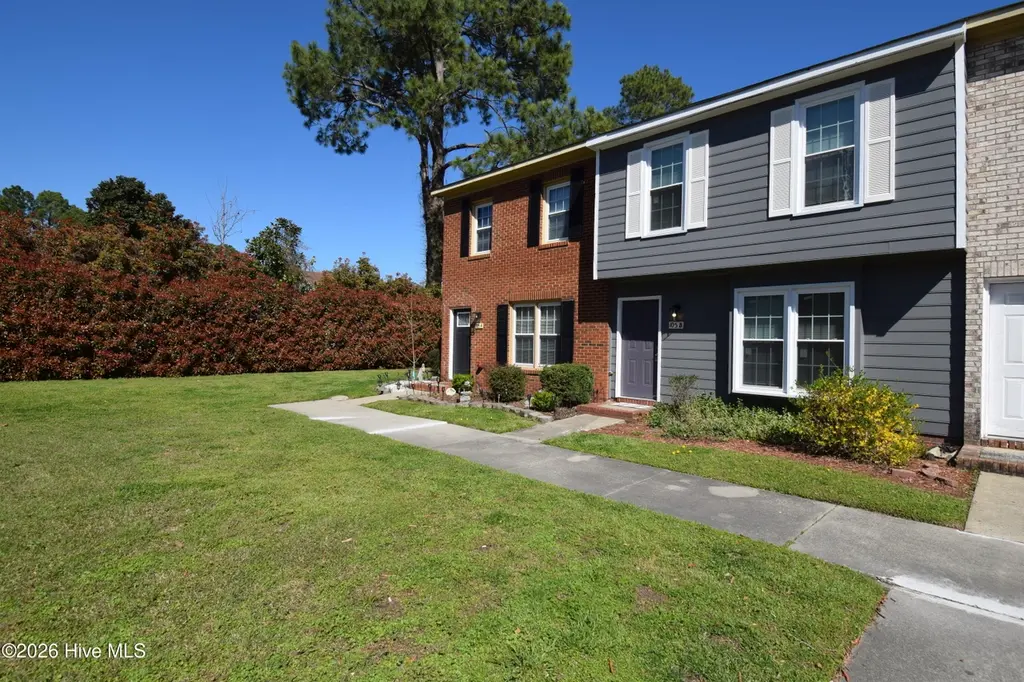
105 Concord Dr Unit B · Greenville, NC
Flood risk 1/10 · Minimal
- FEMA flood zone
- X (unshaded)
- Chance of flooding over 30 yrs
- 0.0%
- Est. flood insurance / yr
- $507 – $1,088
Fire risk 2/10 · Minimal
- Est. fire insurance / yr
- $906 – $1,684
Heat risk 8/10 · Major
- Hot days now (above 106°F)
- 7 days/yr
- Hot days in 30 yrs
- 17 days/yr
Wind risk 8/10 · Major
- Chance of severe wind over 30 yrs
- 80.0%
Air-quality risk 3/10 · Minor
- Unhealthy air days now
- 3 days/yr
- Unhealthy air days in 30 yrs
- 3 days/yr
Risk factors via First Street. Map © Google.
Why this score? — see what drove the D grade
The composite is a weighted blend of 9 inputs, each scored 0–100. Each bar is that input's sub-score; the figure is the points it added to the 100-point composite (weight × sub-score).
- Cash flow +13.6/30.0
- ARV discount +7.5/15.0
- DSCR +4.1/10.0
- Rent growth +3.9/5.0
- Livability +3.9/5.0
- 1% rule +3.6/10.0
- Schools +3.6/10.0
- Condition / age +2.5/5.0
- Appreciation +0.0/10.0
$130,000
🖨 Deal sheet (PDF) 📄 Offer letter ✓ Due diligence
Listing remarks
Welcome home to convenience, comfort, and versatility! This charming townhome is perfectly situated within walking distance to shopping and dining, making everyday living effortless. Step inside to a spacious great room that flows seamlessly into the dining area--ideal for entertaining or relaxing at home. New LVP floors installed throughout and updated lighting. The open-concept kitchen offers abundant countertop space and features brand new stainless steel appliances, perfect for both everyday meals and hosting guests. Natural light pours into the dining room through beautiful new French doors, leading out to a private patio complete with a storage room--your own peaceful outdoor retreat.
Key facts
- Spacious great room
- Open-concept kitchen
- Private patio
Tags
Neighborhood map
What this means for you Summary
Snapshot
- This is a 2-bed/1.5-bath condo listed at $130k.
Deal economics
- At list price, monthly cash flow is $7 ($80/yr) — positive.
- The deal already cash-flows at list — no discount required.
- To meet the 1% rule (rent ≥ 1% of price), the offer needs to be $112k (13.5% below list).
- Recommended offer: $112k (13.5% below list) — sets the bar for 1% rule.
- Cap rate 6.4% vs local median 3.8% in Greenville — top-decile yield for the area; either an underpriced asset or a hidden risk that comps aren't pricing in. Stress-test before assuming the spread holds.
Location & tenants
- Location reads 77/100 on livability (#30 in NC, #2,977 nationally) — a middle-class / working-renter tenant base. Strengths: commute A+, cost of living A+, health & safety A+; Watch: crime F, employment F.
- Pitt County Schools (rural): math 41% / reading 44% proficiency, ranked #100 of 178 in NC (top 56%) — families likely to look elsewhere, expect single-tenant / working-renter base with shorter leases.
- Zoned schools: Wintergreen Primary (722 students, 45% FRL); E B Aycock Middle (math 27% / reading 30%, grade F, #355 of 475 statewide, top 76%, 661 students, 99% FRL); Junius H Rose High (math 52% / reading 61%, grade C, #261 of 535 statewide, top 49%, 1,525 students, 50% FRL).
- Market conditions: Rents rising fast (+5.4%/yr); 356 active listings in the ZIP; 29 comparable units currently listed for rent nearby; rentals at typical pace (median 23d on market — plan ~3-4 weeks tenant-placement turnaround); 1,300 units permitted in Pitt County in 2024 (204 in 5+ unit buildings).
Forward outlook
- Local home prices are declining (-3.0%/yr); year-one equity from $899 of loan paydown is wiped out by about $4k of value loss. Plan a longer hold.
- Pitt County population projected at +22% by 2050 — long-run rental-demand tailwind backs the buy-and-hold thesis.
Negotiation context
- It's been on market 40 days — a 3% lower offer ($126k) is reasonable based on typical stale-listing flexibility.
- Current owner paid $45k; list at $130k implies a 189% gain — meaningful room to come down on a strong offer.
Risks & watch-outs
- Climate carrying-cost: severe wind risk, 80% chance of damaging wind over 30y; extreme-heat days projected 7→17/yr by 2055 (HVAC capex compounding) — expect insurance premiums to compound above CPI over the hold.
Questions for the listing agent
- It's been on market 40 days. Have you received any prior offers? Is the seller open to a 14% concession, seller financing, or rate buy-down credit?
- What does the HOA fee cover, when was the last increase, and are there any pending special assessments or reserve-fund shortfalls?
- Any open or pending special assessments — roof, HVAC, plumbing, elevator, façade? What's the per-unit balance and payoff schedule, and is the seller paying it off at close or rolling it to the buyer?
- Is there a deadline driving the sale (1031 exchange, divorce, estate, relocation)? That informs how much negotiation room exists.
- Crime grade is F in this area — have there been break-ins, vandalism, or insurance claims at this property in the last 3 years? What carrier currently insures it and at what premium?
- The area grade is low — what's the realistic commute time and amenity access for the typical tenant pool here? Any planned neighborhood developments (good or bad) we should know about?
- What's the average days-on-market for RENTAL listings here right now (not sales)? A rising rental-DOM trend means longer vacancies and softer asking-rent achievability than the comps imply.
- What's the recent tenant-quality profile in this submarket — average credit score on applications, eviction rate, late-payment / NSF rate, and stable-employment percentage? A property-management company in the area should have these aggregated.
- How much new apartment / multifamily construction is in the pipeline within 1–3 miles? Heavy new supply (>2% of stock underway) typically softens rents 12–24 months out; light construction supports rent growth.
Investment metrics
- 1% rule
- 0.86% ✗
- Cap rate
- 6.35%
- Cash-on-cash
- 0.22%
- DSCR
- 1.01
- GRM
- 9.6
CMA / ARV
No comps found within radius.
Projected returns pro-forma
-3.0% appreciation · 5.44% rent growth · sell at horizon
- IRR
- -13.3%
- Equity multiple
- 0.51×
- Total profit
- $-17,805
- Equity at exit
- $19,383
- IRR
- -1.0%
- Equity multiple
- 0.92×
- Total profit
- $-2,731
- Equity at exit
- $11,240
Cash invested: $36,400 (down + closing). Projections, not guarantees.
Landlord ↔ Tenant lean methodology
- Overall (STATE)
- 85 Strongly Landlord-Friendly
- State North Carolina
- 85 Strongly Landlord-Friendly · R+3
- County
- — inherits STATE
- City
- — inherits STATE
ZIP-level market 27834
- Rents YoY
- 5.4%
- Active inventory
- 356
- Price-to-rent
- 9.6×
Monthly cashflow live
- Estimated rent
- $1,124 high interval (Pro) →
- Mortgage (P&I)
- −$682
- Tax from tax record
- −$90 /mo · $1,077/yr
- Insurance
- −$54
- HOA
- −$56
- Vacancy / Maint / Mgmt
- −$236
- Net cashflow
- $7
Break-even live
Sensitivity live
| Price | -10% $80 | -5% $43 | +0% $7 | +5% $-30 | +10% $-67 |
|---|---|---|---|---|---|
| Rent | -10% $-82 | -5% $-38 | +0% $7 | +5% $51 | +10% $96 |
| Rate | -1.0pp $72 | -0.5pp $40 | base $7 | +0.5pp $-27 | +1.0pp $-61 |
UW: 25.0% down · 7.5% · 30yr · 1.5% tax · 5.0% vac · 8.0% maint · 8.0% mgmt
Financing live
Cash to close
- Down payment
- $32,500
- Closing costs
- $3,900
- Reserves months
- —
- Total cash needed
- —
Loan-product check · same deal, 3 products live
Conventional
25% down · 7.5% · 30yr
- Down + closing
- —
- Monthly P&I
- —
- Monthly cashflow
- —
- DSCR
- —
- Eligible?
- —
Personal DTI + credit; lowest rate.
DSCR
20% down · 8.5% · 30yr
- Down + closing
- —
- Monthly P&I
- —
- Monthly cashflow
- —
- DSCR
- —
- Eligible?
- —
No personal income docs; deal must DSCR.
Hard money
10% down · 12.0% · 12mo
- Down + closing
- —
- Monthly P&I
- —
- Monthly cashflow
- —
- DSCR
- —
- Eligible?
- —
Short-term bridge; refi at stabilization.
Rent comps 29 comps
| Address | Beds | Baths | Sqft | Rent | $/sqft | DOM | Units | Dist |
|---|---|---|---|---|---|---|---|---|
| 1510 Bridle Ct Greenville, NC | 1.0–3.0 | 1.0–2.0 | 798 | $1,062 | $1.33 | 23d | 1 | 0.21mi |
| 3260 Landmark St Greenville, NC | 2.0 | 1.5 | 1042 | $1,000 | $0.96 | 23d | 1 | 0.55mi |
| 3278 Colony Ct Greenville, NC | 1.0–3.0 | 1.0–2.0 | 1170 | $1,188 | $1.01 | 23d | 1 | 0.57mi |
| 352 Haven Dr Greenville, NC | 2.0 | 1.5 | 1042 | $995 | $0.95 | 23d | 1 | 0.68mi |
| 3300 Evans St Greenville, NC | 1.0–2.0 | 1.0 | 700 | $1,050 | $1.50 | 23d | 1 | 0.70mi |
| 3212 Summer Pl #6 Greenville, NC | 1.0 | 1.0 | 900 | $799 | $0.89 | 23d | 1 | 0.87mi |
| 111 Lakeview Ter Greenville, NC | 2.0–3.0 | 1.0–2.0 | 750 | $1,010 | $1.35 | 15d | 7 | 0.87mi |
| 3214 Summer Pl #10 Greenville, NC | 1.0 | 1.0 | 900 | $799 | $0.89 | 23d | 1 | 0.89mi |
| 220 Orlando Way Unit C Greenville, NC | 1.0 | 1.0 | 880 | $1,100 | $1.25 | 23d | 1 | 0.90mi |
| 212 Orlando Way Unit C Greenville, NC | 1.0 | 1.0 | 880 | $1,100 | $1.25 | 23d | 1 | 0.95mi |
| 2207 Wandsworth Dr Greenville, NC | 1.0–2.0 | 1.0 | 650 | $900 | $1.38 | 15d | 5 | 1.06mi |
| 2613 Whitaker Dr Greenville, NC | 2.0 | 1.0 | 853 | $1,004 | $1.18 | 23d | 1 | 1.10mi |
| 3003 Caldwell Ct Unit 1 Greenville, NC | 1.0 | 1.0 | 900 | $799 | $0.89 | 23d | 1 | 1.13mi |
| 1604 W Arlington Blvd Greenville, NC | 1.0–2.0 | 1.0 | 624 | $1,125 | $1.80 | 15d | 11 | 1.20mi |
| 1151 Cross Creek Cir Greenville, NC | 3.0 | 2.5 | 1338 | $1,600 | $1.20 | 23d | 1 | 1.20mi |
| 1151 Cross Creek Cir Unit D Greenville, NC | 3.0 | 2.5 | 1338 | $1,550 | $1.16 | 15d | 1 | 1.21mi |
| 14a Merry Ln Greenville, NC | 1.0–3.0 | 1.0–2.5 | 1150 | $1,222 | $1.06 | 15d | 14 | 1.22mi |
| 1150 Cross Creek Cir Greenville, NC | 2.0 | 2.0 | 1100 | $1,200 | $1.09 | 23d | 1 | 1.22mi |
| 301 Shiloh Dr Unit A Greenville, NC | 2.0 | 1.0 | 864 | $950 | $1.10 | 23d | 1 | 1.26mi |
| 203 Shiloh Dr Unit E Greenville, NC | 2.0 | 1.5 | 1000 | $1,130 | $1.13 | 23d | 1 | 1.29mi |
| 3324 Frontgate Dr Greenville, NC | 1.0–2.0 | 1.0 | 765 | $999 | $1.31 | 15d | 9 | 1.36mi |
| 3338 Frontgate Dr Unit 32-18 Greenville, NC | 1.0 | 1.0 | 721 | $849 | $1.18 | 23d | 1 | 1.39mi |
| 3338 Frontgate Dr Unit 22 Greenville, NC | 2.0 | 1.0 | 865 | $1,049 | $1.21 | 23d | 1 | 1.39mi |
| 1710 Garland St Greenville, NC | 2.0 | 1.0 | 884 | $1,195 | $1.35 | 23d | 1 | 1.39mi |
| 1035 Spring Forest Rd Greenville, NC | 3.0 | 2.0–2.5 | 1453 | $1,450 | $1.00 | 23d | 2 | 1.42mi |
| 1015 Spring Forest Rd Unit F5 Greenville, NC | 3.0 | 2.5 | 1453 | $1,200 | $0.83 | 23d | 1 | 1.43mi |
| 2928 Mulberry Ln Unit 2928E Greenville, NC | 2.0 | 2.0 | 1233 | $1,300 | $1.05 | 15d | 1 | 1.45mi |
| 600 Howell St Apt E Greenville, NC | 2.0 | 1.0 | 1050 | $815 | $0.78 | 23d | 1 | 1.47mi |
| 1111 Turtle Creek Rd Unit E Greenville, NC | 2.0 | 2.0 | 1400 | $1,400 | $1.00 | 23d | 1 | 1.50mi |
HOA detail condo
- Monthly dues
- $56 · $672/yr
- Assessments
- None detected in remarks — confirm with the listing agent.
Listing history 3 events
-
2026-04-28status Pending
-
2026-03-18$130,000 Active
-
2021-12-16soldstatus $45,000
ⓘ Source: listings_history table (triggers on properties + properties_extension) + one-shot
backfill from property_details.listing_events for pre-trigger history.
Tax reassessment forecast NC · Resets to sale price
- Current annual tax
- $1,077 · $90/mo
- Projected year-2 tax
- $1,077 · $90/mo
- Expected delta
- $0/yr ($0/mo · 0.0%)
ⓘ Screening estimate from a state-policy table — verify with the county assessor before closing.
Climate risk First Street
- Flood 1/10 Low FEMA zone X (unshaded) · 0% chance over 30 yrs
- Wildfire 2/10 Low
- Heat 8/10 Severe 7 d/yr ≥106°F today · 17 d/yr by 30 yrs out
- Wind 8/10 Severe 80% chance of damaging wind over 30 yrs
- Air quality 3/10 Moderate 3 unhealthy d/yr today · 3 by 30 yrs out
Nearby sold comps map
Loading sold comps map…
Walkable amenities ~0.75 mi
Loading nearby amenities…
Taxation est. · year 1
- Rental income
- $13,493
- − Mortgage interest
- −$7,282
- − Property taxes
- −$1,077
- − Insurance
- −$650
- − Repairs & maintenance
- −$1,079
- − Management
- −$1,079
- − HOA
- −$672
- − Depreciation
- −$3,782
- Taxable loss
- −$2,128
- Est. tax savings @ 24.0%
- +$511
- After-tax cash flow
- $591/yr
For passive investors: Depreciation is non-cash, so a rental often shows a tax loss while cash-flowing — sheltering income. Rental losses are passive: they offset passive income freely, and up to $25,000/yr can offset ordinary (W-2) income if you actively participate and your MAGI is under $100k (phasing out to $0 by $150k); unused losses carry forward. On sale, claimed depreciation is recaptured at up to 25%, and gains may owe capital-gains tax (a 1031 exchange can defer both). Figures are a year-1 estimate at your 24.0% rate — not tax advice; consult a CPA.
Schools (NCES district)
- District
- Pitt County Schools
- NCES district ID
- 3700012
- Math proficiency
- 41% ▬ 0.00%
- Reading proficiency
- 44% ▲ 2.00%
- Median HH income
- $40,631
- Composite
- 35.67/100
- National rank
- #4877
- State rank
- #100 of 178 in NC
Livability — Greenville
- Score
- 77/100
- State rank
- #30
- US rank
- #2977
Category grades
Schools grade is shown separately in the Schools card above.
Census & demographics
- Census place
- Greenville, NC
- County
- Pitt County · 142,592 people
- City population
- 115,121
- Metro
- Greenville, NC
- Population (ZIP)
- 56,347
- Household income
- $48,935
- Rent vs Own
- Severe rent burden
- 3319.0
Population outlook (Pitt County) Hauer SSP2
- Today (2025)
- 194,585 people
- By 2030
- 203,756 · +4.7%
- By 2040
- 220,807 · +13.5%
- By 2050
- 236,614 · +21.6%
- By 2075
- 275,940 · +41.8%
- By 2100
- 300,058 · +54.2%
Race, ethnicity, and origin ACS 2023
- Neighborhood character
- Diverse neighborhood (Simpson 0.59)
- Race & ethnicity
- Black 54% White 33% Hispanic / Latino 8% Two or more races 3% Asian 2%
- Hispanic origin (detail)
- Mexican 7%
- Common ancestry
- Lithuanian 1% Slovak 1% Romanian 1%
- Foreign-born
- 7% · Canada, China
- Languages at home
- 91% English-only · Spanish 6% Other Asian/Pacific 1%
Political lean MEDSL · Pitt
- 2024 margin
- Lean D (+6.0) · D 52.5% · R 46.5% · Other 1.1%
- 2008→2024 swing
- -2.8pp toward R · 2008: 8.8pp · 2024: 6.0pp
- All cycles
- 2024: D+6.0 2020: D+9.4 2016: D+7.4 2012: D+6.7 2008: D+8.8
Not yet ingested
- Civics
- —
Market trends
- HPI YoY
- ▼ -187.99%
- Current HPI
- 190.6869
- Rent YoY
- ▲ 5.44%
- Metro
- Greenville, NC
- State GDP YoY
- ▲ 3.28%
- F500 in state
- 26
Industry mix (Fortune 500 HQ in NC)
| Industry | F500 HQs | Revenue |
|---|---|---|
| Financial Services | 2 | $213B |
|
||
| Retail | 2 | $95B |
|
||
| Industrial Conglomerate | 1 | $38B |
|
||
| Metals / Steel | 1 | $35B |
|
||
| Utilities | 1 | $30B |
|
||
| Industrial Machinery | 1 | $19B |
|
||
Price history
+188.9% since first listed3 events — show timeline
- 2026-04-28 Pending — Hive MLS
- 2026-03-18 Listed $130,000 Hive MLS
- 2021-12-16 Sold (Public Records) $45,000 Public Records
Property tax history
+13.1%/yrLatest (2025): $1,077 · +1.1% YoY. Source: county tax records.
Cash-flow waterfall
monthlySold comps — $/sqft
last 12 mo · ≤1 miLoading sold comps…