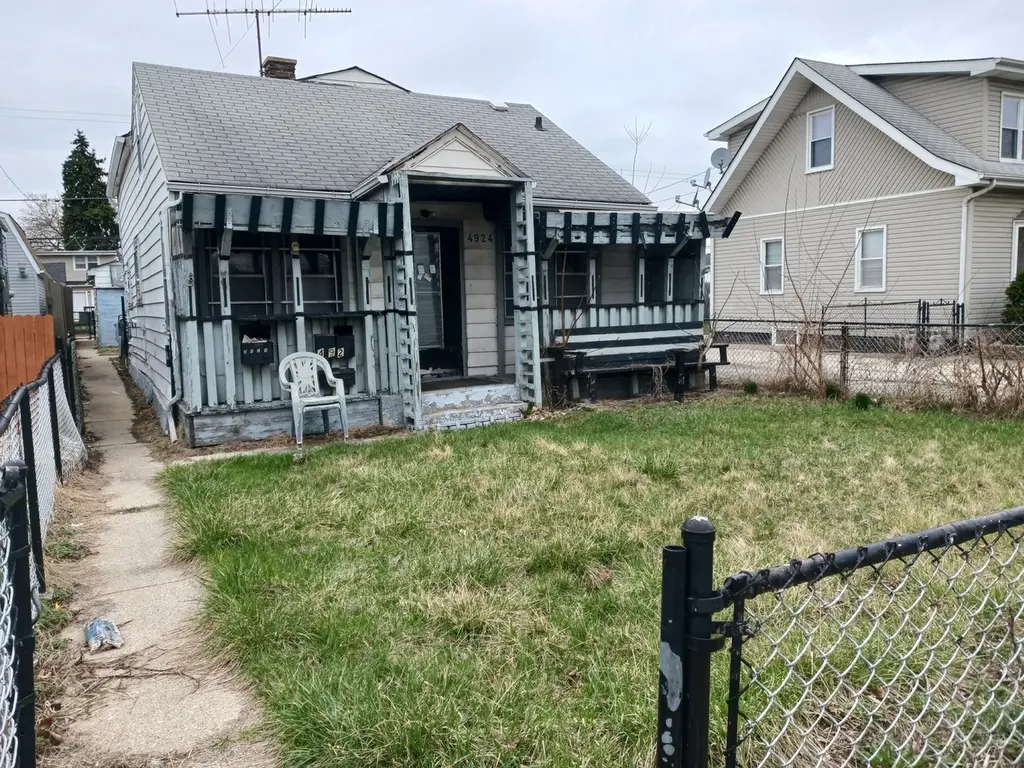
4924 S Lorel Ave · Chicago, IL
Flood risk 5/10 · Moderate
- FEMA flood zone
- X (unshaded)
- Chance of flooding over 30 yrs
- 0.51%
- Est. flood insurance / yr
- $507 – $1,088
Fire risk 1/10 · Minimal
- Est. fire insurance / yr
- $804 – $1,492
Heat risk 3/10 · Minor
- Hot days now (above 100°F)
- 7 days/yr
- Hot days in 30 yrs
- 15 days/yr
Wind risk 2/10 · Minimal
- Chance of severe wind over 30 yrs
- 0.0%
Air-quality risk 4/10 · Minor
- Unhealthy air days now
- 3 days/yr
- Unhealthy air days in 30 yrs
- 5 days/yr
Risk factors via First Street. Map © Google.
Why this score? — see what drove the B- grade
The composite is a weighted blend of 9 inputs, each scored 0–100. Each bar is that input's sub-score; the figure is the points it added to the 100-point composite (weight × sub-score).
- Cash flow +30.0/30.0
- 1% rule +10.0/10.0
- DSCR +10.0/10.0
- ARV discount +7.5/15.0
- Livability +3.9/5.0
- Rent growth +2.8/5.0
- Condition / age +2.5/5.0
- Schools +1.8/10.0
- Appreciation +0.0/10.0
$139,900
🖨 Deal sheet 📄 Offer letter ✓ Due diligence
Listing remarks
Handy rehab opportunity - good bones for a fixer upper. Prefer cash buyer or line-of-credit.
Key facts
- 3,780 sq ft lot
- 2 garage spots
- Built 1944
Property features AI
Finance
- Other: Property taxed (most recent tax information available); Possession at closing
- HOA & community: No master association fee required
Exterior
- Parking: Detached garage with 2 garage spaces; Garage owned with garage door opener; Off-alley parking (total 2 spaces)
- Utilities: Lake Michigan and public water available; Public sewer; Electric service with circuit breakers
- Home design: Detached single-family home; 2 stories; Fee simple ownership; Commuter bus and interstate access nearby; Unincorporated township (Stickney)
- Construction: Built approximately 81–90 years ago; Aluminum siding; Asphalt roof; Not rebuilt or rehabbed
- Exterior features: Sidewalks; Street lights; Paved streets; Lot dimensions approximately 30 x 126; Lot under 0.25 acre
Interior
- Kitchen: Range; Refrigerator
- Bedrooms: 3 bedrooms (master bedroom on main level, other bedrooms on main and second levels)
- Bathrooms: 1 full bathroom
- Heating & cooling: Natural gas forced air heating
- Interior features: 5 total rooms; Interior attic access via stair; Crawl space basement
- Laundry & utility: In-unit laundry; Washer; Dryer
Neighborhood map
What this means for you Summary
Snapshot
- This is a 3-bed/1.0-bath single-family listed at $140k.
Deal economics
- At list price, monthly cash flow is $736 ($9k/yr) — positive.
- The deal already cash-flows at list — no discount required.
- Meets the 1% rule at list price ($2k rent vs $140k).
- Recommended offer: $138k (1.5% below list) — sets the bar for market timing.
Location & tenants
- Location reads 78/100 on livability (#138 in IL, #2,507 nationally) — a middle-class / working-renter tenant base. Strengths: amenities A+, commute A+, housing A+; Watch: schools D, crime F.
- Reavis Twp Hsd 220 (suburban): math 18% / reading 21% proficiency, ranked #420 of 620 in IL (top 68%) — low school quality limits family demand, transient renter base, plan for 1-2y turnover.
- Market conditions: Rents rising (+1.3%/yr); 11 active listings in the ZIP; 1 comparable units currently listed for rent nearby; solid renter incomes; 6,272 units permitted in Cook County in 2024 (4,658 in 5+ unit buildings).
Forward outlook
- Local home prices are declining (-3.0%/yr); year-one equity from $967 of loan paydown is wiped out by about $4k of value loss. Plan a longer hold.
- At projected returns (-3.0% appreciation + 1.3% rent growth), your $39k cash investment doubles in ~6 years — after that, you're playing with house money.
Negotiation context
- It's been on market 24 days — a 2% lower offer ($138k) is reasonable based on typical stale-listing flexibility.
- 5 sale attempts; this cycle's ask has dropped $10k (7%) from the opening price — seller is motivated, your offer sets the floor, not the list.
- Current owner paid $30k; list at $140k implies a 366% gain — meaningful room to come down on a strong offer.
Risks & watch-outs
- Watch-outs: built in 1944 — expect roof / HVAC / electrical / plumbing capex.
- Climate carrying-cost: moderate flood risk — expect insurance premiums to compound above CPI over the hold.
Questions for the listing agent
- Built in 1944 — when were the roof, HVAC, electrical panel, plumbing, and water heater last replaced?
- Is there a deadline driving the sale (1031 exchange, divorce, estate, relocation)? That informs how much negotiation room exists.
- Schools are D-rated, which usually means shorter tenancies and higher turnover. Who's the typical renter profile here, and what's been the actual vacancy rate?
- Crime grade is F in this area — have there been break-ins, vandalism, or insurance claims at this property in the last 3 years? What carrier currently insures it and at what premium?
- What's the average days-on-market for RENTAL listings here right now (not sales)? A rising rental-DOM trend means longer vacancies and softer asking-rent achievability than the comps imply.
- What's the recent tenant-quality profile in this submarket — average credit score on applications, eviction rate, late-payment / NSF rate, and stable-employment percentage? A property-management company in the area should have these aggregated.
- How much new for-sale + rental construction is in the pipeline within 1–3 miles? Heavy new supply typically softens prices + rents 12–24 months out; constrained supply supports both.
Investment metrics
- 1% rule
- 1.60% ✓
- Cap rate
- 12.61%
- Cash-on-cash
- 22.54%
- DSCR
- 2.00
- GRM
- 5.2
CMA / ARV
- ARV (on-the-fly)
- $286,144
- Comps found
- 12
Show comp detail 12 sales within ~0.75 mi
| Address | Dist | Beds/Ba | Sqft | Sold | Price | $/sf | Match |
|---|---|---|---|---|---|---|---|
| 4901 S Lorel Ave | 0.06mi | 3/1.0 | 1,120 (+3%) | 1mo | $285,000 | $254 | 91 |
| 4857 S Lorel Ave | 0.08mi | 3/1.0 | 1,050 (-4%) | 2mo | $255,000 | $243 | 89 |
| 4805 S Latrobe Ave | 0.23mi | 3/2.0 | 1,080 (-1%) | 0mo | $310,000 | $287 | 84 |
| 4737 S Leamington Ave | 0.37mi | 3/1.0 | 1,092 (+0%) | 1mo | $241,500 | $221 | 81 |
| 4744 S Lorel St | 0.24mi | 3/1.5 | 1,126 (+4%) | 1mo | $230,000 | $204 | 81 |
| 5123 S Lotus Ave | 0.26mi | 3/2.0 | 1,040 (-4%) | 2mo | $340,000 | $327 | 75 |
| 5024 S Lockwood Ave | 0.14mi | 4/1.5 (+1) | 1,012 (-7%) | 2mo | $243,000 | $240 | 73 |
| 4727 S Lavergne Ave | 0.54mi | 4/2.0 (+1) | 1,067 (-2%) | 2mo | $300,000 | $281 | 61 |
| 5255 S Menard Ave | 0.68mi | 2/1.0 (-1) | 1,100 (+1%) | 1mo | $280,000 | $255 | 60 |
| 5113 S Mayfield Ave | 0.70mi | 2/1.0 (-1) | 1,056 (-3%) | 1mo | $305,000 | $289 | 57 |
| 4412 S Leamington Ave | 0.71mi | 3/1.5 | 988 (-9%) | 1mo | $320,000 | $324 | 49 |
| 4452 S Lawler Ave | 0.70mi | 3/2.0 | 1,008 (-7%) | 3mo | $265,000 | $263 | 49 |
Match score weights: distance 35% · size 25% · config 20% · recency 20%. Top-matched comps best support the ARV.
Projected returns pro-forma
-3.0% appreciation · 1.32% rent growth · sell at horizon
- IRR
- 13.4%
- Equity multiple
- 1.52×
- Total profit
- $20,548
- Equity at exit
- $20,860
- IRR
- 20.9%
- Equity multiple
- 2.63×
- Total profit
- $63,764
- Equity at exit
- $12,096
Cash invested: $39,172 (down + closing). Projections, not guarantees.
Landlord ↔ Tenant lean methodology
- Overall (CITY)
- 13 Strongly Tenant-Friendly
- State Illinois
- 43 Moderately Tenant-Leaning · D+7
- County
- — inherits STATE
- City Chicago
- 13 Strongly Tenant-Friendly · D+30
ZIP-level market 60638
- Rents YoY
- 1.3%
- Active inventory
- 11
- Price-to-rent
- 5.2×
Monthly cashflow live
- Estimated rent
- $2,243 medium interval (Pro) →
- Mortgage (P&I)
- −$734
- Tax from tax record
- −$244 /mo · $2,925/yr
- Insurance
- −$58
- HOA
- −$0
- Vacancy / Maint / Mgmt
- −$471
- Net cashflow
- $736
Break-even live
UW: 25.0% down · 7.5% · 30yr · 1.5% tax · 5.0% vac · 8.0% maint · 8.0% mgmt
Financing live
Cash to close
- Down payment
- $34,975
- Closing costs
- $4,197
- Reserves months
- —
- Total cash needed
- —
Loan-product check · same deal, 3 products live
Conventional
25% down · 7.5% · 30yr
- Down + closing
- —
- Monthly P&I
- —
- Monthly cashflow
- —
- DSCR
- —
- Eligible?
- —
Personal DTI + credit; lowest rate.
DSCR
20% down · 8.5% · 30yr
- Down + closing
- —
- Monthly P&I
- —
- Monthly cashflow
- —
- DSCR
- —
- Eligible?
- —
No personal income docs; deal must DSCR.
Hard money
10% down · 12.0% · 12mo
- Down + closing
- —
- Monthly P&I
- —
- Monthly cashflow
- —
- DSCR
- —
- Eligible?
- —
Short-term bridge; refi at stabilization.
Rent comps 1 comps
| Address | Beds | Baths | Sqft | Rent | $/sqft | DOM | Units | Dist |
|---|---|---|---|---|---|---|---|---|
| 4824 S Lotus Ave Unit G Chicago, IL | 2.0 | 1.0 | 750 | $1,400 | $1.87 | 4d | 1 | 0.17mi |
Listing history 27 events
-
2026-06-18days on market $139,900 Active 24 DOM
-
2026-06-17days on market $139,900 Active 23 DOM
-
2026-06-16days on market $139,900 Active 22 DOM
-
2026-06-15days on market $139,900 Active 21 DOM
-
2026-06-13days on market $139,900 Active 19 DOM
-
2026-06-13days on market $139,900 Active 18 DOM
-
2026-06-09days on market $139,900 Active 15 DOM
-
2026-06-08days on market $139,900 Active 14 DOM
-
2026-06-07pricedays on market $139,900 Active 13 DOM
-
2026-06-04days on market $149,900 Active 10 DOM
-
2026-06-03days on market $149,900 Active 9 DOM
-
2026-06-02days on market $149,900 Active 8 DOM
-
2026-06-01days on market $149,900 Active 7 DOM
-
2026-05-31days on market $149,900 Active 6 DOM
-
2026-05-25$149,900 Active
-
2026-05-15historical
-
2026-03-27Active
-
2025-10-23historical Contingent - Continue to Show
-
2025-10-20historical
-
2025-09-22status Active
-
2025-09-22price
-
2025-09-17historical Contingent - Continue to Show
-
2025-07-27Active
-
2025-07-26historical
-
2025-05-16price
-
2025-04-08Active
-
1988-03-01soldstatus $30,000
ⓘ Source: listings_history table (triggers on properties + properties_extension) + one-shot
backfill from property_details.listing_events for pre-trigger history.
Tax reassessment forecast IL · Partial reset (capped growth)
- Current annual tax
- $2,925 · $244/mo
- Projected year-2 tax
- $3,050 · $254/mo
- Expected delta
- +$125/yr (+$10/mo · 4.3%)
ⓘ Screening estimate from a state-policy table — verify with the county assessor before closing.
Climate risk First Street
- Flood 5/10 Major FEMA zone X (unshaded) · 51% chance over 30 yrs
- Wildfire 1/10 Low
- Heat 3/10 Moderate 7 d/yr ≥100°F today · 15 d/yr by 30 yrs out
- Wind 2/10 Low 0% chance of damaging wind over 30 yrs
- Air quality 4/10 Moderate 3 unhealthy d/yr today · 5 by 30 yrs out
Nearby sold comps map
Loading sold comps map…
Walkable amenities ~0.75 mi
Loading nearby amenities…
Taxation est. · year 1
- Rental income
- $26,911
- − Mortgage interest
- −$7,837
- − Property taxes
- −$2,925
- − Insurance
- −$700
- − Repairs & maintenance
- −$2,153
- − Management
- −$2,153
- − Depreciation
- −$4,070
- Taxable income
- $7,074
- Est. tax owed @ 24.0%
- −$1,698
- After-tax cash flow
- $7,133/yr
For passive investors: Depreciation is non-cash, so a rental often shows a tax loss while cash-flowing — sheltering income. Rental losses are passive: they offset passive income freely, and up to $25,000/yr can offset ordinary (W-2) income if you actively participate and your MAGI is under $100k (phasing out to $0 by $150k); unused losses carry forward. On sale, claimed depreciation is recaptured at up to 25%, and gains may owe capital-gains tax (a 1031 exchange can defer both). Figures are a year-1 estimate at your 24.0% rate — not tax advice; consult a CPA.
Schools (NCES district)
- District
- Reavis Twp Hsd 220
- NCES district ID
- 1733270
- Math proficiency
- 18% ▼ -3.00%
- Reading proficiency
- 21% ▼ -4.00%
- Median HH income
- $54,732
- Composite
- 17.94/100
- National rank
- #8994
- State rank
- #420 of 620 in IL
Livability — Chicago
- Score
- 78/100
- State rank
- #138
- US rank
- #2507
Category grades
Schools grade is shown separately in the Schools card above.
Census & demographics
- County
- Cook County · 4,486,803 people
- City population
- 2,653,011
- Metro
- Chicago-Naperville-Elgin, IL-IN-WI
- Population (ZIP)
- 57,074
- Household income
- $91,070
- Rent vs Own
- Severe rent burden
- 912.0
Population outlook (Cook County) Hauer SSP2
- Today (2025)
- 5,347,519 people
- By 2030
- 5,357,703 · +0.2%
- By 2040
- 5,324,924 · -0.4%
- By 2050
- 5,230,762 · -2.2%
- By 2075
- 4,785,735 · -10.5%
- By 2100
- 4,188,836 · -21.7%
Race, ethnicity, and origin ACS 2023
- Neighborhood character
- Majority Hispanic (60%)
- Race & ethnicity
- Hispanic / Latino 60% White 36% Two or more races 21% Black 2% Native American 2%
- Hispanic origin (detail)
- Mexican 54% Puerto Rican 3%
- Common ancestry
- Romanian 16% Scotch-Irish 1% Lithuanian 1%
- Foreign-born
- 24% · Canada, China
- Languages at home
- 44% English-only · Spanish 45% Russian/Polish/Slavic 9% Other Indo-European 1%
Political lean MEDSL · Cook
- 2024 margin
- Solid D (+42.0) · D 70.4% · R 28.4% · Other 1.2%
- 2008→2024 swing
- -11.4pp toward R · 2008: 53.4pp · 2024: 42.0pp
- All cycles
- 2024: D+42.0 2020: D+50.3 2016: D+53.0 2012: D+49.4 2008: D+53.4
Not yet ingested
- Civics
- —
Market trends
- HPI YoY
- ▼ -276.94%
- Current HPI
- 233.5662
- Rent YoY
- ▲ 1.32%
- Metro
- Chicago-Naperville-Elgin, IL-IN-WI
- State GDP YoY
- ▲ 1.59%
- F500 in state
- 60
Industry mix (Fortune 500 HQ in IL)
| Industry | F500 HQs | Revenue |
|---|---|---|
| Insurance | 4 | $201B |
|
||
| Consumer Goods | 4 | $87B |
|
||
| Industrial Machinery | 3 | $64B |
|
||
| Healthcare | 2 | $55B |
|
||
| Retail / Pharmacy | 1 | $148B |
|
||
| Agriculture / Food | 1 | $86B |
|
||
Price history
+399.7% since first listed13 events — show timeline
- 2026-05-25 Listed $149,900 MRED as Distributed by MLS Grid
- 2026-05-15 Listing Removed — MRED as Distributed by MLS Grid
- 2026-03-27 Listed — MRED as Distributed by MLS Grid
- 2025-10-23 Contingent — MRED as Distributed by MLS Grid
- 2025-10-20 Listing Removed — MRED as Distributed by MLS Grid
- 2025-09-22 Relisted — MRED as Distributed by MLS Grid
- 2025-09-22 Price Changed — MRED as Distributed by MLS Grid
- 2025-09-17 Contingent — MRED as Distributed by MLS Grid
- 2025-07-27 Listed — MRED as Distributed by MLS Grid
- 2025-07-26 Listing Removed — MRED as Distributed by MLS Grid
- 2025-05-16 Price Changed — MRED as Distributed by MLS Grid
- 2025-04-08 Listed — MRED as Distributed by MLS Grid
- 1988-03-01 Sold (Public Records) $30,000 Public Records
Property tax history
+1.6%/yrLatest (2023): $2,925 · +148.0% YoY. Source: county tax records.
Cash-flow waterfall
monthlySold comps — $/sqft
last 12 mo · ≤1 miLoading sold comps…